Pipeline Transportation Market Size and Share
Market Overview
| Study Period | 2020 - 2031 |
|---|---|
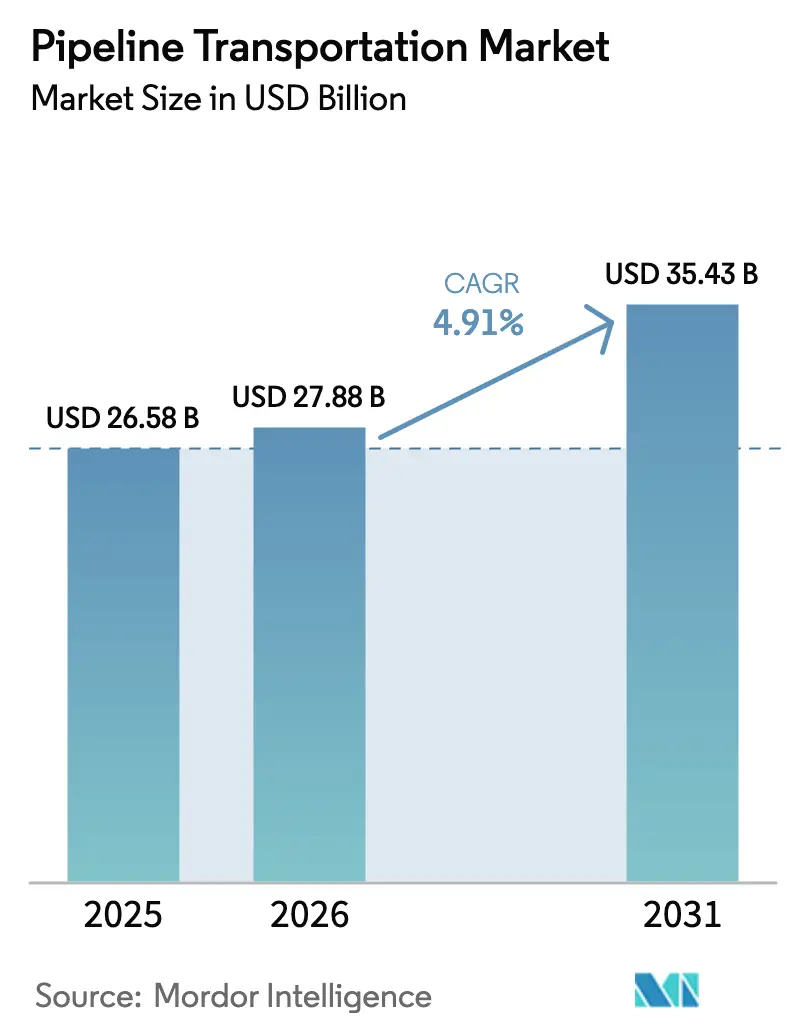
| Market Size (2026) | USD 27.88 Billion |
| Market Size (2031) | USD 35.43 Billion |
| Growth Rate (2026 - 2031) | 4.91% CAGR |
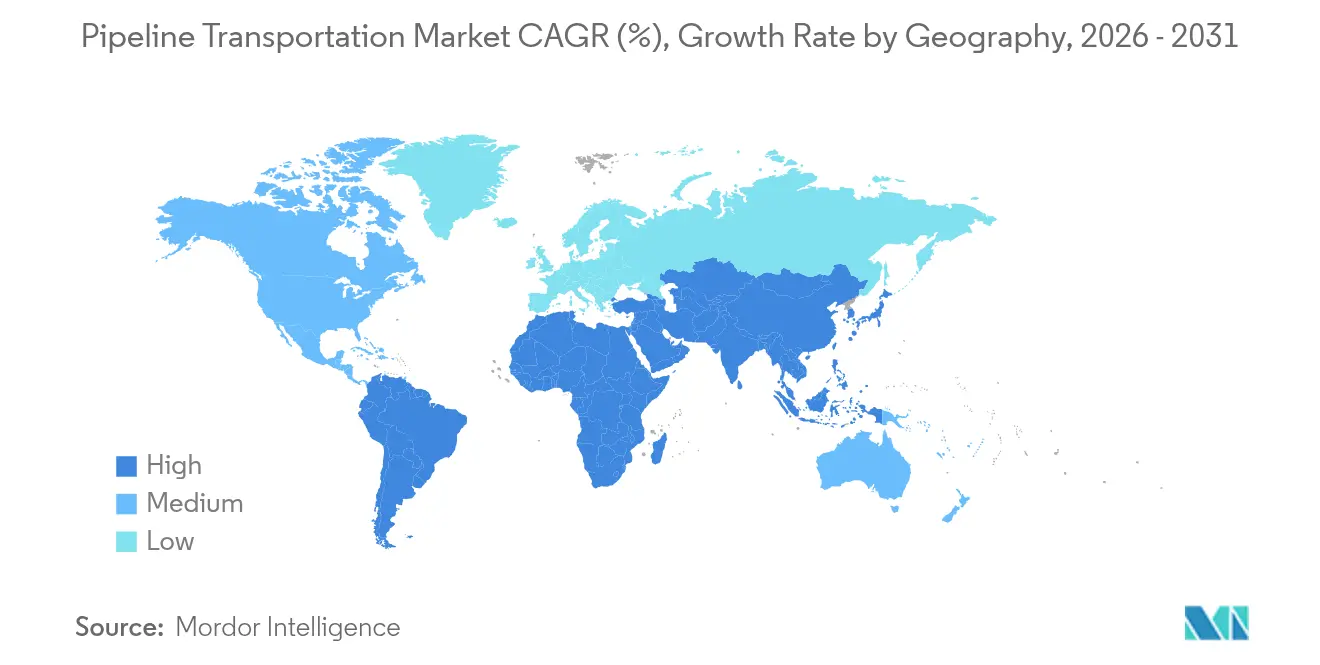
| Fastest Growing Market | Asia Pacific |
| Largest Market | North America |
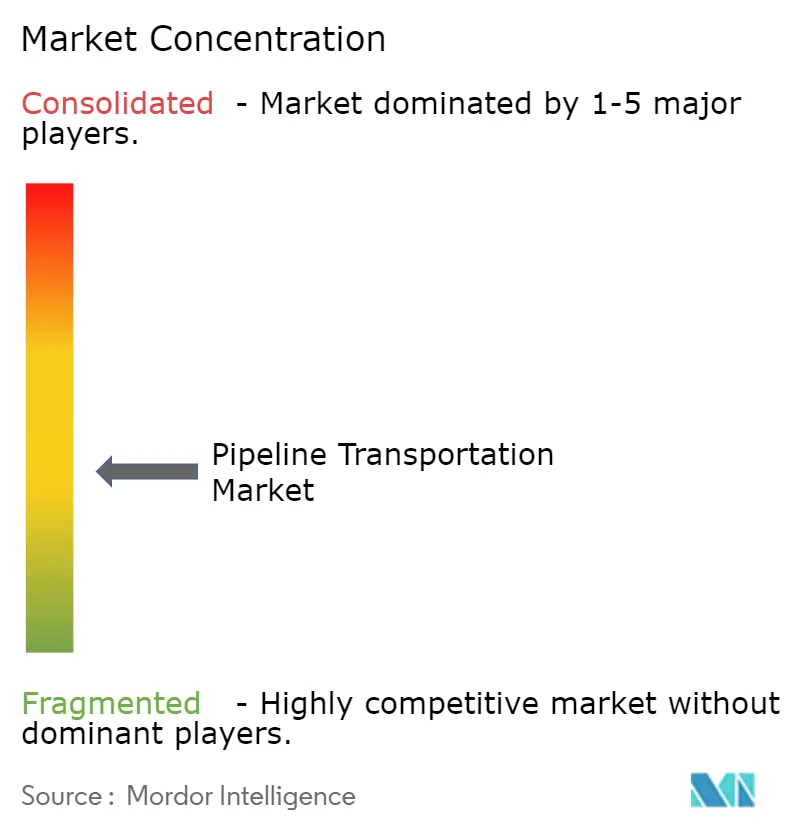
| Market Concentration | Medium |
Major Players *Disclaimer: Major Players sorted in no particular order Image © Mordor Intelligence. Reuse requires attribution under CC BY 4.0. | |
Pipeline Transportation Market Analysis by Mordor Intelligence
The pipeline transportation market size in 2026 is estimated at USD 27.88 billion, growing from 2025 value of USD 26.58 billion with 2031 projections showing USD 35.43 billion, growing at 4.91% CAGR over 2026-2031. Sustained energy demand in emerging economies, the build-out of carbon-capture networks, and fast-tracked hydrogen corridors are together reinforcing the long-term appeal of pipelines as the lowest-cost and lowest-emission bulk-transport option. North American LNG export growth is stretching cross-border capacity, while Asian operators are installing IoT-enabled integrity systems to cut downtime. In Europe, accelerated permitting for a hydrogen backbone is blending decarbonization goals with reuse of existing gas lines. Operators worldwide are layering digital twins, causal AI, and advanced sensors onto legacy assets, squeezing out inefficiencies and elevating environmental performance.
Key Report Takeaways
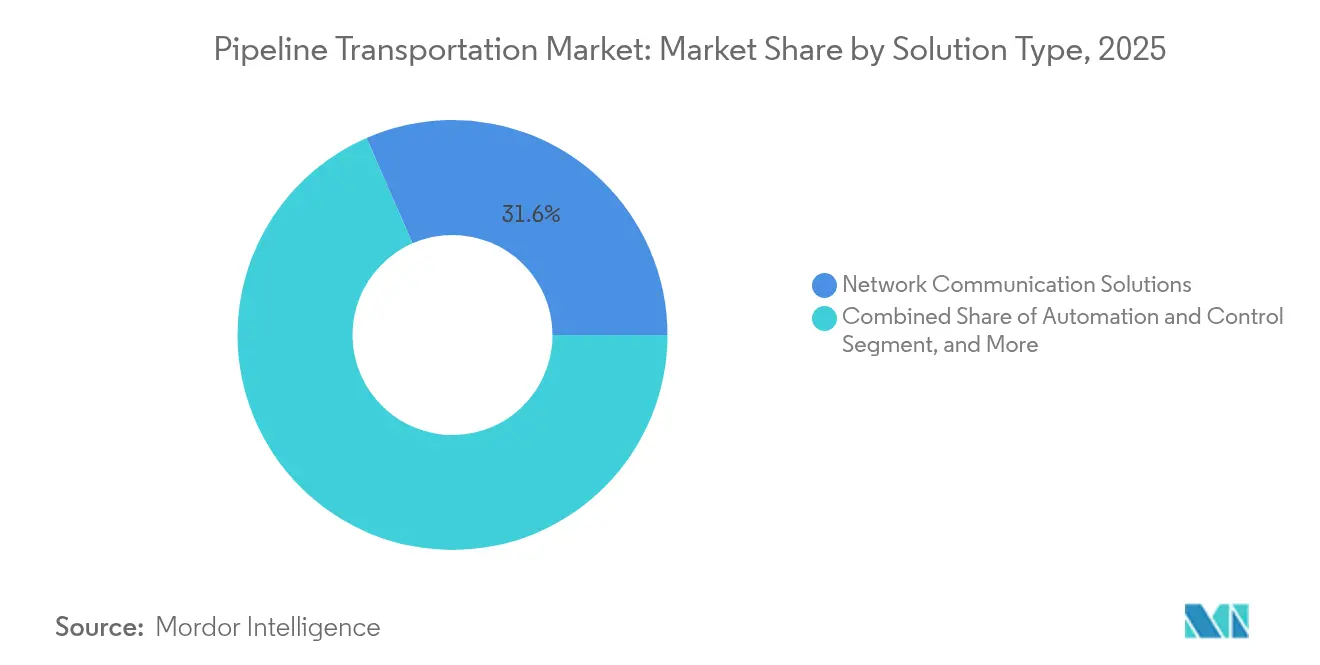
- By solution type, Network Communication Solutions led with 31.55% of pipeline transportation market share in 2025, while Automation & Control is set to expand at a 5.62% CAGR through 2031.
- By service type, Maintenance & Support services accounted for 39.35% share of the pipeline transportation market size in 2025; Managed Services are forecast to post a 6.89% CAGR to 2031.
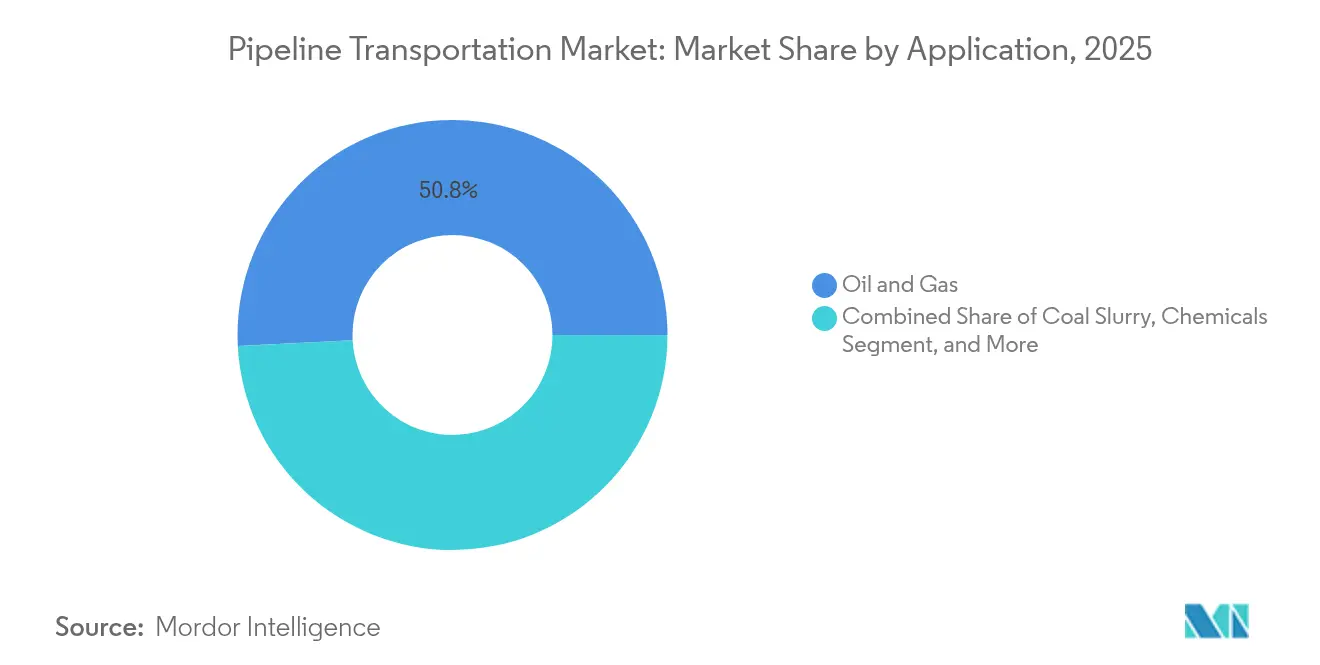
- By application, Oil & Gas held 50.82% of the pipeline transportation market in 2025, whereas CCS-dedicated CO₂ pipelines are projected to log a 6.05% CAGR through 2031.
- By pipeline operation, Transmission lines commanded 62.88% of revenue in 2025, with Gathering systems advancing at a 6.17% CAGR to 2031.
- By geography, North America dominated with a 42.95% share in 2025; Asia Pacific is the fastest-growing region at a 6.08% CAGR to 2031.
Note: Market size and forecast figures in this report are generated using Mordor Intelligence’s proprietary estimation framework, updated with the latest available data and insights as of 2026.
Global Pipeline Transportation Market Trends and Insights
Drivers Impact Analysis*
| Driver | (~) % Impact on CAGR Forecast | Geographic Relevance | Impact Timeline |
|---|---|---|---|
| Rising North American LNG export commitments widening cross-border pipeline capacity gaps | +1.2% | North America; spillover in Europe & Asia | Medium term (2-4 years) |
| Accelerated permitting for hydrogen backbone projects in the EU | +0.8% | Europe; knowledge transfer to North America & Asia | Medium term (2-4 years) |
| Surge of carbon capture & sequestration projects requiring CO₂-dedicated pipelines | +1.1% | North America & Europe; emerging Asia Pacific | Long term (≥ 4 years) |
| IoT-enabled predictive integrity management reducing unplanned downtime in Asia | +0.7% | Asia Pacific; global adoption to follow | Short term (≤ 2 years) |
| Arctic offshore discoveries driving ultra-long sub-sea pipeline builds | +0.5% | Arctic regions, Russia, Norway, Canada | Long term (≥ 4 years) |
| Integrated Pipeline-as-a-Service contracts unlocking capital-light models | +0.4% | Global; early uptake in Africa & South America | Medium term (2-4 years) |
| Source: Mordor Intelligence | |||
Rising North American LNG Export Commitments Widening Cross-Border Pipeline Capacity Gaps
The United States became the world’s largest LNG exporter in 2024, yet takeaway capacity from prolific basins lags production growth.[1]Federal Energy Regulatory Commission, “2024 – State of the Markets,” ferc.govPermian gas output nearly doubled, driving negative price spikes at the Waha Hub and prompting 8,689 miles of new construction plus 11,143 miles in planning. Projects such as Gulf Run and Matterhorn Express have already added 10.1 Bcfd of interstate capability, easing flaring and stabilizing regional prices.[2]U.S. Energy Information Administration, “Natural Gas Data,” eia.govState regulators view these expansions as critical to sustaining export schedules and maintaining producer economics, reinforcing the centrality of the pipeline transportation market to continental energy security.
Accelerated Permitting for Hydrogen Backbone Projects in the EU
Europe’s hydrogen pivot compressed permitting cycles and unlocked upfront funding. The European Hydrogen Backbone envisions 53,000 km of pipes by 2040, with 60% repurposed from existing gas lines.[3]European Hydrogen Backbone, “European Hydrogen Backbone,” ehb.eu January 2025 saw a EUR 250 million allocation for early-stage corridors, while the Renewable Energy Directive III set binding targets that pull private investment forward. Northwest Europe alone could host 13,000 km by the early 2030s, positioning the region as a global test bed for hydrogen logistics and stimulating technology transfer into the broader pipeline transportation market.
Surge of Carbon Capture & Sequestration Projects Requiring CO₂-Dedicated Pipelines
Active CCUS facilities rose 16.3% to 50 in 2024, and fresh EPA rules mandate 90% carbon capture at coal-fired plants by 2032. Analysts project 30,000-96,000 miles of new CO₂ lines to connect emitters with sinks, dwarfing today’s footprint. Canada is echoing the trend by extending the Alberta Carbon Trunk Line and backing new hubs in Saskatchewan.[4]Canada Energy Regulator, “Canada Is Expanding Its CO₂ Pipeline Network,” cer-rec.gc.ca Operators are re-tooling material specs and compression stations, driving sustained demand inside the pipeline transportation market.
IoT-enabled predictive integrity management reducing unplanned downtime in Asia
Asian operators deploy dense sensor networks and cloud analytics that flag anomalies before failure. A systematic review of big-data approaches showed predictive models boost detection accuracy and slash maintenance costs. Early adopters in China and India report downtime cuts of up to 30%, validating the commercial case. Vendors such as ABB and Siemens now package AI algorithms with edge devices, helping the pipeline transportation market transition from schedule-based to condition-based maintenance.
Restraints Impact Analysis*
| Restraint | (~) % Impact on CAGR Forecast | Geographic Relevance | Impact Timeline |
|---|---|---|---|
| Escalating cyber-security compliance costs for SCADA upgrades | -0.6% | Global; peak pressure in North America & Europe | Short term (≤ 2 years) |
| Grass-root opposition delaying right-of-way approvals in Latin America | -0.4% | Latin America; similar patterns in Asia | Medium term (2-4 years) |
| Hydrogen embrittlement risk in repurposed gas pipelines | -0.5% | Europe & North America | Medium term (2-4 years) |
| Intensifying competition from small-scale LNG shipping on short coastal routes | -0.3% | Asia Pacific, Europe, Middle East | Short term (≤ 2 years) |
| Source: Mordor Intelligence | |||
Escalating Cyber-Security Compliance Costs for SCADA Upgrades
Operational-technology guidance issued in January 2025 lists 12 mandatory security elements, including encrypted protocols and real-time anomaly detection. Many operators still rely on legacy platforms, so upgrades demand new hardware, software, and workforce training. PHMSA rules layered leak-detection requirements onto the same assets, escalating budget strain for small and mid-sized firms. Capital reallocation toward compliance can delay expansion projects, tempering near-term growth in the pipeline transportation market.
Hydrogen Embrittlement Risk in Repurposed Gas Pipelines
Laboratory studies highlight crack growth linked to H₂S/CO₂ ratios, blend percentages, and steel grade. With 60% of Europe’s planned hydrogen network slated for repurposing, operators must run costly material tests, apply internal coatings, or lower operating pressures0all of which erode the cost-saving premise. The added complexity restrains the pace at which the pipeline transportation market can pivot toward hydrogen.
*Our forecasts treat driver/restraint impacts as directional, not additive. The impact forecasts reflect baseline growth, mix effects, and variable interactions.
Segment Analysis
By Solution Type: Network Communication Solutions Lead Market Share While Automation Drives Growth
Network Communication Solutions commanded 31.55% of the pipeline transportation market in 2025, underlining the pivotal role of robust data links for safe operations. Advanced fiber-optic sensing extends leak-detection reach in real time, while private LTE and emerging 5G-A networks knit together remote assets across deserts, tundra, and offshore fields. ABB and Siemens have deployed multi-layer architectures that integrate edge processors with cloud analytics, shortening decision cycles and elevating situational awareness. Adoption is highest where regulatory bodies enforce stringent leak-detection intervals, particularly in North America and Europe. Security overlays such as zero-trust frameworks are becoming standard, reflecting a sector-wide push to defend critical infrastructure.
Automation & Control platforms exhibit the fastest growth at 5.62% CAGR, fueled by AI-driven optimization that tightens set points and slashes energy consumption. Emerson’s energy-efficient actuators and Schneider Electric’s modular control cabinets allow unmanned platform operation, eliminating ventilation and habitation loads. Adaptive algorithms adjust pump-station throughput to real-time demand, saving electricity and reducing linepack swings. Over the forecast horizon, vendors plan to embed physics-based digital twins that anticipate failure and dispatch maintenance crews before alarms escalate. Consequently, the solution sub-segment is expected to absorb an outsized share of incremental spending, lifting overall pipeline transportation market size in the software and electronics supply chain.


By Service Type: Maintenance & Support Services Secure Market Leadership While Managed Services Accelerate
Maintenance & Support retained a commanding 39.35% stake in the pipeline transportation market size for services in 2025. Ageing assets in North America and Europe need corrosion surveys, pigging, valve refurbishment, and regulatory documentation. API’s 2023-2025 strategic plan linked a 23% incident reduction to disciplined maintenance programs. Tier-1 contractors bundle inspection, repair, and integrity analytics, aligning with operator targets for zero incidents. High-definition inline-inspection tools now collect terabytes per run, requiring specialized data analysis that reinforces vendor lock-in and underlines customer reliance on external expertise.
Managed Services record the swiftest advance with a 6.89% CAGR. Operators are outsourcing control-room staffing, cybersecurity, and compliance reporting to lighten internal workloads. Pipeline-as-a-Service contracts shift capex into opex, improving balance-sheet optics and unlocking expansion capital. European utilities experimenting with “capacity as a subscription” contracts for hydrogen corridors attest to the model’s appeal. The reliance on service partners deepens vendor relationships and injects recurring revenue, strengthening the commercial fundamentals of the pipeline transportation market.
By Application: Oil & Gas Maintains Dominance While CCS Pipelines Emerge as Growth Leader
Oil and Gas continued to contribute 50.82% of revenue in 2025, supported by a U.S. network that topped 885,233 operational miles. Daily gas demand hit a record 99.7 bcf, propelled by LNG exports and power generation. Expansion in the Haynesville and Marcellus basins induced fresh gathering and compression spending, while crude-focused projects in the Permian lifted condensate takeaway. Even in transition-minded Europe, secure gas supply remains a political priority, preserving a multi-billion-dollar project slate. As legacy systems age, the oil-weighted share of pipeline transportation market size will decline slowly yet remain dominant through 2031.
CCS-dedicated pipelines, growing at 6.05% CAGR, are the clear up-and-coming segment. Northern Lights in Norway started injecting CO₂ in September 2024, opening a pan-European storage service. In the United States, Tallgrass Energy’s Trailblazer conversion marks a key pivot from hydrocarbons to carbon transit. Tax credits under the Inflation Reduction Act cut breakeven transport costs and back further projects. Material suppliers are developing corrosion-resistant alloys and high-compression turbo-expanders tailored to dense-phase CO₂. These innovations broaden the addressable base and solidify the growth trajectory of the pipeline transportation market.
By Pipeline Operation: Transmission Pipelines Maintain Market Leadership as Gathering Systems Expand Rapidly
Transmission lines accounted for 62.88% of 2025 revenue, transporting large volumes over interstate and cross-border routes. The United States alone added 10.1 Bcfd of interstate capacity, the highest annual build since 2018. Investments focus on debottlenecking supply to LNG export terminals on the Gulf Coast and integrating renewable gas blends. High-pressure specifications, automation systems, and enhanced leak-detection mandate capital outlays that keep the segment dominant in pipeline transportation market share.
Gathering systems, tied mostly to shale plays, are growing at 6.17% CAGR. Network length reached 500,854 miles in 2024, up from 491,000 miles a year earlier. New PHMSA rules require advanced leak surveys and accelerated repair, prompting small operators to modernize. Miniaturized inspection robots and cloud-based compliance dashboards lower entry barriers for tech providers. Regionally, the Permian and Haynesville drive the lion’s share of additions, but emerging plays in Argentina’s Vaca Muerta and Canada’s Montney also anchor fresh build cycles, further enlarging global pipeline transportation market size.
Geography Analysis
North America holds 42.95% of revenue, anchored by the United States’ 885,233 mile gas grid and record LNG exports that necessitate fresh pipelines to coastal terminals. The Permian Basin, responsible for 46% of U.S. crude, continues to see incremental takeaway builds such as Matterhorn Express, which has curtailed flaring and stabilized differentials. Canada’s extension of the Alberta Carbon Trunk Line signals increasing commitment to CCUS infrastructure. Regulation remains a double-edged sword: while safety mandates spur technology spending, protracted permitting can stall cross-border links.
Asia Pacific registers the fastest CAGR at 6.08%. China’s West-East gas pipelines and India’s Urja Ganga project exemplify national schemes to displace coal with gas. Regional demand accounted for 45% of global gas growth in 2024, reinforcing the build-out of long-haul lines. IoT-enabled integrity systems cut downtime by up to 30%, accelerating returns on capital and drawing in investors. Still, geopolitical frictions and land-acquisition obstacles in Southeast Asia can delay schedules.
Europe is reshaping its network under decarbonization and security imperatives. The halt in Russian transit tightened supply and boosted LNG intake, prompting reverse-flow upgrades. The European Hydrogen Backbone targets 53,000 km by 2040, supported by a EUR 250 million funding tranche announced in January 2025. Six hydrogen corridors will link production hubs with industrial centers, demanding pipeline repurposing and new compression technology. Carbon pipelines tied to the North Sea storage sites also move forward, providing an additional lever for growth in the pipeline transportation market.
Latin America’s mixed landscape blends mature oil corridors with greenfield gas opportunities. TC Energy’s Southeast Gateway in Mexico is slated for mid-2025 start-up, strengthening regional supply. Grass-root protests in Brazil and Argentina extend permitting timelines and elevate costs, yet innovative community-benefit frameworks show promise in de-risking future lines. Bolivia’s open-access rules demonstrate an alternative model that balances state control with private investment.
The Middle East and Africa feature abundant hydrocarbon reserves and high-capacity trunk lines, yet security and financing hurdles persist. Gulf states expand crude and product networks to accommodate refinery upgrades, while East African nations pursue export lines for nascent gas discoveries. In Africa, PaaS models for mineral slurries illustrate how capital-light strategies can unlock projects even when traditional funding is scarce.

Competitive Landscape
Market concentration is moderate, with ABB, Siemens, Emerson Electric, and Schneider Electric leveraging diversified portfolios to secure large automation and integrity contracts. Each is embedding AI, digital twins, and cybersecurity into core offerings, turning compliance burdens into value propositions. In North America and Europe, these incumbents face specialty rivals that market single-purpose leak-detection or inspection drones, intensifying competition around innovation velocity.
Service-centric strategies are proliferating. Honeywell now emphasizes subscription-based performance analytics, promising operators guaranteed uptime. Emerson’s unmanned platform solutions demonstrate how integrated automation can collapse operating expenses and reduce emissions. White-space opportunities persist in Asia Pacific and Latin America, where infrastructure build-out coincides with operator appetite for turnkey services. Hydrogen transport and CCUS corridors form new battlegrounds, demanding material science and automation upgrades distinct from oil and gas norms.
Disruptive entrants such as Baker Hughes’ ultrasonic sensor arrays and Halliburton’s autonomous inspection swarms raise detection accuracy and lower false-positive rates, pressing incumbents to accelerate R&D. Regulatory milestones—such as PHMSA’s 2025 leak-detection rule—force operators to act, effectively enlarging addressable demand for monitoring technologies. The net effect is a dynamic pipeline transportation market where digital capability, service breadth, and regulatory foresight determine competitive standing.
Pipeline Transportation Industry Leaders
ABB
Emerson Electric Co.
TechnipFMC plc
Siemens AG.
ESRI
- *Disclaimer: Major Players sorted in no particular order

Recent Industry Developments
- May 2025: TechnipFMC implemented a Norwegian CCS project storing 1.5 million t CO₂ annually, with plans to expand capacity to 5 million t.
- May 2025: Emerson Electric supplied 200+ actuators to a Dutch North Sea gas platform enabling fully unmanned, near-zero-emission operation
- March 2025: Siemens AG launched a new digital pipeline monitoring suite, broadening its growth prospects in the pipeline transportation market.
- March 2025: The European Union approved state-aid schemes for renewable hydrogen production in Austria and Lithuania.


Research Methodology Framework and Report Scope
Market Definitions and Key Coverage
Our study defines the pipeline transportation market as revenues generated from the design, construction, operation, and maintenance of transmission, distribution, and gathering pipelines that carry oil & gas, coal slurry, water, chemicals, and emerging CO₂ or hydrogen streams. The valuation refers to end-user spending on solutions and associated services supplied by specialist vendors and service providers worldwide.
Scope exclusion: we do not cover sales of pipeline fabrication steel, inspection drones, or downstream refinery throughput.
Segmentation Overview
- By Solution Type
- Security Solutions
- Automation and Control
- Integrity and Tracking Solutions
- Network Communication Solutions
- Other Solutions
- By Service Type
- Consulting Services
- Managed Services
- Maintenance and Support
- By Application
- Oil and Gas
- Coal Slurry
- Chemicals
- Water and Wastewater
- Other Applications
- By Pipeline Operation
- Transmission Pipelines
- Distribution Pipelines
- Gathering Pipelines
- By Geography
- North America
- United States
- Canada
- Mexico
- Europe
- Germany
- United Kingdom
- France
- Italy
- Spain
- Russia
- Nordics
- Rest of Europe
- Asia-Pacific
- China
- Japan
- South Korea
- India
- South East Asia
- Australia
- Rest of Asia-Pacific
- South America
- Argentina
- Brazil
- Rest of South America
- Middle East and Africa
- Middle East
- United Arab Emirates
- Saudi Arabia
- Qatar
- Rest of Middle East
- Africa
- South Africa
- Nigeria
- Rest of Africa
- Middle East
- North America
Detailed Research Methodology and Data Validation
Primary Research
Mordor analysts interviewed EPC contractors, mid-stream operators, and digital-solution suppliers across North America, Europe, the GCC, China, and Australia. Conversations clarified average project lead times, prevailing service price points, and real-world adoption rates for automation modules, helping us validate secondary indicators and close data gaps before triangulation.
Desk Research
We began with publicly available fundamentals such as production and trade volumes from the International Energy Agency, U.S. EIA, Eurostat, China National Bureau of Statistics, and OPEC. Complementary insights came from trade associations like the International Association of Oil & Gas Producers and the Global CCS Institute, plus patent trends drawn from Questel and corporate 10-K filings. For regional capex pipelines, customs shipment records accessed via Volza and contract notices on Tenders Info added crucial project-level context. These sources framed historical demand, price corridors, and network expansion. The list is indicative; many other references supported data checks throughout the build.
Market-Sizing & Forecasting
A top-down "throughput-to-spend" model converts regional oil, gas, and water volumes into required pipeline kilometers, applies weighted average capex & opex per kilometer, then layers software-service penetration to recreate 2025 spend. Supplier roll-ups and sampled ASP × deployment checks give bottom-up cross-tests, with divergences reconciled through iterative expert calls. Key variables include crude production growth, LNG trade lanes, carbon-capture project pipeline length, integrity audit frequency, and average automation module cost. Forecasts to 2030 rely on multivariate regression blended with scenario analysis for energy-transition pace; coefficients are stress-tested with three macro cases shared with industry respondents.
Data Validation & Update Cycle
Outputs pass anomaly checks, peer review, and variance thresholds before sign-off. We refresh the model annually and issue interim updates when material events, such as major pipeline sanctions or hydrogen policy shifts, impact assumptions.
Why Our Pipeline Transportation Baseline Commands Reliability
Published estimates often diverge because firms pick different service bundles, treat software separately, or convert local currencies at inconsistent dates.
Key gap drivers include inclusion of gathering-line fabrication in some models, differing views on hydrogen pipeline ramp-up, and varied refresh cadences that miss mid-year cost inflation. Mordor's disciplined scope, live currency dashboard, and yearly expert recalibration narrow these variances.
Benchmark comparison
| Market Size | Anonymized source | Primary gap driver |
|---|---|---|
| USD 26.58 B (2025) | Mordor Intelligence | - |
| USD 21.48 B (2024) | Global Consultancy A | Excludes network communication software; conservative FX base year |
| USD 61.37 B (2024) | Industry Association B | Bundles pipe steel sales and process-services revenues, broader asset scope |
These contrasts show that while other publishers provide useful signals, Mordor's refreshed, scope-disciplined approach offers a balanced, transparent baseline that decision-makers can trace back to clear variables and repeatable steps.


Key Questions Answered in the Report
What revenue figures define the global pipeline transportation market in 2026 and 2031?
The market generates USD 27.88 billion in 2026 and is projected to rise to USD 35.43 billion by 2031, tracking a 4.91% CAGR.
Which region currently leads the industry and which one is expanding the quickest?
North America holds 42.95% of 2025 revenue thanks to shale-driven LNG exports, while Asia Pacific is set to grow at a 6.08% CAGR on the back of rapid industrialization and IoT-enabled integrity upgrades.
Which application area is posting the fastest growth, and what drives that momentum?
CCS-dedicated CO₂ pipelines deliver a 6.05% CAGR as EPA rules mandate 90% capture at coal plants, sparking demand for as much as 30,000–96,000 miles of new carbon-transport lines.
How are IoT and AI technologies improving operational efficiency for pipeline operators?
Dense sensor networks, edge analytics, and predictive algorithms allow operators in China and India to forecast failures, trimming unplanned downtime by up to 30% and shifting maintenance from reactive to condition-based scheduling.
Which regulatory milestones could have the most significant impact on investment decisions through 2031?
Key policies include PHMSA’s 2025 leak-detection rule for gas lines, the EPA’s final CO₂-capture mandate for power plants, and the EU’s fast-track permitting plus EUR 250 million funding for hydrogen corridors—each directing capital toward safety, decarbonization, and repurposed infrastructure.
What role will carbon-capture pipelines play in the industry’s medium-term outlook?
Projects such as Norway’s Northern Lights and the Trailblazer conversion in the United States confirm that large-scale CO₂ transport networks are moving from concept to operation, positioning the segment as a focal point for growth and technology innovation over the next decade.
Page last updated on:


