Parcel Sortation Systems Market Size and Share
Market Overview
| Study Period | 2020 - 2031 |
|---|---|
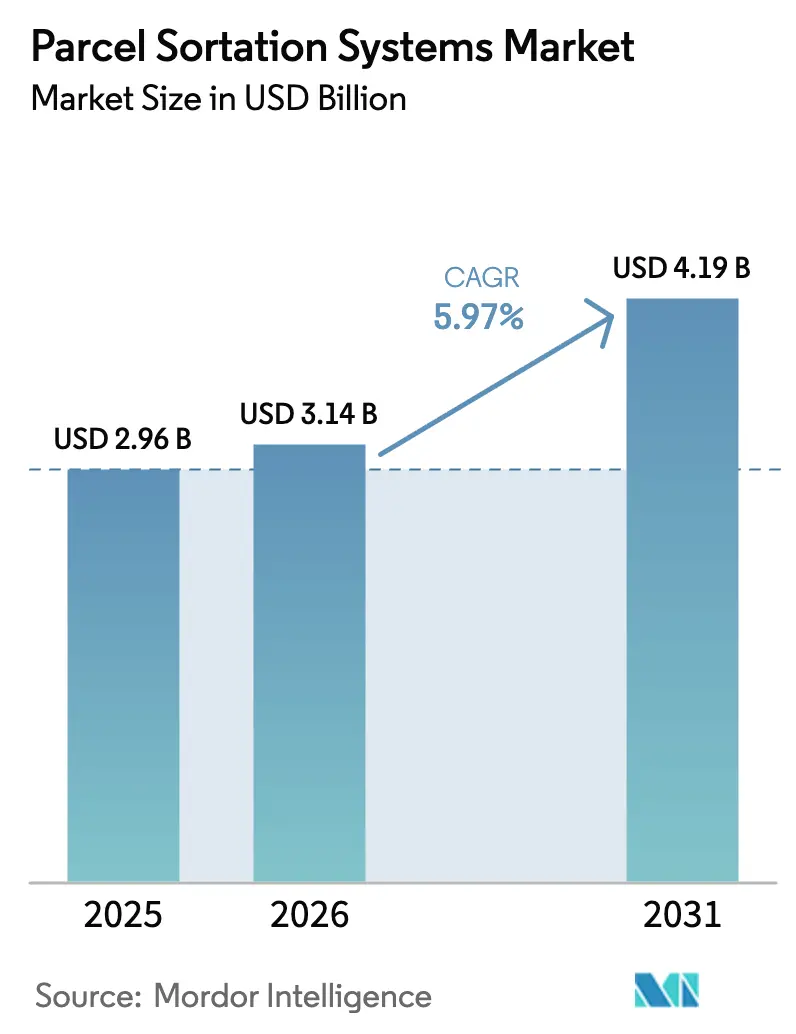
| Market Size (2026) | USD 3.14 Billion |
| Market Size (2031) | USD 4.19 Billion |
| Growth Rate (2026 - 2031) | 5.97% CAGR |
| Fastest Growing Market | Middle East and Africa |
| Largest Market | Asia Pacific |
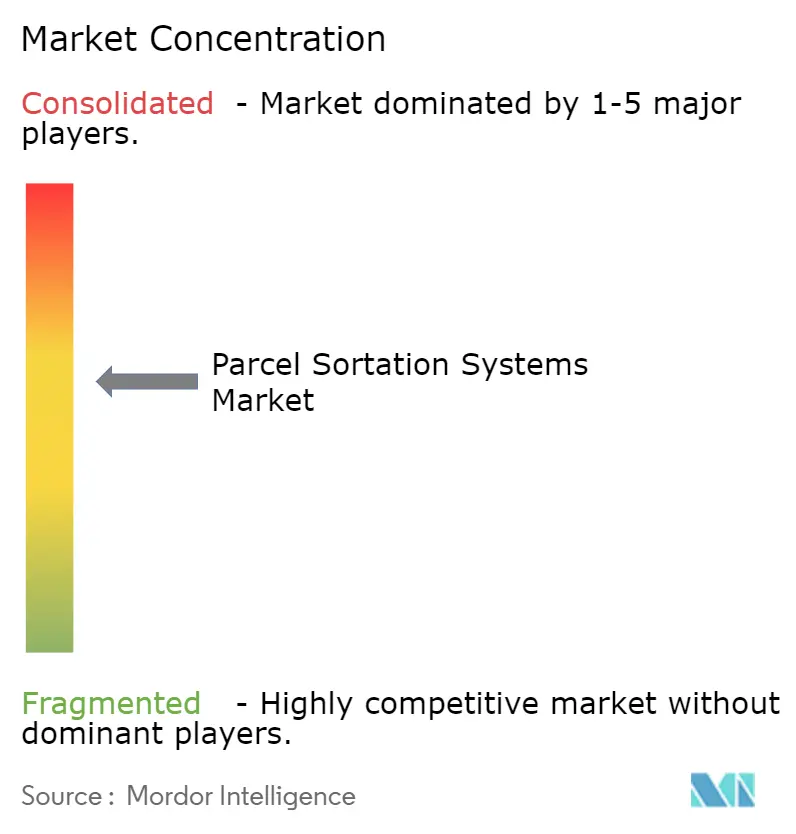
| Market Concentration | Medium |
Major Players *Disclaimer: Major Players sorted in no particular order Image © Mordor Intelligence. Reuse requires attribution under CC BY 4.0. | |
Parcel Sortation Systems Market Analysis by Mordor Intelligence
The parcel sortation systems market size was valued at USD 2.96 billion in 2025 and estimated to grow from USD 3.14 billion in 2026 to reach USD 4.19 billion by 2031, at a CAGR of 5.97% during the forecast period (2026-2031). E-commerce scale-up, the push for same-day delivery, and steady integration of AI into sorter controls keep capital spending intact even when macro-economic conditions soften. Labor scarcity in logistics hubs—from North America to the Middle East—further tilts operators toward automation, while Robotics-as-a-Service options ease budget hurdles for small and mid-sized users. The convergence of air-cargo modernization programs with cold-chain mandates opens specialized revenue pools for suppliers able to track individual units under strict temperature bands. Competitive pressure is intensifying as lower-priced Asian equipment closes performance gaps with incumbents, prompting established vendors to emphasize software intelligence and energy savings.[1]Interroll, “Crossbelt Sorter,” interroll.com BEUMER Group, “BG Sorter CB,” beumergroup.com
Key Report Takeaways
- By type, cross-belt technology led with 33.80% of parcel sortation systems market share in 2025; tilt-tray sorters are projected to expand at a 7.68% CAGR through 2031.
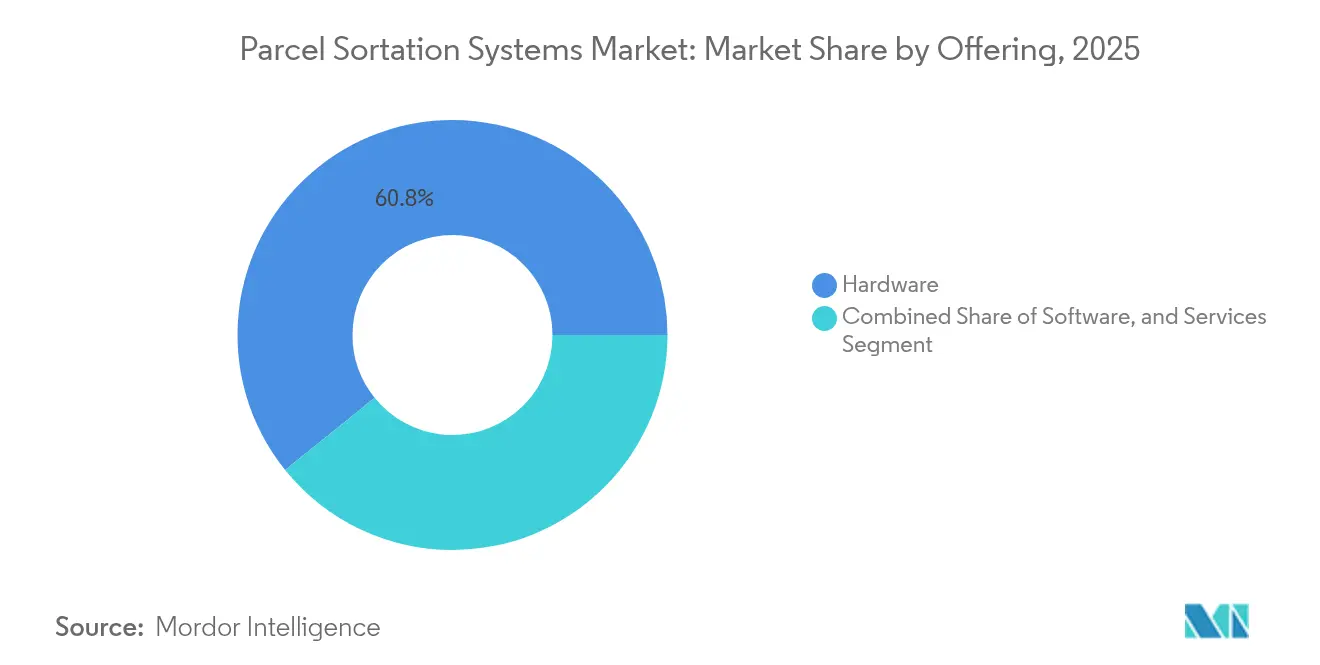
- By offering, hardware accounted for 60.80% of the parcel sortation systems market size in 2025, while software revenue is pacing an 7.95% CAGR toward 2031.
- By application, e-commerce fulfillment centers captured 46.30% of the parcel sortation systems market size in 2025; airports & air-cargo terminals are advancing at the fastest 6.70% CAGR to 2031.
- By throughput capacity, the 15,000–30,000 pph band held 37.70% of parcel sortation systems market share in 2025, whereas systems above 30,000 pph log the strongest 6.21% CAGR.
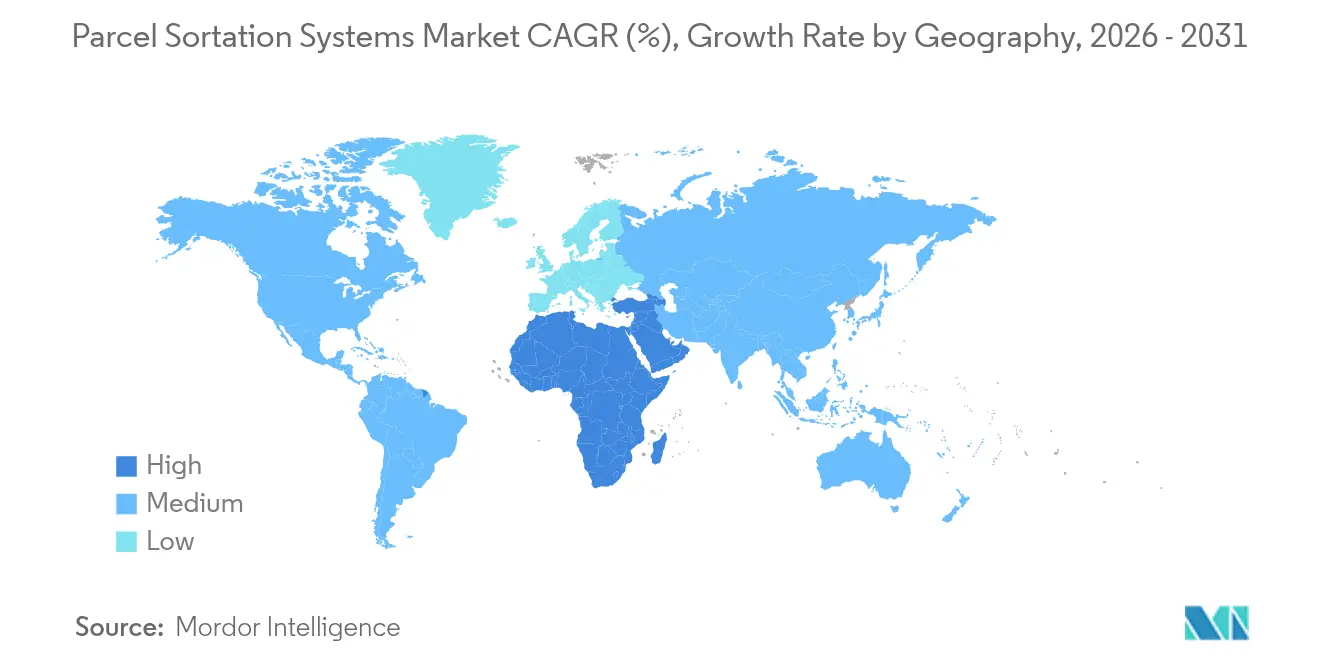
- By geography, Asia Pacific commanded 41.20% parcel sortation systems market share in 2025; the Middle East & Africa region posts the quickest 6.61% CAGR to 2031.
Note: Market size and forecast figures in this report are generated using Mordor Intelligence’s proprietary estimation framework, updated with the latest available data and insights as of 2026.
Global Parcel Sortation Systems Market Trends and Insights
Drivers Impact Analysis*
| Driver | (~) % Impact on CAGR Forecast | Geographic Relevance | Impact Timeline |
|---|---|---|---|
| E-commerce parcel volumes in tier-2 Asian cities | +1.8% | Asia Pacific with global spillover | Medium term (2-4 years) |
| Same-day delivery SLAs in North America | +1.2% | North America, emerging in Europe | Short term (≤ 2 years) |
| Airport cargo modernisation grants in Europe | +0.9% | Europe, global hubs | Medium term (2-4 years) |
| Pharma cold-chain mandates in Japan | +0.7% | Japan, developed APAC | Medium term (2-4 years) |
| Robotics-as-a-Service lowers CapEx | +1.1% | Global, strongest in NA & EU | Short term (≤ 2 years) |
| Labor scarcity and wage inflation in MEA hubs | +1.3% | Middle East & Africa | Short term (≤ 2 years) |
| Source: Mordor Intelligence | |||
E-commerce parcel volumes exploding in tier-2 Asian cities
Rising digital adoption beyond first-tier metros is pushing parcel loads past the limits of manual sorting. Operators in China’s interior provinces and secondary Southeast-Asian markets now require modular equipment that fits constrained buildings yet scales quickly. Regional integrators cite AI-driven sorters that self-adjust for skewed parcel mixes to cut re-work time and energy draw.[2]Asian Development Bank, “E-Commerce Evolution in Asia and the Pacific,” adb.orgCarriers such as S.F. Holding converted brownfield depots into automated hubs within 18 months, citing 25% faster cycle times and lower mis-sort costs in their 2024 report.[3]S.F. Holding Co., “2024 Annual Report,” sf-express.com
Same-day delivery SLAs forcing high-throughput automation in North America
Retailers moved from next-day to same-day promises, compressing pick-to-ship windows to mere hours. Sliding-shoe and cross-belt lines rated at 15,000–30,000 pph have become baseline for metro fulfillment centers. Honeywell notes service-level tightening is now elevating sorter accuracy over raw speed, driving demand for AI logic that reroutes parcels proactively when choke points emerge. DHL’s 2024 automation build-out underscores how network-wide sorter upgrades cut urban van mileage and loading dock dwell time.[4]DHL Group, “2024 Annual Report,” group.dhl.com
Airport cargo modernisation grants in Europe boosting sorter demand
EU aviation funds spur upgrades in freighter aprons and cargo sheds. Projects mandate integrated IT links between airport sorters and airline departure control, improving real-time load planning. The Airports Council International stresses that e-commerce packets dominate incremental tonnage and need parcel-grade sequencing rather than pallet handling. Automated systems that blend scan-weigh-dimension units with cross-belt sorting improve traceability and airline on-time metrics.
Pharma cold-chain integrity mandates driving unit-level tracking in Japan
Japan’s regulators require temperature history per item from factory to clinic. IoT-enabled tilt-tray modules equipped with non-contact cradles maintain ±1 °C variance through sortation. The JISC proposal for an ISO cold-chain committee signals movement toward global benchmarks. Vendors pairing sensors with digital twins let shippers visualize temperature spikes before release, safeguarding audit trails.
Restraints Impact Analysis*
| Restraint | (~) % Impact on CAGR Forecast | Geographic Relevance | Impact Timeline |
|---|---|---|---|
| High initial CapEx for Above 30 k pph systems | -1.2% | Global, sharper in emerging markets | Medium term (2-4 years) |
| Complex retrofit with legacy WMS | -0.8% | Global, older facilities | Short term (≤ 2 years) |
| Power penalties in cross-belt lines | -0.6% | High-tariff regions | Medium term (2-4 years) |
| Shortage of maintenance technicians in Africa | -0.4% | Africa, spillover to MEA | Long term (≥ 4 years) |
| Source: Mordor Intelligence | |||
High initial CapEx for Above 30 k pph systems constraining SMEs
Full-speed lines cost multiples of USD 5 million, a steep hurdle outside tier-one markets. Simulation studies show four times productivity gains yet note extended paybacks where financing runs above 9% interest. Vendors now pitch phased installs-beginning at 15 k pph-letting operators grow capacity without immediate mega-spends.
Complex retrofit integration with legacy WMS platforms
Brownfield sites running decade-old software struggle to interface with modern sorter PLCs. Hy-Tek’s WES stresses API depth and health-check dashboards to limit downtime during cutover. Academic work on digital twin overlays demonstrates how predictive modeling reduces integration surprises, but up-front engineering time remains hefty.
*Our forecasts treat driver/restraint impacts as directional, not additive. The impact forecasts reflect baseline growth, mix effects, and variable interactions.
Segment Analysis
By Type: Cross-belt strength, tilt-tray momentum
Cross-belt solutions held 33.80% parcel sortation systems market share in 2025, a position earned through gentle product handling and multi-format versatility. The Interroll sorter handles up to 10,300 items per hour while trimming energy use by 50% versus legacy linear motors. Meanwhile, the til-tray segment is the quickest riser, with a 7.68% CAGR projected between 2026 and 2031. Users value its small-footprint discharge design suited to dense urban depots where floor space is at a premium. Activated roller-belt lines remain attractive where mid-speed, low-maintenance targets prevail, especially in regions plagued by technician shortages. Across every design, sustainability metrics-kilowatt-hour per parcel, recyclability rates-now figure as prominently as throughput.
Adoption patterns also show a split by parcel profile. Apparel pure-plays lean toward tilt-tray to prevent snagging, while electronics shippers pick cross-belt units to protect fragile SKUs. Suppliers differentiate through quick-swap carriers and modular carrier frames that cut changeover times by 30%. The BEUMER BG Sorter CB, with 95% recyclable components, is winning bids tied to corporate sustainability scorecards.


By Throughput Capacity: Mid-range dominance, ultra-high acceleration
Lines in the 15,000–30,000 pph band held 37.70% parcel sortation systems market share during 2025 because they deliver big-hub productivity without eye-watering capital outlays. Global 3PLs favor these systems for regional depots feeding several urban spokes. The parcel sortation systems market size for this capacity tier is poised to stretch in tandem with omni-channel retail shipments.
Installations above 30,000 pph grow the quickest at 6.21% CAGR, powered by mega-hubs that stage seasonal peaks for national marketplaces. Peak-season stress tests in 2024 showed some hubs clearing 1 million parcels nightly, proving the merit of these ultra-high-speed loops.
The 5,000-15,000 pph tier serves operators moving from manual to automated, combining affordability with solid productivity. Interroll’s horizontal cross-belt ST 6160 can handle up to 15,000 items per hour in this range. Sub-5,000 pph systems remain relevant in pharmaceutical picking and returns centers where gentle handling outranks raw speed.
By Offering: Hardware dominance, software acceleration
Hardware captured 60.80% parcel sortation systems market size in 2025, reflecting the tangible nature of conveyors, drives, and structural steel that anchor every installation. A stainless-steel FORTNA cross-belt lane reaching 19,600 pph epitomizes high-spec engineering. Yet software revenue is scaling faster at an 7.95% CAGR through 2031 as operators mine data to fine-tune cycle times. AI-oriented WES modules shift decision logic from fixed rule sets to learning algorithms that weigh queue status, lane health, and downstream transport slots in real time. Predictive maintenance has moved beyond vibration alerts to include power-draw anomalies, signaling a motor slip before it hits throughput.
Service contracts, from annual maintenance to retrofits, form a rising annuity. Vendors bundle spares, remote troubleshooting, and firmware patches under multiyear deals that make revenue smoother than cyclical equipment orders. For buyers, outsourced expertise mitigates the technician shortfalls noted in Africa and parts of the Gulf.
By Application: E-commerce scale, air-cargo sprint
E-commerce fulfillment centers dominated with 46.30% parcel sortation systems market size in 2025 as direct-to-consumer brands and platforms chase one-day delivery norms. Here, variable SKU shapes demand sorters able to handle everything from polybags to oddly shaped home goods without jamming. CEP hubs follow closely, emphasizing standardized handling speeds and 24/7 uptime.
Airports & air-cargo terminals form the fastest-growing application, moving at a 6.70% CAGR to 2031. Boeing forecasts global air-cargo tonnage climbing 4.1% yearly through 2041, a tailwind for ground sortation upgrades that marry parcel logic with air-freight security scans. Pharmaceutical supply chains, though smaller, wield high margin potential via unit-level traceability mandates; recent Japan deployments show tilt-tray lines with thermal sensors driving acceptance tests. Grocery distribution is joining the queue as online food orders, many chilled or frozen, require gentle yet urgent routing to last-mile vehicles.
Geography Analysis
Asia Pacific led with 41.20% of parcel sortation systems market share in 2025, buoyed by booming online retail and government-supported logistics corridors. Demand radiates from tier-2 Chinese cities and Southeast-Asian metros where land constraints spur compact sorter footprints. Studies in Shenzhen highlight multi-story logistics campuses clustering around ring roads to curb urban truck trips, conditions favoring vertical, high-density automation. Forwarders in Japan and South Korea mix domestic parcel flows with export consolidation, raising sorter utilization above 18 hours per day.
North America stands second, shaped by tight labor markets and consumer expectations for sub-24-hour delivery. Operators deploy AI controls to squeeze more parcels per linear foot, minimizing green-field builds. Energy-efficiency metrics attract tax incentives, further sweetening upgrade economics.
Europe’s market blends modernization grants with sustainability mandates. Electric drive retrofits and noise-reducing carriers emerge as bidding requirements, especially around densely populated airports. The Economic Research Institute for ASEAN and East Asia shows automated lines boosting sort rates by 15× over manual benches, a datum mirroring EU ergonomics directives.
The Middle East & Africa posts the quickest 6.61% CAGR through 2031 on the back of e-commerce jumps and free-zone warehouse projects tied to Gulf airline networks. Saudi and UAE programs earmark automation to cap headcount exposure. Sub-Saharan nations, however, grapple with technician scarcity, pushing interest in low-touch modular systems with remote diagnostics.
Latin America remains early-stage but is catching up as cross-border marketplaces grow. Currency volatility elevates the appeal of leasing and RaaS models that shelter operators from large upfront dollar outlays.

Competitive Landscape
The parcel sortation systems market features moderate fragmentation. Global leaders Vanderlande, Dematic, and Beumer Group defend share through end-to-end service portfolios and sizable R&D budgets. Vanderlande’s April 2025 CROSSORTER 1500 launch illustrates the pivot toward AI-powered self-healing features and 30% energy cuts. Dematic’s March 2025 machine-learning WES upgrade underlines growing weight on software brains.
Asian vendors-Interroll, Fives, and a wave of Chinese entrants-compete vigorously on price-performance, shortening global delivery times by adding Vietnam and Malaysian factories. IP disputes, on USITC investigations, reveal how patents remain a key moat. Strategic partnerships proliferate; hardware builders team with vision-system firms to deliver integrated pick-scan-sort lines for micro-fulfillment. Emerging disruptors offer low-infrastructure robot swarms that can be rolled out in weeks, posing a longer-term threat to fixed conveyor dominance.
Vendor strategies pivot on energy efficiency, lifecycle service revenues, and rapid software iteration. Sustainability claims-components recyclable above 90%, carbon-neutral factories-are now standard slide-deck fare.
Parcel Sortation Systems Industry Leaders
Honeywell International Ltd.
Bastian Solutions
Beumer Group
Daifuku Co. Ltd.
Interroll Group
- *Disclaimer: Major Players sorted in no particular order

Recent Industry Developments
- April 2025: Vanderlande Industries introduced the CROSSORTER 1500 with AI predictive maintenance and 30% lower energy use.
- March 2025: Dematic launched an upgraded WES employing real-time machine learning for sorter routing.
- February 2025: Beumer Group won a USD 50 million Dubai air-cargo sorter contract.
- January 2025: Honeywell Intelligrated unveiled a next-generation sliding shoe sorter with 25% higher throughput.
- December 2024: Siemens Logistics acquired a software firm to bolster digital twin capabilities.


Research Methodology Framework and Report Scope
Market Definitions and Key Coverage
Our study defines the parcel sortation systems market as automated equipment lines that identify, route, and discharge packaged parcels by size, weight, barcode, or RFID at throughput speeds above 1,500 pieces per hour. The definition covers integrated hardware (conveyors, sorters, optical readers, controls) and the supervisory software that orchestrates the flow inside parcel hubs, fulfillment centers, and airports.
Scope exclusion: manual gravity conveyors and simple belt transports used only for point-to-point conveying are not included.
Segmentation Overview
- By Type
- Activated Roller-Belt Sorters
- Cross-Belt Sorters
- Tilt-Tray Sorters
- Push-Tray/Bombay Sorters
- By Offering
- Hardware
- Software (WCS, WES, AI Optimisation)
- Services (Installation, Retrofit, AMC)
- By Application
- E-commerce Fulfilment Centres
- Courier, Express and Parcel (CEP) Hubs
- 3PL and Contract Logistics Warehouses
- Airports and Air-Cargo Terminals
- Pharmaceutical and Medical Supply Chains
- Grocery and Food Distribution
- By Throughput Capacity (pph)
- less than 5,000 Parcels per Hour
- 5,000-15,000 Parcels per Hour
- 15,000-30,000 Parcels per Hour
- Above 30,000 Parcels per Hour
- By Geography
- North America
- Europe
- Asia-Pacific
- South America
- Middle East
- Africa
Detailed Research Methodology and Data Validation
Primary Research
Mordor analysts complemented desk work with interviews and web surveys involving systems integrators, control-system vendors, and operations managers at large 3PLs across North America, Europe, China, and the Gulf. These conversations confirmed regional cost spreads, duty cycles, and adoption triggers, and they also provided practical guardrails for sensor and software upgrade cycles that secondary sources rarely cover.
Desk Research
We began with global parcel flow data from the Universal Postal Union, regional courier shipment statistics released by USPS, Royal Mail, and Japan Post, and e-commerce sales indices from UNCTAD and the U.S. Census Bureau, which anchor volume variables. Equipment import-export codes retrieved from UN Comtrade help us view cross-border shipment values, while Eurostat PRODCOM and International Federation of Robotics tables clarify production footprints and automation penetration. Patents scraped through Questel illustrate emerging sorter geometries that influence future price curves. Annual reports, investor decks, and press releases from listed integrators supply average selling prices and capacity specifications. The sources cited are illustrative; many additional public and subscription datasets were reviewed for validation and clarity.
Market-Sizing & Forecasting
Parcel volumes by country form the top-down demand pool, which we reconstruct from postal statistics and e-commerce parcel indices, and then translate into sorter demand using penetration rates agreed upon during expert calls. Results are corroborated with selective bottom-up checks, sampled ASP x installed sorter counts drawn from listed vendors and major hub announcements, to fine-tune totals. Key variables in the model include average parcels handled per sorter per hour, automation share of new hub builds, regional labor cost inflation, and sorter replacement intervals. A multivariate regression, with parcel growth and labor inflation as leading indicators, generates the 2025-2030 forecast; scenario analysis adjusts for macro-trade shocks. Data gaps in supplier roll-ups are bridged by calibrated ratios from similar facility archetypes before final aggregation.
Data Validation & Update Cycle
Triangulation, variance flags, and peer review precede sign-off. Outputs are compared with independent shipment, capex, and unit shipment signals; anomalies trigger re-contacts. Mordor refreshes models each year, issuing interim updates if policy shifts or large corporate investments materially change the baseline, and an analyst rechecks figures immediately before delivery.
Why Mordor's Parcel Sortation Systems Baseline Stays Dependable
Published estimates differ because firms choose distinct scopes, base years, and price references.
Capacity cut-offs, inclusion of retrofit software, and forecast cadences further widen the gap.
Benchmark comparison
| Market Size | Anonymized source | Primary gap driver |
|---|---|---|
| USD 2.96 B (2025) | Mordor Intelligence | - |
| USD 2.15 B (2024) | Global Consultancy A | Excludes postal express hubs and updates every two years, so volume uplift from 2024 peak season is missing |
| USD 2.0 B (2023) | Market Forecaster B | Uses single global ASP without regional mix adjustment and leans on vendor press releases for base volumes |
The comparison shows that once scope breadth, timely refresh, and regional price spreads are aligned, figures converge toward Mordor's balanced midpoint. Decision-makers therefore gain a transparent, repeatable baseline anchored to clearly stated variables and refreshed on a predictable cadence.


Key Questions Answered in the Report
What is the current value of the parcel sortation systems market?
The market stands at USD 3.14 billion in 2026.
How fast will the parcel sortation systems market grow?
Revenue is set to climb at a 5.97% CAGR to reach USD 4.19 billion by 2031.
Which region leads parcel sortation investments?
Asia Pacific dominates with 41.20% market share in 2025, driven by rapid e-commerce expansion.
Which sorter type is growing the fastest?
Tilt-tray systems post the highest 7.68% CAGR between 2026 and 2031 thanks to versatility.
Why are software revenues rising quicker than hardware?
Operators view AI-driven WES platforms as the most efficient path to raise throughput without costly physical expansions, yielding an 7.95% CAGR for software.
How are SMEs overcoming high CapEx barriers?
Robotics-as-a-Service models convert automation into a pay-as-you-go expense, slashing upfront cash requirements and easing technology refresh cycles.
Page last updated on:


