Laser Processing Market Size and Share
Market Overview
| Study Period | 2020 - 2031 |
|---|---|
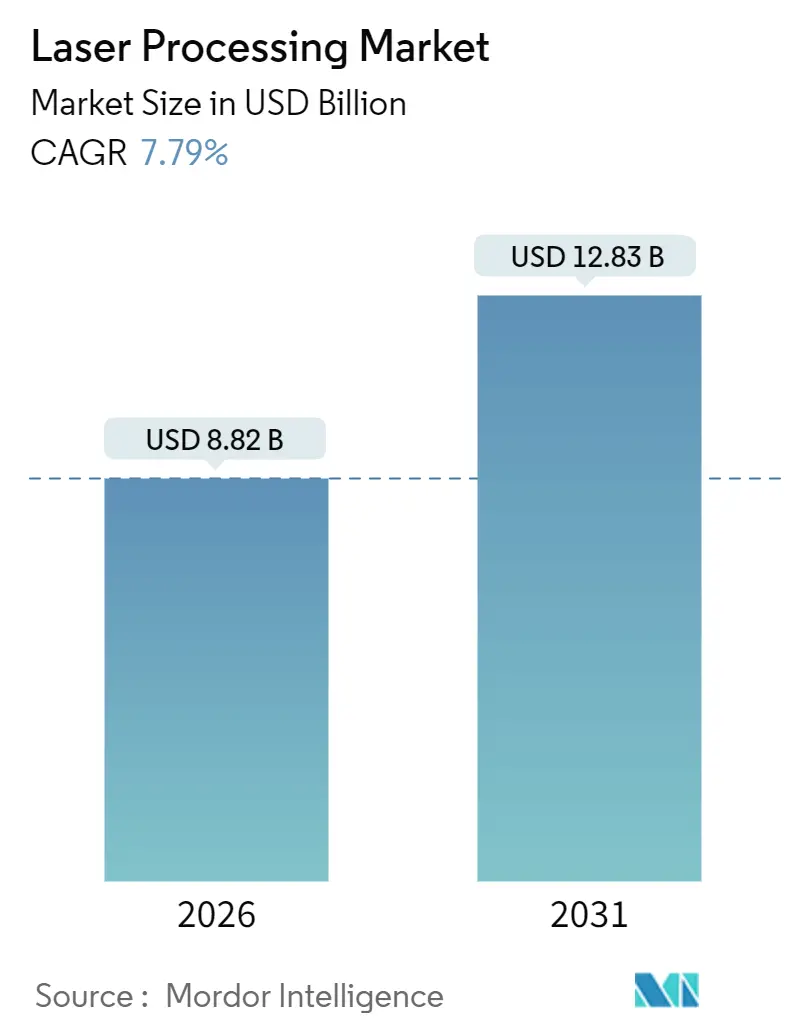
| Market Size (2026) | USD 8.82 Billion |
| Market Size (2031) | USD 12.83 Billion |
| Growth Rate (2026 - 2031) | 7.79% CAGR |
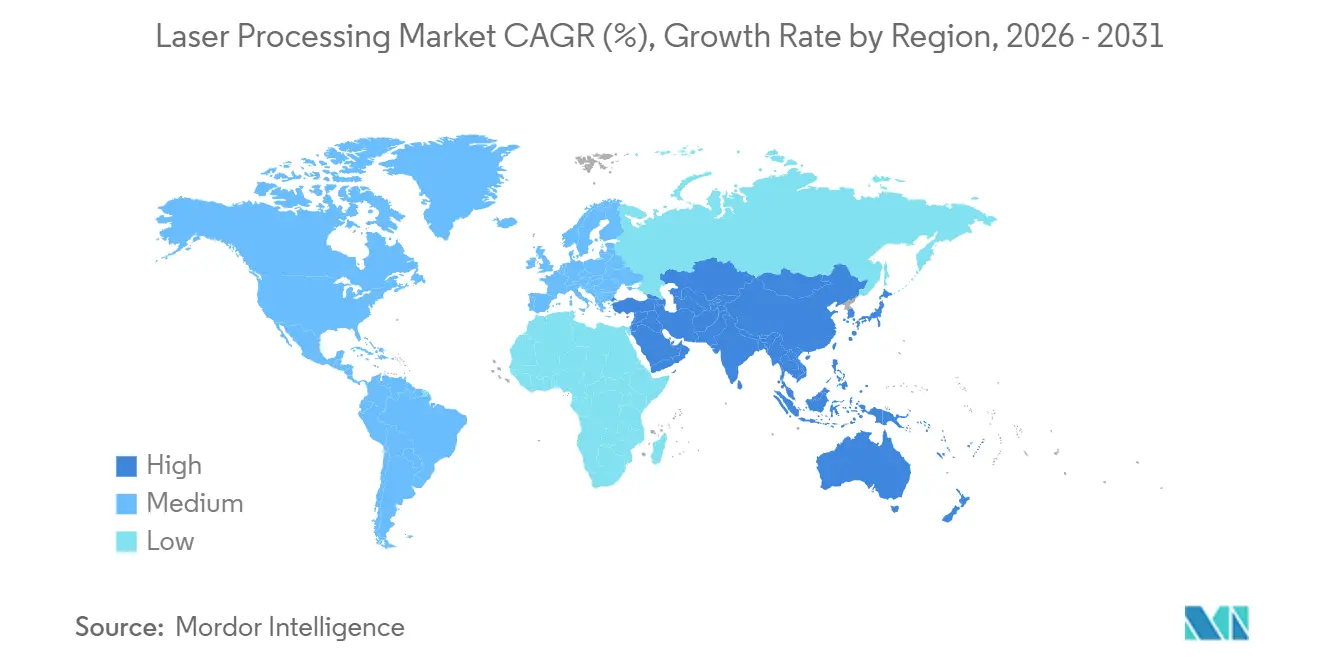
| Fastest Growing Market | Middle East |
| Largest Market | Asia Pacific |
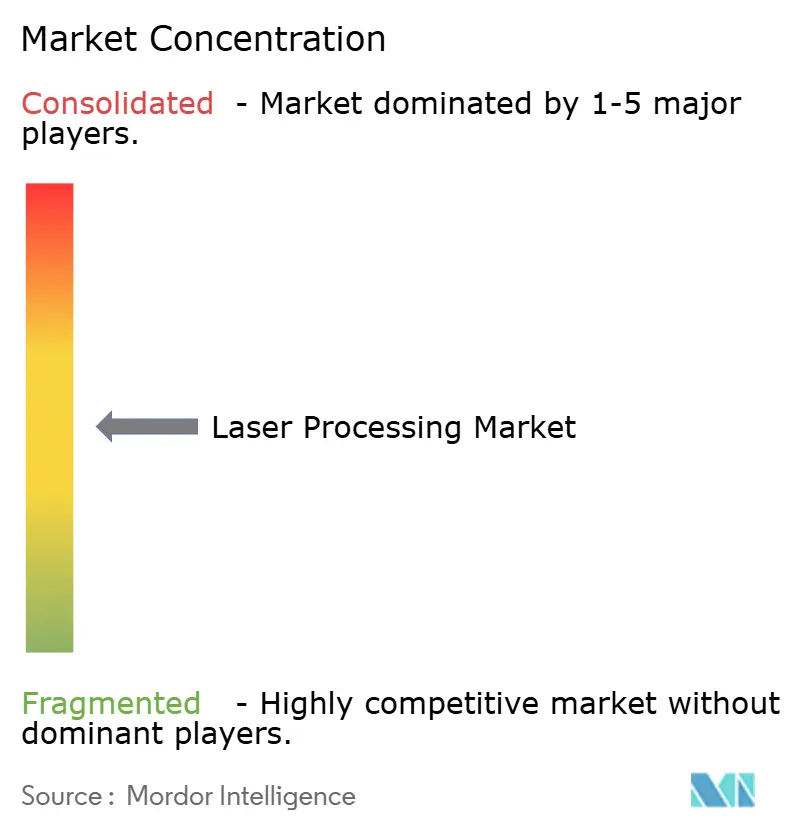
| Market Concentration | Medium |
Major Players *Disclaimer: Major Players sorted in no particular order Image © Mordor Intelligence. Reuse requires attribution under CC BY 4.0. | |
Laser Processing Market Analysis by Mordor Intelligence
The laser processing market size is valued at USD 8.82 billion in 2026 and is projected to climb to USD 12.83 billion by 2031, translating into a 7.79% CAGR during the forecast period. Energy-efficient fiber architectures, widening ultrafast-laser use in semiconductor and medical applications, and electrification-driven welding demand in battery plants are combining to reshape the laser processing market. Suppliers that once relied on mature CO₂ platforms are now re-tooling portfolios around kilowatt-class fiber sources that cut stainless steel 30% faster and consume no process gas, while femtosecond variants unlock delicate tissue ablation and chip-level micromachining. Asia Pacific dominates solar cell and electronics output, Europe accelerates gigafactory build-outs, and the Middle East funds greenfield advanced-manufacturing clusters. Price competition is intensifying because Chinese vendors deliver kilowatt fiber sources at 40% discounts yet narrow beam-quality gaps; meanwhile, Western incumbents answer with AI-enabled process monitoring that trims setup time and reduces scrap. Helium scarcity inflates CO₂ laser operating costs, nudging cost-sensitive users to fiber, and workforce shortages in photonics hubs could temper capacity expansions even as capex budgets rise.
Key Report Takeaways
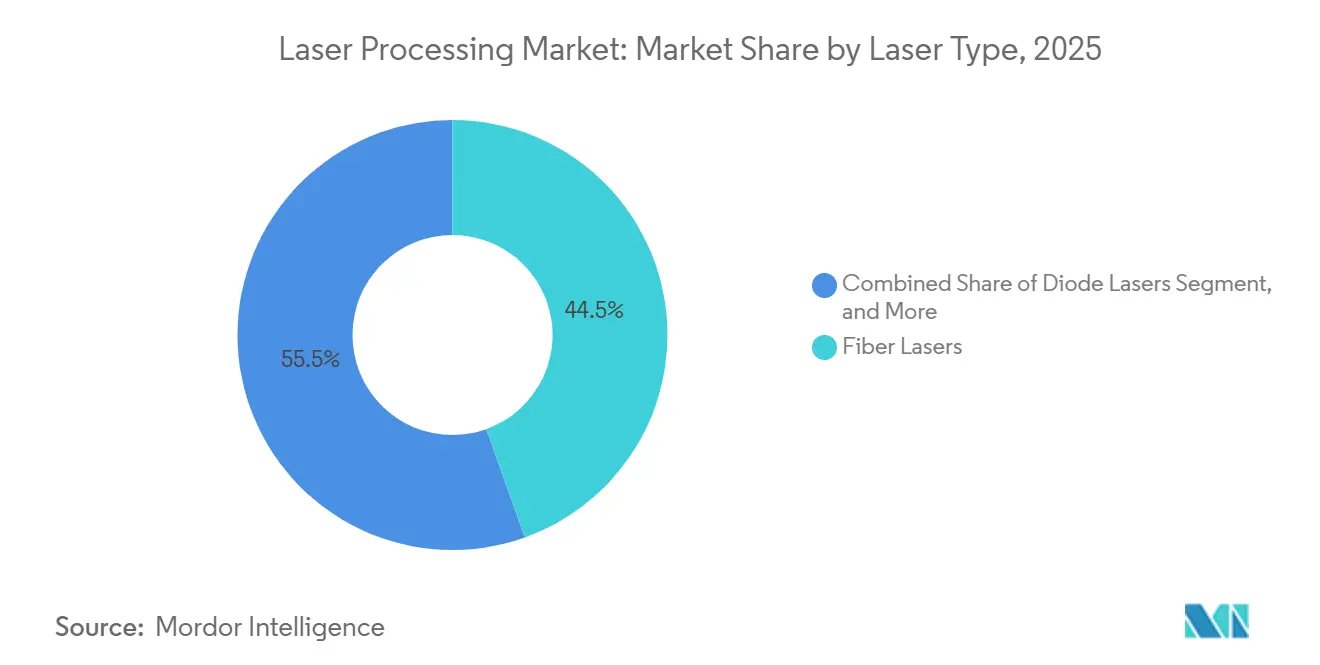
- By laser type, fiber systems commanded 44.52% of 2025 revenue, while ultrafast platforms are forecast to expand at a 9.64% CAGR through 2031.
- By process, cutting led with 39.76% revenue share in 2025; additive manufacturing is projected to grow at an 8.52% CAGR to 2031.
- By configuration, moving-beam machines held 48.76% of the 2025 laser processing market share; hybrid configurations are advancing at an 8.42% CAGR to 2031.
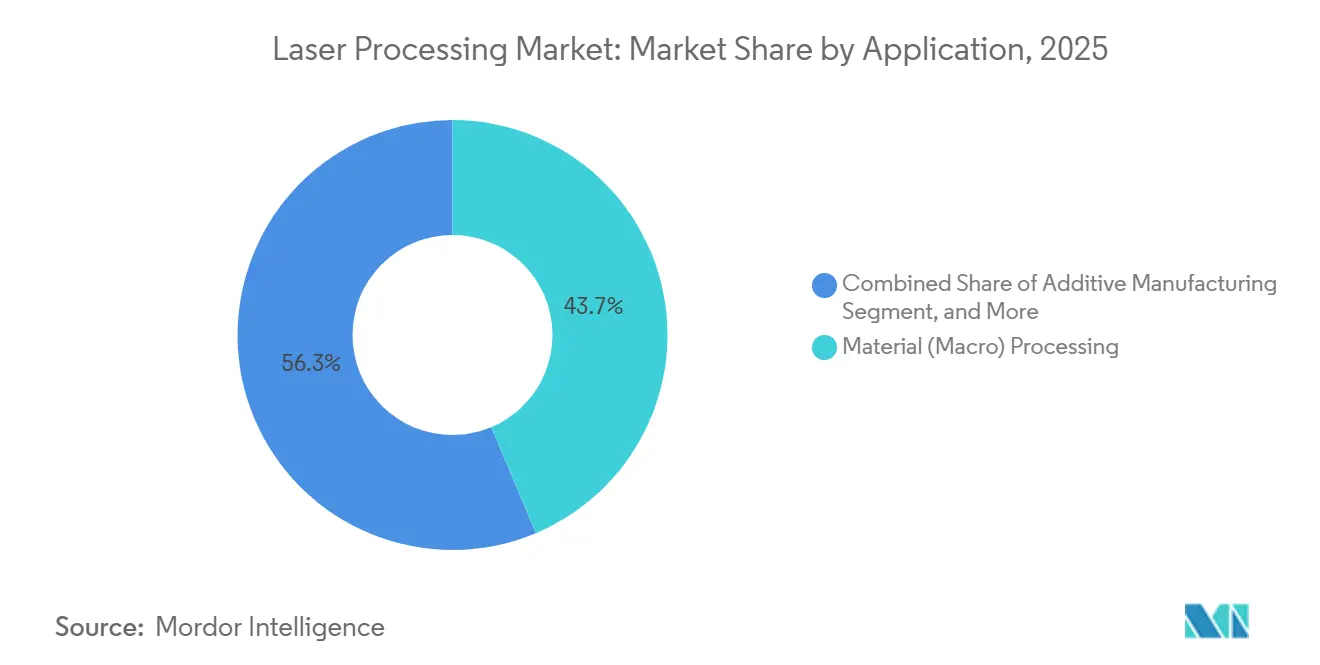
- By application, material processing accounted for 43.66% of the laser processing market size in 2025, whereas micro-machining shows the highest CAGR at 9.54% through 2031.
- By end-user, automotive generated 30.74% of 2025 revenue, yet electric-vehicle battery manufacturing posts the fastest 9.02% CAGR to 2031.
- By geography, Asia Pacific contributed 36.92% of 2025 revenue; the Middle East is the fastest-growing region at 8.78% to 2031.
Note: Market size and forecast figures in this report are generated using Mordor Intelligence’s proprietary estimation framework, updated with the latest available data and insights as of January 2026.
Market Trends and Insights
Drivers Impact Analysis of Laser Processing Market*
| Driver | ( ~ ) % Impact on CAGR Forecast | Geographic Relevance | Impact Timeline |
|---|---|---|---|
| Electrification-Driven EV Battery Welding Demand in Europe | +1.2% | Europe, spillover to North America and China | Medium term (2-4 years) |
| Government Incentives for Semiconductor Fab Lasers in East Asia | +0.9% | China, South Korea, Taiwan, Japan | Medium term (2-4 years) |
| Integration of Ultrafast Lasers for Minimally-Invasive Medical Devices in North America | +0.8% | North America, Western Europe | Long term (≥ 4 years) |
| High-Volume Solar Cell Laser Scribing Expansion in China | +1.1% | China, exports to India and Southeast Asia | Short term (≤ 2 years) |
| Industry 4.0 Retrofits Elevating Laser Cutting Adoption in German SMEs | +0.6% | Germany and wider EU manufacturing belt | Medium term (2-4 years) |
| Directed-Energy Defense R&D Programs Boosting High-Power Laser Supply in the United States | +0.5% | United States and allied contractors | Long term (≥ 4 years) |
| Source: Mordor Intelligence | |||
Electrification-Driven EV Battery Welding Demand in Europe
Gigafactory projects across Germany, France, and Hungary specify sub-100 micrometer copper-to-aluminum welds to cut resistive losses and mitigate thermal runaway risk. FANUC’s 2025 battery-welding scanner modulates beam oscillation in real time, enabling ±50 micrometer positional accuracy at production speeds. Fraunhofer ILT’s SoniLaser trials cut copper-busbar spatter 40%, addressing quality audits that hold eight-year warranty exposure. The material mix shift from steel seams to 200 meters of cell-interconnect welds per pack multiplies laser demand per vehicle. Automakers now specify ≥ 6 kilowatt fiber power for single-pass penetration, elevating lasers from cost-saver to reliability gatekeeper. Tier-one integrators respond with closed-loop cameras that flag voids within 10 milliseconds, preventing scrap in a field where one defective weld can immobilize an entire battery module.
Government Incentives for Semiconductor Fab Lasers in East Asia
Subsidy programs funnel into wafer-level laser tools for silicon carbide and gallium nitride, both critical to 5G and EV inverters. Taiwan’s 2025 pilot lines showed laser scribing cut SiC edge-chipping by 60% and unlocked thinner dies for better thermal paths.[1]Taiwan Ministry of Economic Affairs, “SiC Wafer Laser-Grinding Pilot,” moea.gov.tw China’s 14th Five-Year Plan ties tax holidays to local laser-equipment purchases, lifting Han’s Laser’s fab revenue 22% in 1H 2024. South Korea’s memory makers drill through-silicon vias with femtosecond pulses that avoid delamination, while Japan’s trade ministry underwrites laser-assisted bonding R&D. Shared across these programs is early capex reimbursement, shortening payback and lowering risk for fabs adding next-generation laser steps.
Integration of Ultrafast Lasers for Minimally-Invasive Medical Devices in North America
The FDA cleared multiple femtosecond systems in 2025, including ZEISS MEL 90, validating sub-200 fs corneal ablation with minimal collateral damage.[2]FDA, “510(k) Clearance ZEISS MEL 90,” fda.gov Coherent’s Monaco platform fragments cataracts below thermal relaxation thresholds, slashing recovery time. Peer-reviewed data show 30% fewer posterior capsule ruptures than manual techniques. Device makers now embed ultrafast modules into ENT probes and dermatology handpieces to differentiate on patient downtime. Hospitals accept higher capital cost because insurance coding already reimburses premium procedures. As outcome evidence mounts, ultrafast-laser adoption cascades into neurosurgery and otology, expanding addressable revenue for suppliers.
High-Volume Solar Cell Laser Expansion in China
China’s cell fabs, surpassing 400 GW annual capacity, use laser contact opening to boost PERC efficiency past 23%. Domestic toolmakers supply multi-head scribers that process 7,200 cells per hour at USD 20,000-30,000, undercutting foreign rivals by 40%. Perovskite-silicon tandem roadmaps require additional laser patterning stages, and Chinese institutes filed 50+ patents on perovskite scribing parameters in 2024. Each 0.5 percentage-point efficiency gain yields roughly USD 50 million extra module revenue on a 10 GW line, handily offsetting a USD 3 million laser cell. Price-performance improvements form a virtuous cycle in which wider adoption drives further cost erosion, making displacement by non-laser techniques unlikely.
Restraints Impact Analysis of Laser Processing Market*
| Restraint | (~) % Impact on CAGR Forecast | Geographic Relevance | Impact Timeline |
|---|---|---|---|
| Shortage of Skilled Photonics Workforce in the Nordics | -0.4% | Nordic countries, broader Western Europe | Medium term (2-4 years) |
| Helium Supply Volatility Raising CO₂ Laser Opex Globally | -0.6% | Global, acute in CO₂-reliant regions | Short term (≤ 2 years) |
| IP-Linked Import Restrictions on Laser Tools in India | -0.3% | India, ripple into South Asia | Long term (≥ 4 years) |
| EU-MDR Stringency Delaying Laser-Based Medical Device Launches | -0.5% | European Union, CE-mark-recognizing markets | Medium term (2-4 years) |
| Source: Mordor Intelligence | |||
Helium Supply Volatility Raising CO₂ Laser Opex Globally
CO₂ lasers depend on helium-neon mixtures; supply disruptions in Qatar and Russia pushed spot helium up by 50% in 2024, adding USD 2-4 per operating hour.[3]U.S. Government Accountability Office, “Helium Supply Disruptions,” gao.gov Many packaging and furniture shops run 24-hour shifts, so helium spikes quickly erode margins. Fiber lasers, needing no consumable gas and posting five-times better wall-plug efficiency, became a drop-in upgrade. IPG reported fiber share in metal cutting reaching 70-80% by 2024. Yet CO₂ retains superiority on thick acrylic and low-power engraving, so helium instability narrows rather than eliminates its niche.
EU-MDR Stringency Delaying Laser-Based Medical Device Launches
Stricter clinical evidence requirements extended average CE-mark timelines from 12-18 months pre-MDR to 24-36 months post-MDR. Notified-body bottlenecks raise cost for small laser startups lacking in-house regulatory teams. Divergence with U.S. 510(k) rules means parallel trials or staggered launches, compressing patent-protected sales years. Compliance with IEC 60825 laser safety and ISO 60601-2-22 electrical norms adds more testing steps but enhances patient safety. Net effect is slower European revenue recognition despite clear clinical demand, incentivizing some firms to prioritize North American rollouts first.
*Our forecasts treat driver/restraint impacts as directional, not additive. The impact forecasts reflect baseline growth, mix effects, and variable interactions.
Laser Processing Market Segment Analysis
By Laser Type:
Fiber Dominance Meets Ultrafast DisruptionFiber platforms captured 44.52% of 2025 revenue thanks to solid-state reliability and five-times higher electrical efficiency than legacy CO₂ sources. This share equates to the largest slice of the laser processing market size at the technology level. Ultrafast femtosecond and picosecond units, though smaller in absolute dollars, post a leading 9.64% CAGR to 2031, signaling future profit pools for vendors that master pulse-duration control. CO₂ lasers defended signage and acrylic niches, but helium price swings and comparatively lower wall-plug efficiency constrain new installations. YAG and disk lasers continue to service pulsed marking and spot-welding jobs, yet face substitution as fiber sources inherit pulse-shaping features. Excimer systems remain vital for deep-UV photolithography, but consumable costs limit wider industrial uptake.
TRUMPF’s TruFiber series integrates remote sensors that predictively flag water-chiller faults, minimizing downtime. Chinese challengers Raycus and Max Photonics ship kilowatt units at 40% lower price, leveraging 30,000-unit annual capacity to crowd the entry-level tier. Western incumbents therefore differentiate on beam-quality stability over 10,000 hours and integrated automation suites that raise switching costs for job-shop owners.


By Process Type:
Cutting Leads, Additive Manufacturing AcceleratesCutting absorbed 39.76% of 2025 demand, making it the largest contributor to the laser processing market. Fiber lasers slice stainless sheet at 40 meters per minute with minimal dross, displacing plasma torches that require secondary deburring. Welding holds the second spot, bolstered by EV battery lines that need precise copper-tab joins. Marking and engraving stay resilient because lasers offer permanent, chemical-free codes attractive to sustainability-minded brand owners.
Additive manufacturing shows an 8.52% CAGR, the fastest among processes, as dual-beam systems like IPG’s YLR-AMB build Ti-6Al-4V at 324 cm³ per hour with 99.9% density. Surface treatment expands through laser cladding on mining drills that extends life threefold, while micro-machining benefits from ultrafast pulses drilling 10 µm vias in smartphone stacked PCBs without heat-affected zones. Vendors increasingly bundle modular heads so one laser can transition from cutting to welding to cladding through quick optic swaps, safeguarding buyer investment as process mixes evolve.
By Configuration:
Moving Beam Flexibility DominatesMoving-beam systems account for 48.76% of 2025 revenue, reflecting their agility in two- and three-dimensional paths across varied part geometries. Fixed-beam machines thrive in solar cell scribing lines where the workpiece moves on conveyors, but lack job-shop flexibility. Hybrid configurations robot-mounted optics fed by stationary fiber sources grow at 8.42% through 2031 as automotive plants adopt remote welding to reduce fixture count.
AI nesting in moving-beam cutters boosts material utilization by 12% on high-value titanium sheets. Bystronic Rofin’s 2025 formation streamlines motion controller and laser-head integration, enabling real-time focus correction via vision feedback. End-users prize the ability to repurpose a robot-held laser for cladding or cleaning simply by swapping nozzles, an option that prolongs capital life and supports higher overall laser processing market adoption.
By Application:
Material Processing Leads, Micro-Machining SurgesMacro material processing contributed 43.66% of 2025 revenue, driven by automotive body cutting and shipyard hull welding. Micro-machining posts the highest 9.54% CAGR because electronics miniaturization demands vias under 30 µm drilled without thermal cracks. Laser cleaning and surface hardening win converts in heavy equipment to reduce chromium plating and induction furnace steps.
Additive builds move from prototyping to flight-qualified brackets; aerospace primes accept powdered titanium lattice parts after proving fatigue life matches forged parts. Medical and aesthetic procedures embrace picosecond systems that clear tattoos in half the sessions of nanosecond predecessors, supporting clinic ROI. Scientific labs, though small in dollars, push boundaries on attosecond pulse compression that eventually trickle into industrial uptime advances, reinforcing the ecosystem that underpins the broader laser processing industry.
By End-Use Industry:
Automotive Dominates, Batteries Drive GrowthAutomotive captured 30.74% of 2025 revenue, setting the baseline for the laser processing market share by vertical. E-motor hairpin welding and body-in-white steel-aluminum joins sustain volume, yet battery cell interconnects escalate demand per vehicle by 20-fold. Aerospace and defense pay premium margins for turbine-blade drilling and titanium stack cutting, a niche buffered from price wars.
Electronics deploy ultrafast lasers for through-silicon vias in 3D DRAM and OLED thin-film patterning. Medical-device OEMs leverage lasers for patient-specific orthopedic implants and minimally invasive surgical tools, although EU-MDR delays temper European launches. Solar manufacturers keep buying scribers to trim resistive losses in PERC and tandem cells. Packaging, jewelry, and job shops represent fragmented adoption, often entering the laser processing market through entry-level 1 kW cutters bundled with finance plans that offset helium price shocks linked to legacy CO₂ machines.
Geography Analysis
APAC Laser Processing Market
Asia Pacific remains the epicenter of the laser processing market, accounting for 36.92% of 2025 revenue. China alone operates 400 GW of solar-cell capacity and backs laser tool purchases with subsidies tied to domestic content mandates. Raycus expanded fiber-laser output to 30,000 units yearly, pushing local average selling prices down but lifting installed base. Japan’s precision-machinery sector sustains demand for ultrafast drills in smartphone camera modules, while South Korea’s memory fabs load femtosecond vias to protect wafer stacks from delamination.
MEA Laser Processing Market
The Middle East logs the fastest 8.78% CAGR, fueled by Saudi Arabia’s Alat initiative targeting USD 9.3 billion in non-oil GDP by 2030 and the UAE’s Operation 300bn campaign to triple industrial output. Government tenders specify local content, prompting European integrators to set up satellite workshops in Riyadh and Dubai. Funded aerospace composite plants and medical-device hubs require high-precision cutting and welding, positioning lasers as core tools.
North America Laser Processing Market
North America leverages defense R&D; the U.S. Department of Defense earmarked USD 789.7 million in 2025 for high-energy lasers, spurring a supply chain of pump diodes and beam combiners. The FDA’s favorable stance on ultrafast surgical devices accelerates medical demand. TRUMPF’s USD 40 million Connecticut smart factory built in 2025 underscores “local-for-local” strategies that cut lead times.
Europe, South America and Africa Laser Processing Market
Europe, led by Germany, remains an innovation hub where Mittelstand firms retrofit Industry 4.0 sensors onto existing laser cutters. Skills shortages documented at 45% in the United Kingdom risk slowing adoption, but universities expand apprenticeship pipelines to bridge gaps. South America and Africa show nascent uptake; Brazilian agrimachinery exporters install low-power fiber cutters to reduce outsourcing costs, while South Africa’s mining-equipment rebuilders trial laser cladding to extend drill-rod life.

Competitive Landscape
Top ten players controlled roughly 21% of 2025 revenue, signaling moderate fragmentation across the laser processing market. TRUMPF leads at about 6% share, bundling lasers, machine tools, and software into turnkey cells, yet price erosion from Chinese suppliers trims margins. IPG Photonics pivots from source sales toward integrated additive systems to defend against commoditization. Coherent, now the largest diode-pump chip producer, leverages upstream control to price mid-power fibers aggressively.
Bystronic’s USD 100 million acquisition of Coherent’s Materials Processing Tools division in October 2025 formed Bystronic Rofin, marrying cutting heads with integrated laser sources to simplify user interfaces. Han’s Laser serves over 40,000 industrial customers and grew overseas revenue 88% in 2024, proving Chinese brands can export beyond price-sensitive Asia. Raycus unveiled a 100 kW fiber laser and posts roughly 30% domestic share, demonstrating rapid capability convergence with Western incumbents.
Innovation hotspots include beam-shaping algorithms that adapt focal spot in real time, and hybrid ultrasonic-laser welding that halves copper spatter key in battery tabs. Vendors court job shops with cloud dashboards that predict consumable life, while aerospace primes demand process-monitoring cameras with millisecond feedback loops. Compliance with IEC 60825 and ISO 9001 remains mandatory for EU entry, favoring experienced providers. The race to embed AI assistants in machine HMIs suggests future differentiation will rely less on photons and more on data stewardship.
Laser Processing Industry Leaders
TRUMPF Group
Coherent Corp.
IPG Photonics Corporation
Lumentum Holdings Inc.
Jenoptik AG
- *Disclaimer: Major Players sorted in no particular order
Laser Processing Market Companies Covered in this Report
- TRUMPF Group
- IPG Photonics Corporation
- Coherent Corp.
- Han's Laser Technology Industry Group Co., Ltd.
- Bystronic Group
- Mitsubishi Electric Corporation
- Amada Co., Ltd.
- FANUC Corporation
- Jenoptik AG
- Lumentum Holdings Inc.
- NKT Photonics A/S
- Raycus Fiber Laser Technologies Co., Ltd.
- Laserline GmbH
- Prima Industrie S.p.A.
- Mazak Optonics Corporation
- Synrad Inc.
- MKS Instruments (ESI and Newport)
- GSI Group (AMETEK)
- Gravotech Marking
- Lasea S.A.
- Rofin-Sinar Technologies
- II-VI Advanced Photonics (now part of Coherent)
- SPI Lasers (TRUMPF Group)

Recent Industry Developments in Laser Processing Market
- January 2026: TRUMPF began serial delivery of its TruLaser Weld 5000 line fitted with TruFiber sources that cut energy consumption 20% and integrate BrightLine Scan for wider gap-bridging on aluminum.
- November 2025: TRUMPF launched second-generation TruFiber lasers spanning 500 W to 50 kW, adding modular sub-assemblies for field swaps and sensors for predictive maintenance.
- October 2025: Bystronic acquired Coherent’s Materials Processing Tools division, creating Bystronic Rofin and adding USD 100 million annual revenue plus 400 employees.
- October 2025: TRUMPF released updated TruLaser Weld 5000 with gesture-based TeachLine Touch programming to shorten setup on furniture and switch-cabinet jobs.


Laser Processing Market Report Scope and Research Methodology
Market Definition and Coverage
Our study defines the laser processing market as the sale of equipment and integrated systems that employ focused laser beams to cut, weld, drill, mark, engrave, surface-treat, or additively build metallic and non-metallic materials across manufacturing, electronics, medical-device, energy, and transportation sectors. These values are expressed in USD revenue generated from new machines and retrofit modules delivered through OEM and system integrator channels.
Scope Exclusions: Stand-alone photonic communication lasers, aesthetic beauty devices, and purely research laboratory sources are not counted.
Segments Covered in This Report
- By Laser Type
- CO2 Lasers
- Fiber Lasers
- Solid-State Lasers (Nd:YAG, Disk)
- Ultrafast (Femtosecond / Picosecond)
- Diode Lasers
- Excimer Lasers
- Other Laser Types
- By Process Type
- Cutting
- Welding (Including Hybrid, Remote)
- Marking and Engraving
- Drilling
- Surface Treatment / Hardening
- Micro-Machining
- Additive Manufacturing (DMLS, LMD)
- Other Processes Type
- By Configuration
- Fixed Beam
- Moving Beam
- Hybrid Beam
- By Application
- Material (Macro) Processing
- Micro-Machining
- Surface Treatment
- Additive Manufacturing
- Medical and Aesthetic Procedures
- Scientific Research and Photonic Communications
- Other Applications
- By End-Use Industry
- Automotive
- Electric-Vehicle Battery Manufacturing
- Aerospace and Defense
- Electronics and Semiconductor
- Medical Devices and Healthcare
- Energy and Solar Photovoltaic
- Industrial Machinery
- Packaging
- Jewelry and Luxury Goods
- Research Institutes and Universities
- Other End-User Industries
- By Geography
- North America
- United States
- Canada
- Mexico
- South America
- Brazil
- Argentina
- Rest of South America
- Europe
- Germany
- United Kingdom
- France
- Italy
- Spain
- Russia
- Rest of Europe
- Asia Pacific
- China
- Japan
- India
- South Korea
- Australia and New Zealand
- Rest of Asia Pacific
- Middle East
- Saudi Arabia
- United Arab Emirates
- Turkey
- Rest of Middle East
- Africa
- South Africa
- Nigeria
- Egypt
- Rest of Africa
- North America
Data Sources, Market Sizing, and Validation
Primary Research
Engineers at automotive body-in-white shops, semiconductor line managers, contract medical device manufacturers, and Asian job-shop owners share run-rate throughput, typical beam power, and average selling prices. These conversations help us sanity-check secondary ratios, fine-tune regional penetration rates, and sense near-term order pipelines that might not yet appear in public filings.
Desk Research
Mordor analysts begin with production, trade, and usage indicators from open datasets such as UN Comtrade shipment codes for machine tools, OECD industrial production indices, OICA vehicle output, and the Laser Institute of America's safety bulletin counts. Supplemental context comes from company 10-Ks, patent families mapped through Questel, and news archives on Dow Jones Factiva that flag capacity additions or line conversions. We also reference D&B Hoovers for revenue splits of leading system builders and Marklines when the equipment is destined for automotive stamping plants. This list is illustrative rather than exhaustive; many additional sources inform validation.
Market-Sizing & Forecasting
A top-down construct translates industrial production dollars into potential laser system demand using penetration multipliers by vertical, which are then corroborated through bottom-up spot checks of supplier shipments and sampled ASP × volume math. Variables that sway the model include average sheet-metal thickness processed, fiber-laser cost erosion per watt, EV battery welding station uptake, factory automation investment cycles, export share of capital goods, and regional labor cost differentials. A multivariate regression with lagged macro indicators and ASP learning curves projects revenue through 2030, while scenario analysis gauges upside from additive manufacturing acceleration. Gaps in bottom-up evidence are bridged with regional analogs adjusted for wage and energy cost variance.
Data Validation & Update Cycle
Modeled outputs pass variance checks against historical import bills and quarterly earnings. Senior reviewers challenge any swing greater than three percentage points, and fresh desk plus call-backs are triggered if anomalies persist. Reports refresh yearly, with mid-cycle edits for material events, ensuring clients receive the most current baseline.
How Mordor Intelligence's Laser Processing Market Size Compares to Other Published Estimates
Published estimates diverge because firms pick different boundaries, currencies, and refresh cadences, and because laser sources, systems, and services often blur in public disclosures.
Key gap drivers include whether sources bundle laser diodes and photonics modules, how aggressively they roll forward ASP deflation, and if refurbishments are double-counted. Mordor chooses a machine-only scope, ties ASP trends to verified purchase orders, and revisits every assumption each year.
Benchmark comparison
| Market Size | Anonymized source | Primary gap driver |
|---|---|---|
| USD 8.17 B (2025) | Mordor Intelligence | |
| USD 7.17 B (2025) | Global Consultancy A | Excludes additive manufacturing tools and several emerging economies |
| USD 23.70 B (2024) | Trade Journal B | Adds laser sources and service contracts, uses list prices without regional weighting |
These comparisons show that figures swing widely when scope widens or unchecked price lists inflate revenue. By anchoring definitions tightly, validating with field data, and revisiting variables annually, Mordor Intelligence delivers a balanced baseline clients can rely on.


Key Questions Answered in the Report
What is the current global value of the laser processing market?
The laser processing market size stands at USD 8.82 billion in 2026.
How fast is the laser processing market expected to grow?
It is forecast to expand at a 7.79% CAGR, reaching USD 12.83 billion by 2031.
Which laser type leads the market and which grows the fastest?
Fiber lasers lead with 44.52% of 2025 revenue share, while ultrafast lasers post the highest 9.64% CAGR.
Which region is projected to grow the quickest?
The Middle East leads regional growth with an 8.78% CAGR through 2031, backed by Saudi and UAE industrial programs.
Why is additive manufacturing important for laser suppliers?
Additive processes show an 8.52% CAGR, driven by aerospace and medical qualification of high-density metal parts.
How fragmented is vendor competition?
The top 10 suppliers hold about 21% of revenue, giving the market a moderate concentration score of 5.
Page last updated on:


