Pigeon Pea Market Size and Share
Pigeon Pea Market Analysis by Mordor Intelligence
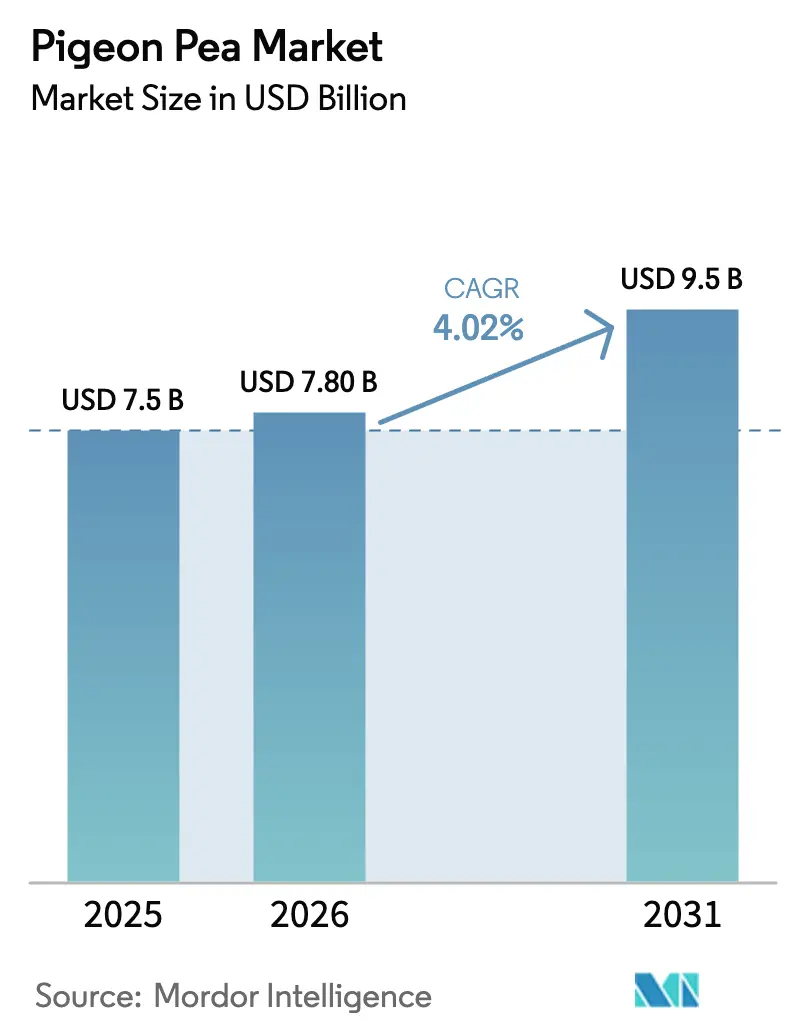
The pigeon pea market size is projected to expand from USD 7.5 billion in 2025 and USD 7.8 billion in 2026 to USD 9.5 billion by 2031, registering a CAGR of 4.02% between 2026 and 2031. Structural shifts toward plant-based eating, policy-backed price floors in India, and expanding East African acreage are the principal growth engines. India remains the dominant grower and importer, yet Tanzania, Mozambique, and Kenya are gaining export momentum as African production rises with a higher growth rate annually, outpacing Asia’s growth. Digital spot-auction platforms such as Tanzania’s HortiMarket shorten the price-discovery cycle and raise farm-gate prices, while protein-isolate investments in Malaysia and Canada diversify demand beyond traditional dal milling. Freight surcharges on East Africa–to-India lanes and slow adoption of gene-edited cultivars temper the overall growth outlook.
Key Report Takeaways
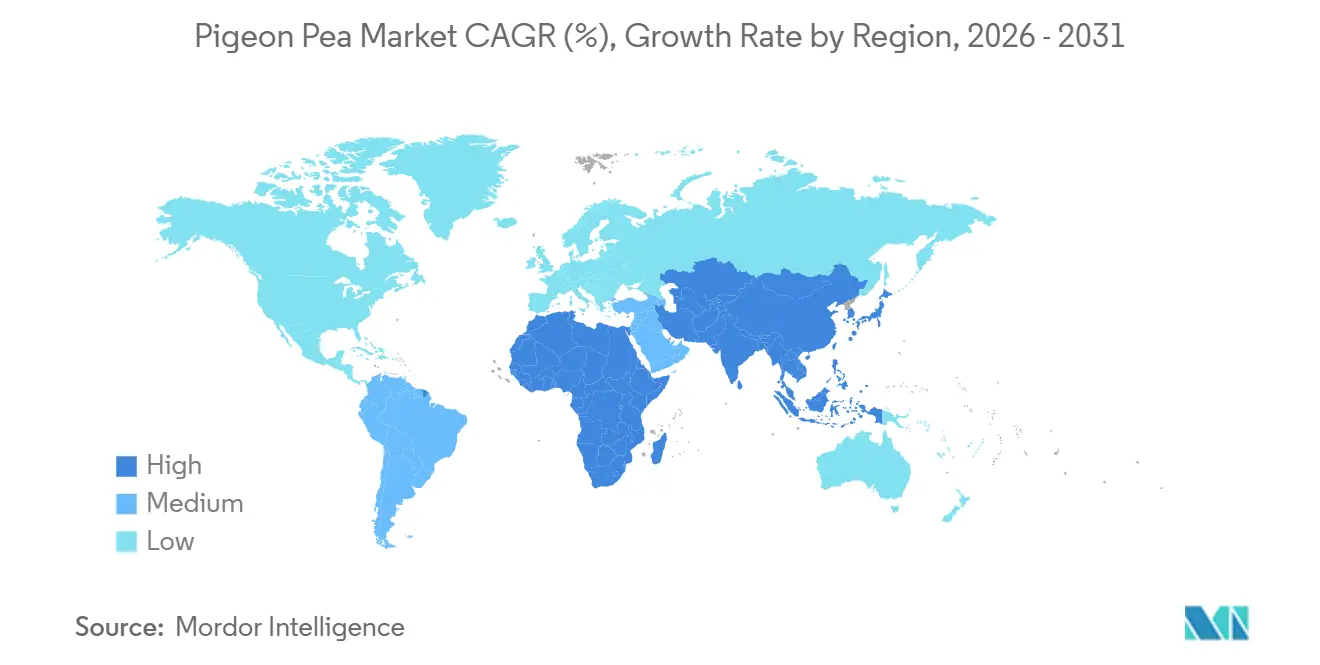
- By geography, Asia-Pacific held 48.5% of the pigeon pea market share in 2025, while Africa is advancing at a 6.8% CAGR through 2031.
Note: Market size and forecast figures in this report are generated using Mordor Intelligence’s proprietary estimation framework, updated with the latest available data and insights as of January 2026.
Global Pigeon Pea Market Trends and Insights
Drivers Impact Analysis*
| Driver | (~) % Impact on CAGR Forecast | Geographic Relevance | Impact Timeline |
|---|---|---|---|
| Rising demand for plant-based proteins | +1.2% | Global, with concentration in North America, Europe, and urban Asia-Pacific | Medium term (2-4 years) |
| Government pulse-crop support programs | +0.9% | Asia-Pacific (India dominant), Africa (Kenya, Tanzania, Malawi), and select South American markets | Short term (≤ 2 years) |
| Climate-resilient drought tolerance advantage | +0.7% | Africa (Kenya, Tanzania, Mozambique, Sudan), semi-arid Asia (India, Myanmar),and parts of South America | Long term (≥ 4 years) |
| Digital spot-auction platforms boosting farm-gate liquidity | +0.4% | Africa (Tanzania, Kenya, Malawi), South Asia (India rural belts), and emerging in South America | Medium term (2-4 years) |
| Carbon-credit premiums for regenerative pigeon-pea rotations | +0.3% | Global, early adoption in North America, Europe, Australia, and pilot projects in Africa and South America | Long term (≥ 4 years) |
| South–South pulse-based school-meal initiatives | +0.5% | Africa (Kenya, Tanzania, Malawi, Ethiopia), South Asia (India, Bangladesh), and parts of South America | Medium term (2-4 years) |
| Source: Mordor Intelligence | |||
Rising Demand for Plant-Based Proteins
Food manufacturers worldwide now view pigeon pea protein as a viable complement to pea and chickpea ingredients. The pulse ingredient market is experiencing steady growth, driven by dairy-alternative and meat-analogue applications. Agrocorp International is completing a protein-isolate facility in Malaysia to process pigeon pea, signalling year-round industrial offtake. Nutritionally, pigeon pea provides 6.8 grams of lysine per 100 grams, compared with 5.2 grams in yellow peas, positioning it for use in fortified foods aimed at protein-deficient consumers [1]Market Overview Source: Food and Agriculture Organization, “FAOSTAT Crops Data,” FAO.org . Year-round demand from isolated and concentrated plants decouples consumption from monsoon-linked dal cycles, smoothing price seasonality.
Government Pulse-Crop Support Programs
India raised the 2025-26 minimum support price for tur to INR 80,000 per metric ton (USD 960), guaranteeing 100% procurement through 2028-29 under the expanded Price Support Scheme [2]Source: Indian Ministry of Agriculture, “Price Support Scheme Notification,” Agriculture.gov.in . The six-year National Pulses Mission commits INR 60,000 crore (USD 7.2 billion) to achieve self-sufficiency by 2029, assuring farmers a 59% margin over production cost. These policy floors stabilize global prices because India accounts for a significant share of global output. Duty exemptions during shortfalls spur Tanzanian and Mozambican exports, indirectly supporting African smallholders.
Climate-Resilient Drought Tolerance Advantage
Pigeon pea thrives with 600 to 1,000 millimeters of annual rainfall because its roots extend two to three meters, accessing deep moisture. Area under the crop is expanding in Kenya’s Eastern Province, Tanzania’s Dodoma region, and India’s Vidarbha belt, where erratic monsoons undermine chickpea viability. Still, flowering-stage droughts can cut pod set by up to 40%, as seen in Maharashtra and Karnataka during the 2024 and 2025 kharif seasons. Regulatory delays for Clustered Regularly Interspaced Short Palindromic Repeats (CRISPR)-edited, drought-tolerant lines are delaying yield gains that could lift the pigeon pea market's growth rate.
Digital Spot-Auction Platforms Boosting Farm-Gate Liquidity
Tanzania’s HortiMarket connects 12,000 growers to 340 buyers via Short Message Service (SMS) and Unstructured Supplementary Service Data (USSD), shortening payment cycles from 21 days to seven and raising farm-gate prices 8 to 12%. India’s electronic National Agriculture Market links 1,000 mandis, reducing price dispersion across states, though liquidity centers on Maharashtra and Karnataka. In Kenya, limited network coverage forces farmers to travel long distances to access platforms, constraining scale-up [3]Source: Kenya National Bureau of Statistics, “National Agriculture Production Report 2024,” KNBS.or.ke. Warehouse receipt systems in Malawi provide collateralized storage, but uptake is slowed by disputes over quality grading.
Restraints Impact Analysis*
| Restraint | (~) % Impact on CAGR Forecast | Geographic Relevance | Impact Timeline |
|---|---|---|---|
| Volatile rainfall patterns in key belts | -0.8% | Africa (Kenya, Tanzania, Mozambique, Sudan), Asia-Pacific (India, Myanmar), and parts of South America | Short term (≤ 2 years) |
| Price suppression from substitute pulses | -0.5% | Global, with acute impact in Asia-Pacific (India, Bangladesh) and Africa (Kenya, Tanzania) | Medium term (2-4 years) |
| Container-shortage surcharges on East-Africa outbound lanes | -0.3% | Africa (Tanzania, Mozambique, Kenya) to Asia-Pacific (India, China) trade corridors | Short term (≤ 2 years) |
| Delayed gene-edited varietal approvals | -0.2% | Global, with regulatory bottlenecks in Asia-Pacific (India), Africa (Kenya, Tanzania), and South America | Long term (≥ 4 years) |
| Source: Mordor Intelligence | |||
Volatile Rainfall Patterns in Key Belts
Delayed monsoon onset in Maharashtra and Karnataka during the 2024 season cut India’s tur harvest by roughly 200,000 metric tons. Kenya’s Makueni and Kitui counties saw 30 to 40% yield declines in 2025 when long-rains faltered. Tanzania’s Dodoma region experienced similar stress, delaying planting by up to three weeks. Climate models from the Intergovernmental Panel on Climate Change project a 15 to 20% rise in short-cycle droughts across semi-arid tropics by 2030.
Price Suppression from Substitute Pulses
Canadian lentil and pea output rebounded in 2024, pushing export prices down 12 to 15% and encouraging Indian millers to blend cheaper lentils into dal mixes. When India extended duty exemptions on lentil and pigeon pea imports, Customer Information File (CIF) pigeon pea prices were capped at USD 1,050 to 1,100 per metric ton, trimming trader margins. The Global Pulse Confederation recorded pigeon pea price volatility at 18 to 22% compared with 12 to 15% for chickpeas, reflecting thinner liquidity. Persistent oversupply in substitute crops can dampen pigeon pea market growth.
*Our forecasts treat driver/restraint impacts as directional, not additive. The impact forecasts reflect baseline growth, mix effects, and variable interactions.
Geography Analysis
Asia-Pacific held 48.5% of the pigeon pea market share in 2025, with India anchoring both production and consumption, balancing its roles as the top grower and leading importer. Africa is the fastest-growing region with 6.80% CAGR through 2031 as smallholders in Tanzania, Kenya, and Mozambique scale acreage in response to sustained Indian demand. Robust policy support, port upgrades, and school-meal initiatives propel Africa’s rise, while China’s steady import gains add incremental pull within Asia. Together, these two regions shape price discovery and set the tempo for global trade flows.
North and South America remain peripheral, focusing on lentils and peas and planting limited pigeon pea acreage to serve ethnic food niches in the United States, Canada, Brazil, and Argentina. Europe depends on imports, with the United Kingdom driving demand due to the increasing adoption of plant-based diets. Meanwhile, the Middle East imports from India and East Africa to meet the needs of South Asian communities. Myanmar supplies a sizable share of India’s import needs, though logistical bottlenecks and political instability cap faster growth. Australia stays marginal, focusing on chickpeas and lentils and acting mainly as a re-export hub for Southeast Asian buyers.
Looking ahead, African exporters are diversifying toward China and Gulf markets to hedge against potential Indian self-sufficiency, while digital trading platforms and traceability tools are anticipated to raise farm-gate prices and stimulate further acreage expansion. Asian buyers are investing in protein-isolate facilities that create year-round demand, encouraging steady offtake even when dal milling slows. Logistics standardization and continued port upgrades should trim freight costs, enhancing the competitiveness of East African shippers. These dynamics indicate that regional interactions, rather than a single market, will influence the next phase of growth in the pigeon pea market.


Competitive Landscape
The global pigeon pea commodity market is moderately fragmented, with the top five companies includes ETG Commodities, Olam International, Agrocorp International, Phoenix Commodities, and Viterra, holding a significant share of trade volumes. This provides opportunities for regional cooperatives, mid-tier exporters, and farmer-owned aggregators to target niche markets. ETG Commodities, based in Tanzania, leverages its extensive network in East Africa to supply pulses globally while adhering to food safety standards and supporting smallholders. Olam International focuses on sustainable sourcing through its origination hubs in Africa and Asia, utilizing traceability platforms to meet regulatory requirements. Agrocorp International is expanding into value-added processing, with investments in protein isolate and concentrate manufacturing facilities, signaling a strategic shift from bulk trading to value-added production.
Competition in the market is increasing, particularly in digital spot-auction platforms and traceability systems aimed at reducing information asymmetry and transaction costs. Tanzania's HortiMarket platform, introduced in October 2025, connects a significant number of smallholder pigeon pea farmers with hundreds of registered buyers through SMS and USSD. This platform has effectively decreased the farm-gate-to-wholesale price spread, enhancing liquidity during peak harvest periods. While blockchain technology remains in its early stages within commodity markets, it holds potential for improving transparency and minimizing counterparty risk. However, high implementation costs and scalability challenges have restricted its adoption to pilot projects in countries such as Kenya and India.
Opportunities exist in protein extraction and fractionation, where pigeon pea's higher lysine content makes it a valuable input for fortified products aimed at addressing protein deficiencies in Africa and South Asia. However, commercial-scale extraction facilities remain limited globally. Smaller companies, such as Shakambri Group have established niches by supplying government procurement bodies and maintaining sourcing partnerships with cooperatives in multiple countries.
Recent Industry Developments
- February 2026: The International Crops Research Institute for the Semi-Arid Tropics, backed by the Food and Agriculture Organization, began scaling farmer-led pigeon pea seed enterprises across Mozambique to raise smallholder incomes and strengthen the country’s position in regional and international pulse markets.
- October 2025: India scheduled the launch of the Self-Reliance in Pulses Mission and the PM Dhan-Dhaanya Krishi Yojana, targeting an expansion of pulse area to 31 million hectares by 2030-31, distribution of 1.26 metric tons of certified seed, and establishment of 1,000 pulse-processing units with INR 25 lakh (USD 300,000) subsidies each.
- October 2025: The Tanzanian government is working to establish a more stable and structured trade framework with India to protect farmers from market fluctuations. The Cereals and Other Produce Regulatory Authority (COPRA) recently led an official delegation to India for government-to-government discussions focused on securing a direct export agreement.


Global Pigeon Pea Market Report Scope
The Pigeon Pea Market Report is Segmented by Geography (North America, Europe, Asia Pacific, and More). The Report Includes Production Analysis (Volume), Consumption Analysis (Value and Volume), Import Analysis (Value and Volume), Export Analysis (Value and Volume), Wholesale Price Trend Analysis and Forecast, List of Key Players, Regulatory Framework, Logistics and Infrastructure, and Seasonality Analysis. The Market Forecasts are Provided in Terms of Value (USD) and Volume (Metric Tons).
| North America | United States | Production Analysis (Area Harvested, Yield, and Production Volume) |
| Consumption Analysis (Consumption Value and Volume) | ||
| Import Market Analysis (Import Value, Volume, and Key Supplying Markets) | ||
| Export Market Analysis (Export Value, Volume, and Key Destination Markets) | ||
| Wholesale Price Trend Analysis and Forecast | ||
| Regulatory Framework | ||
| List of Key Players | ||
| Logistics and Infrastructure | ||
| Seasonality Analysis | ||
| Canada | Production Analysis (Area Harvested, Yield, and Production Volume) | |
| Consumption Analysis (Consumption Value and Volume) | ||
| Import Market Analysis (Import Value, Volume, and Key Supplying Markets) | ||
| Export Market Analysis (Export Value, Volume, and Key Destination Markets) | ||
| Wholesale Price Trend Analysis and Forecast | ||
| Regulatory Framework | ||
| List of Key Players | ||
| Logistics and Infrastructure | ||
| Seasonality Analysis | ||
| Mexico | Production Analysis (Area Harvested, Yield, and Production Volume) | |
| Consumption Analysis (Consumption Value and Volume) | ||
| Import Market Analysis (Import Value, Volume, and Key Supplying Markets) | ||
| Export Market Analysis (Export Value, Volume, and Key Destination Markets) | ||
| Wholesale Price Trend Analysis and Forecast | ||
| Regulatory Framework | ||
| List of Key Players | ||
| Logistics and Infrastructure | ||
| Seasonality Analysis | ||
| South America | Brazil | Production Analysis (Area Harvested, Yield, and Production Volume) |
| Consumption Analysis (Consumption Value and Volume) | ||
| Import Market Analysis (Import Value, Volume, and Key Supplying Markets) | ||
| Export Market Analysis (Export Value, Volume, and Key Destination Markets) | ||
| Wholesale Price Trend Analysis and Forecast | ||
| Regulatory Framework | ||
| List of Key Players | ||
| Logistics and Infrastructure | ||
| Seasonality Analysis | ||
| Argentina | Production Analysis (Area Harvested, Yield, and Production Volume) | |
| Consumption Analysis (Consumption Value and Volume) | ||
| Import Market Analysis (Import Value, Volume, and Key Supplying Markets) | ||
| Export Market Analysis (Export Value, Volume, and Key Destination Markets) | ||
| Wholesale Price Trend Analysis and Forecast | ||
| Regulatory Framework | ||
| List of Key Players | ||
| Logistics and Infrastructure | ||
| Seasonality Analysis | ||
| Europe | Russia | Production Analysis (Area Harvested, Yield, and Production Volume) |
| Consumption Analysis (Consumption Value and Volume) | ||
| Import Market Analysis (Import Value, Volume, and Key Supplying Markets) | ||
| Export Market Analysis (Export Value, Volume, and Key Destination Markets) | ||
| Wholesale Price Trend Analysis and Forecast | ||
| Regulatory Framework | ||
| List of Key Players | ||
| Logistics and Infrastructure | ||
| Seasonality Analysis | ||
| United Kingdom | Production Analysis (Area Harvested, Yield, and Production Volume) | |
| Consumption Analysis (Consumption Value and Volume) | ||
| Import Market Analysis (Import Value, Volume, and Key Supplying Markets) | ||
| Export Market Analysis (Export Value, Volume, and Key Destination Markets) | ||
| Wholesale Price Trend Analysis and Forecast | ||
| Regulatory Framework | ||
| List of Key Players | ||
| Logistics and Infrastructure | ||
| Seasonality Analysis | ||
| Asia-Pacific | India | Production Analysis (Area Harvested, Yield, and Production Volume) |
| Consumption Analysis (Consumption Value and Volume) | ||
| Import Market Analysis (Import Value, Volume, and Key Supplying Markets) | ||
| Export Market Analysis (Export Value, Volume, and Key Destination Markets) | ||
| Wholesale Price Trend Analysis and Forecast | ||
| Regulatory Framework | ||
| List of Key Players | ||
| Logistics and Infrastructure | ||
| Seasonality Analysis | ||
| China | Production Analysis (Area Harvested, Yield, and Production Volume) | |
| Consumption Analysis (Consumption Value and Volume) | ||
| Import Market Analysis (Import Value, Volume, and Key Supplying Markets) | ||
| Export Market Analysis (Export Value, Volume, and Key Destination Markets) | ||
| Wholesale Price Trend Analysis and Forecast | ||
| Regulatory Framework | ||
| List of Key Players | ||
| Logistics and Infrastructure | ||
| Seasonality Analysis | ||
| Australia | Production Analysis (Area Harvested, Yield, and Production Volume) | |
| Consumption Analysis (Consumption Value and Volume) | ||
| Import Market Analysis (Import Value, Volume, and Key Supplying Markets) | ||
| Export Market Analysis (Export Value, Volume, and Key Destination Markets) | ||
| Wholesale Price Trend Analysis and Forecast | ||
| Regulatory Framework | ||
| List of Key Players | ||
| Logistics and Infrastructure | ||
| Seasonality Analysis | ||
| Middle East | Saudi Arabia | Production Analysis (Area Harvested, Yield, and Production Volume) |
| Consumption Analysis (Consumption Value and Volume) | ||
| Import Market Analysis (Import Value, Volume, and Key Supplying Markets) | ||
| Export Market Analysis (Export Value, Volume, and Key Destination Markets) | ||
| Wholesale Price Trend Analysis and Forecast | ||
| Regulatory Framework | ||
| List of Key Players | ||
| Logistics and Infrastructure | ||
| Seasonality Analysis | ||
| United Arab Emirates | Production Analysis (Area Harvested, Yield, and Production Volume) | |
| Consumption Analysis (Consumption Value and Volume) | ||
| Import Market Analysis (Import Value, Volume, and Key Supplying Markets) | ||
| Export Market Analysis (Export Value, Volume, and Key Destination Markets) | ||
| Wholesale Price Trend Analysis and Forecast | ||
| Regulatory Framework | ||
| List of Key Players | ||
| Logistics and Infrastructure | ||
| Seasonality Analysis | ||
| Africa | Kenya | Production Analysis (Area Harvested, Yield, and Production Volume) |
| Consumption Analysis (Consumption Value and Volume) | ||
| Import Market Analysis (Import Value, Volume, and Key Supplying Markets) | ||
| Export Market Analysis (Export Value, Volume, and Key Destination Markets) | ||
| Wholesale Price Trend Analysis and Forecast | ||
| Regulatory Framework | ||
| List of Key Players | ||
| Logistics and Infrastructure | ||
| Seasonality Analysis | ||
| Tanzania | Production Analysis (Area Harvested, Yield, and Production Volume) | |
| Consumption Analysis (Consumption Value and Volume) | ||
| Import Market Analysis (Import Value, Volume, and Key Supplying Markets) | ||
| Export Market Analysis (Export Value, Volume, and Key Destination Markets) | ||
| Wholesale Price Trend Analysis and Forecast | ||
| Regulatory Framework | ||
| List of Key Players | ||
| Logistics and Infrastructure | ||
| Seasonality Analysis | ||
| By Geography | North America | United States | Production Analysis (Area Harvested, Yield, and Production Volume) |
| Consumption Analysis (Consumption Value and Volume) | |||
| Import Market Analysis (Import Value, Volume, and Key Supplying Markets) | |||
| Export Market Analysis (Export Value, Volume, and Key Destination Markets) | |||
| Wholesale Price Trend Analysis and Forecast | |||
| Regulatory Framework | |||
| List of Key Players | |||
| Logistics and Infrastructure | |||
| Seasonality Analysis | |||
| Canada | Production Analysis (Area Harvested, Yield, and Production Volume) | ||
| Consumption Analysis (Consumption Value and Volume) | |||
| Import Market Analysis (Import Value, Volume, and Key Supplying Markets) | |||
| Export Market Analysis (Export Value, Volume, and Key Destination Markets) | |||
| Wholesale Price Trend Analysis and Forecast | |||
| Regulatory Framework | |||
| List of Key Players | |||
| Logistics and Infrastructure | |||
| Seasonality Analysis | |||
| Mexico | Production Analysis (Area Harvested, Yield, and Production Volume) | ||
| Consumption Analysis (Consumption Value and Volume) | |||
| Import Market Analysis (Import Value, Volume, and Key Supplying Markets) | |||
| Export Market Analysis (Export Value, Volume, and Key Destination Markets) | |||
| Wholesale Price Trend Analysis and Forecast | |||
| Regulatory Framework | |||
| List of Key Players | |||
| Logistics and Infrastructure | |||
| Seasonality Analysis | |||
| South America | Brazil | Production Analysis (Area Harvested, Yield, and Production Volume) | |
| Consumption Analysis (Consumption Value and Volume) | |||
| Import Market Analysis (Import Value, Volume, and Key Supplying Markets) | |||
| Export Market Analysis (Export Value, Volume, and Key Destination Markets) | |||
| Wholesale Price Trend Analysis and Forecast | |||
| Regulatory Framework | |||
| List of Key Players | |||
| Logistics and Infrastructure | |||
| Seasonality Analysis | |||
| Argentina | Production Analysis (Area Harvested, Yield, and Production Volume) | ||
| Consumption Analysis (Consumption Value and Volume) | |||
| Import Market Analysis (Import Value, Volume, and Key Supplying Markets) | |||
| Export Market Analysis (Export Value, Volume, and Key Destination Markets) | |||
| Wholesale Price Trend Analysis and Forecast | |||
| Regulatory Framework | |||
| List of Key Players | |||
| Logistics and Infrastructure | |||
| Seasonality Analysis | |||
| Europe | Russia | Production Analysis (Area Harvested, Yield, and Production Volume) | |
| Consumption Analysis (Consumption Value and Volume) | |||
| Import Market Analysis (Import Value, Volume, and Key Supplying Markets) | |||
| Export Market Analysis (Export Value, Volume, and Key Destination Markets) | |||
| Wholesale Price Trend Analysis and Forecast | |||
| Regulatory Framework | |||
| List of Key Players | |||
| Logistics and Infrastructure | |||
| Seasonality Analysis | |||
| United Kingdom | Production Analysis (Area Harvested, Yield, and Production Volume) | ||
| Consumption Analysis (Consumption Value and Volume) | |||
| Import Market Analysis (Import Value, Volume, and Key Supplying Markets) | |||
| Export Market Analysis (Export Value, Volume, and Key Destination Markets) | |||
| Wholesale Price Trend Analysis and Forecast | |||
| Regulatory Framework | |||
| List of Key Players | |||
| Logistics and Infrastructure | |||
| Seasonality Analysis | |||
| Asia-Pacific | India | Production Analysis (Area Harvested, Yield, and Production Volume) | |
| Consumption Analysis (Consumption Value and Volume) | |||
| Import Market Analysis (Import Value, Volume, and Key Supplying Markets) | |||
| Export Market Analysis (Export Value, Volume, and Key Destination Markets) | |||
| Wholesale Price Trend Analysis and Forecast | |||
| Regulatory Framework | |||
| List of Key Players | |||
| Logistics and Infrastructure | |||
| Seasonality Analysis | |||
| China | Production Analysis (Area Harvested, Yield, and Production Volume) | ||
| Consumption Analysis (Consumption Value and Volume) | |||
| Import Market Analysis (Import Value, Volume, and Key Supplying Markets) | |||
| Export Market Analysis (Export Value, Volume, and Key Destination Markets) | |||
| Wholesale Price Trend Analysis and Forecast | |||
| Regulatory Framework | |||
| List of Key Players | |||
| Logistics and Infrastructure | |||
| Seasonality Analysis | |||
| Australia | Production Analysis (Area Harvested, Yield, and Production Volume) | ||
| Consumption Analysis (Consumption Value and Volume) | |||
| Import Market Analysis (Import Value, Volume, and Key Supplying Markets) | |||
| Export Market Analysis (Export Value, Volume, and Key Destination Markets) | |||
| Wholesale Price Trend Analysis and Forecast | |||
| Regulatory Framework | |||
| List of Key Players | |||
| Logistics and Infrastructure | |||
| Seasonality Analysis | |||
| Middle East | Saudi Arabia | Production Analysis (Area Harvested, Yield, and Production Volume) | |
| Consumption Analysis (Consumption Value and Volume) | |||
| Import Market Analysis (Import Value, Volume, and Key Supplying Markets) | |||
| Export Market Analysis (Export Value, Volume, and Key Destination Markets) | |||
| Wholesale Price Trend Analysis and Forecast | |||
| Regulatory Framework | |||
| List of Key Players | |||
| Logistics and Infrastructure | |||
| Seasonality Analysis | |||
| United Arab Emirates | Production Analysis (Area Harvested, Yield, and Production Volume) | ||
| Consumption Analysis (Consumption Value and Volume) | |||
| Import Market Analysis (Import Value, Volume, and Key Supplying Markets) | |||
| Export Market Analysis (Export Value, Volume, and Key Destination Markets) | |||
| Wholesale Price Trend Analysis and Forecast | |||
| Regulatory Framework | |||
| List of Key Players | |||
| Logistics and Infrastructure | |||
| Seasonality Analysis | |||
| Africa | Kenya | Production Analysis (Area Harvested, Yield, and Production Volume) | |
| Consumption Analysis (Consumption Value and Volume) | |||
| Import Market Analysis (Import Value, Volume, and Key Supplying Markets) | |||
| Export Market Analysis (Export Value, Volume, and Key Destination Markets) | |||
| Wholesale Price Trend Analysis and Forecast | |||
| Regulatory Framework | |||
| List of Key Players | |||
| Logistics and Infrastructure | |||
| Seasonality Analysis | |||
| Tanzania | Production Analysis (Area Harvested, Yield, and Production Volume) | ||
| Consumption Analysis (Consumption Value and Volume) | |||
| Import Market Analysis (Import Value, Volume, and Key Supplying Markets) | |||
| Export Market Analysis (Export Value, Volume, and Key Destination Markets) | |||
| Wholesale Price Trend Analysis and Forecast | |||
| Regulatory Framework | |||
| List of Key Players | |||
| Logistics and Infrastructure | |||
| Seasonality Analysis | |||


Key Questions Answered in the Report
How large will the pigeon pea market be by 2031?
It is forecast to reach USD 9.5 billion by 2031, growing at a 4.02% CAGR from 2026.
Why are East African exports gaining ground?
Supportive policies, upgraded ports, and sustained Indian demand enable Tanzania, Mozambique, and Kenya to lift export volumes significantly..
What factors could slow market growth?
Increasing freight costs, rainfall volatility, cheaper substitute pulses, and delayed approval of gene-edited varieties all weigh on expansion.
How is pigeon pea used in plant-based foods?
Manufacturers extract protein isolates and concentrates for dairy alternatives, meat analogues, and sports nutrition, leveraging pigeon pea's high lysine content.
Page last updated on:


