Europe Peas Market Analysis by Mordor Intelligence
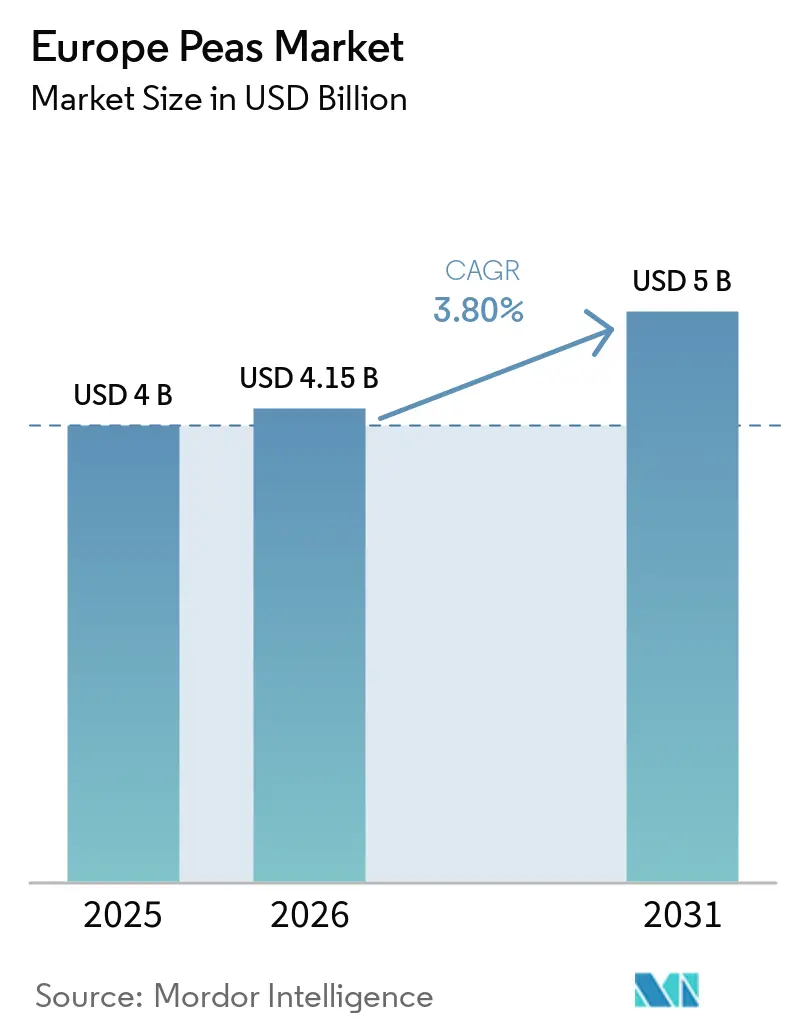
The Europe peas market size was valued at USD 4.0 billion in 2025 and is anticipated to grow from USD 4.15 billion in 2026 to USD 5.0 billion by 2031, registering a CAGR of 3.8% over 2026-2031. Demand resilience comes from feed formulators shifting toward non-genetically modified proteins, processors racing to commission new isolate plants, and European Union eco-schemes that reward nitrogen-fixing crop rotations. Rising carbon-credit premiums strengthen growers’ margins, while climate-induced droughts in Southern Europe encourage acreage moves toward water-efficient pulses. Logistics turbulence in the Black Sea pushes Western buyers to diversify import origins, and varietal innovation compresses the historical quality gap between feed and food grades.
Key Report Takeaways
- By geography, Russia commanded the largest share, accounting for 32.5% of Europe's pea market in 2025, while Ukraine is the fastest-growing geography with a 6.1% CAGR to 2031.
Note: Market size and forecast figures in this report are generated using Mordor Intelligence’s proprietary estimation framework, updated with the latest available data and insights as of January 2026.
Europe Peas Market Trends and Insights
Drivers Impact Analysis*
| Driver | (~) % Impact on CAGR Forecast | Geographic Relevance | Impact Timeline |
|---|---|---|---|
| Escalating demand from compound-feed manufacturers | +1.2% | Europe-wide, strongest in France, Germany, the Netherlands, and Poland | Medium term (2-4 years) |
| Rising vegan and flexitarian adoption in Europe | +0.9% | Western Europe, expanding to Southern and Eastern Europe | Long term (≥4 years) |
| Mandatory nitrogen-fixing crop rotations under the European Union (EU) Common Agricultural Policy (CAP) | +1.5% | European Union-27 member states | Short term (≤2 years) |
| Growth of pea-based protein extraction capacity | +1.3% | France, Germany, Sweden, and Belgium | Medium term (2-4 years) |
| Climate-change-resilient acreage shifts toward pulses | +0.8% | Spain, Italy, Poland, and Romania | Long term (≥4 years) |
| Carbon-credit premiums for legume cultivation | +0.6% | European Union-27 under the Carbon Farming framework | Long term (≥4 years) |
| Source: Mordor Intelligence | |||
Escalating Demand from Compound-Feed Manufacturers
European poultry and aquaculture mills accelerated soybean meal substitution with pea protein concentrates in 2025, attracted by 22-24% crude protein and superior amino acid digestibility[1]Source: European Feed Manufacturers’ Federation, “European Feed Production Statistics 2025,” fefac.eu. In 2024–2025, global feed compounders diversified rations due to biosecurity risks from African Swine Fever (ASF). To reduce reliance on high-risk soybean sources and manage input costs, feed mills increased field pea inclusion (up to 120 g/kg in starter rations). Poland’s mills increased their forward contracts for domestic peas, locking in supply and insulating budgets from volatility on the Chicago Board of Trade. French, German, and Dutch feed producers adopted multi-origin strategies that blend local peas with Canadian imports to meet precise digestibility targets. This structural switch is anticipated to sustain incremental pea offtake regardless of short-term price gyrations.
Rising Vegan and Flexitarian Adoption in Europe
Consumer demand for clean-label, allergen-free diets has driven investments in a pea protein isolate facility in Sweden, which was supported by the European Investment Bank (EIB) in 2025. Pea protein isolates, favored for their hypoallergenic properties and improved taste technology, account for over 50% of the market share. Ingredient buyers in France and Germany embedded local-sourcing clauses into procurement contracts to trim scope 3 emissions. Equinom’s Manna platform delivered ultra-high-protein pea genetics that entered field trials in 2024, narrowing the functional gap with soy isolates. Retail penetration of dairy alternatives featuring pea protein rose across Germany’s top supermarket chains in 2025.
Mandatory Nitrogen-Fixing Crop Rotations under the European Union Common Agricultural Policy
Under the Common Agricultural Policy (CAP) 2023–2027, farmers can fulfill Good Agricultural and Environmental Condition 8 requirements by using 7% of arable land for non-productive features and nitrogen-fixing crops without pesticides. Combined with the 25% mandatory allocation of direct payments to eco-schemes, this is set to increase support for protein crops by 25%, targeting 7 million hectares of legumes by 2027[2]Source: European Food Safety Authority, “Maximum Residue Levels for Pesticides,” efsa.europa.eu. France, Spain, Poland, and Romania expanded pea area to capture average premiums of EUR 150 per hectare (USD 158). Compliance audits rely on satellite imagery, minimizing greenwashing and guaranteeing soil organic carbon gains of 0.3-0.5 metric tons per hectare yearly. The subsidy floor encourages multi-year planting commitments that align with protein-extraction plant ramp-ups. Farmers in Spain integrated peas into wheat-sunflower rotations, boosting nitrogen balance and reducing fertilizer bills.
Growth of Pea-Based Protein Extraction Capacity
In April 2025, Lantmännen and Ingredion secured a EUR 100 million (USD 105 million) loan to finance the construction of a 40,480 metric ton-per-year isolate plant, scheduled to commence operations in 2027 in Lidköping, Sweden[3]Source: Ingredion Incorporated, “Ingredion and Lantmännen Create Strategic Partnership to Accelerate Development of Plant-Based Proteins,” ir.ingredionincorporated.com. Cosucra Groupe Warcoing expanded its Belgian pea fiber production line to support sugar-reduced bakery fillings with high water-binding capacity. This expansion is anticipated to increase demand for food-grade pea fiber, diversify revenue streams, and strengthen the premium segments of the European pea commodity market. Between 2024 and 2028, additional extraction capacities in Europe are anticipated to absorb large domestic harvests, leading to higher baseline farm-gate prices and stabilizing grower incomes. Processors are entering multiyear supply contracts with specific crude protein and tannin thresholds, promoting quality-focused cultivation practices.
Restraints Impact Analysis*
| Restraint | (~) % Impact on CAGR Forecast | Geographic Relevance | Impact Timeline |
|---|---|---|---|
| Volatile farm-gate prices linked to French Marché à Terme International de France (MATIF) pulse futures | −0.7% | France, Belgium, Germany, Poland, Romania | Short term (≤2 years) |
| Tight European Union pesticide maximum residue level regulations for dry peas | −0.5% | European Union-27, impacting Canadian and Ukrainian suppliers | Medium term (2-4 years) |
| Logistics bottlenecks at Black Sea ports | −0.4% | Ukraine and Russia corridors, import dependence in Germany, the Netherlands, and Spain | Short term (≤2 years) |
| Limited on-farm storage infrastructure in Eastern Europe | −0.3% | Poland, Romania, Bulgaria, and Hungary | Medium term (2-4 years) |
| Source: Mordor Intelligence | |||
Volatile farm-gate prices linked to French Marché à Terme International de France (MATIF) pulse futures
In 2025, physical pea prices in Europe exhibited significant volatility due to a projected drought in Canada and ongoing risks to Ukrainian exports. These factors discouraged forward selling and constrained acreage growth in marginal growing regions of France. Although Belgium and Germany typically align with French price benchmarks, a widening local basis has increasingly pressured feed-mill margins. Smaller cooperatives, which often lack expertise in specialized derivatives, have faced heightened cash-flow challenges during sharp price declines. While processors manage risk through calendar spreads and origin diversification, growers without access to advanced hedging tools remain highly vulnerable. This sustained price volatility continues to hinder near-term acreage expansion, despite supportive EU policies promoting plant-based proteins.
Tight European Union Pesticide Maximum Residue Level Regulations for Dry Peas
The European Food Safety Authority updated residue thresholds in 2025, maintaining zero tolerance for several compounds and triggering higher rejection rates at ports. Canadian shippers endured intensified testing after late-2025 trace detections, stretching dwell times and adding costs. Ukrainian growers struggled to obtain approved fungicides amid wartime constraints, resulting in reduced yields and export competitiveness. Domestic European Union farmers face rising compliance fees as the 2026-2028 monitoring program deepens sampling intensity. These burdens raise supply-chain costs and may discourage smallholders from pulse cultivation.
*Our forecasts treat driver/restraint impacts as directional, not additive. The impact forecasts reflect baseline growth, mix effects, and variable interactions.
Geography Analysis
Russia accounted for 32.5% of regional consumption value in 2025, driven by significant livestock feed throughput and the establishment of new isolate plants in Kursk and Belgorod. Record agricultural yields were supported by state subsidies that facilitated inoculant and seed purchases, enabling double-digit farm-gate price growth despite increased logistics costs. Domestic processors focused on extracting concentrates for aquafeed, reducing dependency on imported fishmeal, and secured offtake agreements with Baltic exporters. Regional authorities prioritized rail infrastructure upgrades to the Baltics to mitigate Black Sea congestion. Moscow’s 2026 bioeconomy roadmap outlines a target of 250,000 metric tons of deep pulse processing capacity by 2028. This strategy, supported by a 5% permanent export duty on raw legumes, including peas, introduced in 2025, aims to transition Russia from a leading raw pulse exporter to a major producer of high-value protein isolates and bio-based ingredients.
Ukraine is projected to be the fastest-growing geography, with a 6.1% CAGR forecast for 2026-2031, contingent on the normalization of trade corridors and the repair of infrastructure. The Association Agreement with the European Union has eliminated duties on pea exports, while donor-funded silo reconstruction is accelerating the adoption of on-farm storage solutions. In late 2025, domestic processors such as TERRA commissioned new facilities in the Kharkiv region to produce pea protein isolates, targeting pea use in the Western market. These high-value ingredients are increasingly preferred by EU manufacturers for their neutral taste and allergen-free properties, enabling Ukraine to diversify its agricultural exports beyond raw sunflower oil. Although war-risk premiums constrained early-2026 seaborne volumes, European Investment Bank credit lines are anticipated to alleviate capital constraints by 2027. Furthermore, Kyiv’s policy framework aims to achieve a pea harvest of 1 million metric tons by 2030.
France, Germany, and Spain collectively supported Western European demand. In 2024, France reduced its pea cultivation area due to wet spring conditions, but the expansion of Vic-sur-Aisne tightened feedstock availability, pushing farm prices higher. Germany imported significant amounts of dried peas in 2024–2025, focusing on reducing Scope 3 emissions and complying with the European Union (EU) Deforestation Regulation (EUDR). By replacing high-risk soy with regional legumes, manufacturers aim to meet deforestation-free supply chain requirements by late 2025. In 2025, Spain's Castilla y León region used a near-record 8.1 million-ton harvest to address feed shortages in Catalonia's broiler clusters. By expanding pulse acreage and applying CAP eco-schemes for crop rotation with legumes, the region reinforced its role as the key inland supplier for Catalonia's 12 million metric ton compound feed industry. Meanwhile, the Netherlands emerged as a re-export hub for legume products, channeling Canadian peas to German and Belgian isolate processing plants.
Competitive Landscape
Roquette Frères and Emsland-Stärke GmbH are key players in Europe’s pea-protein value chain, integrating sourcing, processing, and ingredient supply. Roquette Frères operates globally with a pea-processing capacity of 250,000 metric tons annually, supported by facilities in Europe and North America. Emsland-Stärke GmbH focuses on regional integration, processing 160,000 tons of peas annually through farmer partnerships and multi-site production in Germany. Both companies are advancing into higher-value food and specialty ingredient applications, driven by growing plant-based demand and a focus on traceability and sustainability.
AGT Food and Ingredients Inc., Archer-Daniels-Midland Company, and Cargill Incorporated diversify the market with operations in trading, origination, and ingredient innovation. AGT Food and Ingredients Inc. combines global pulse trading with value-added processing and partners with Equinom to develop high-protein crop varieties. Archer-Daniels-Midland Company leverages its global origination network and plant protein expertise to supply scalable ingredients. Cargill Incorporated integrates commodity trading with product development, expanding into plant-based and fermentation-driven proteins through partnerships and innovation platforms. These companies balance upstream access, processing scale, and application development across Europe.
Roquette Frères, Emsland-Stärke GmbH, AGT Food and Ingredients Inc., Archer-Daniels-Midland Company, and Cargill Incorporated account for over half of Europe’s organized pea value chain. Their investments in capacity expansion, crop improvement, and sustainable sourcing enhance supply security and support higher-margin food and nutraceutical applications. Advanced processing technologies and collaborative innovation models are improving the functionality, nutrition, and environmental performance of pea-based ingredients. The competitive landscape is anticipated to consolidate further, with leading players driving market growth through 2031 by aligning scale, innovation, and procurement strategies.
Recent Industry Developments
- January 2025: Lantmännen secured a EUR 50 million (USD 52.5 million) European Investment Bank loan to finance its 40,480 metric ton-per-year pea isolate facility in Sweden. The new plant will lift regional demand for feedstock peas, supporting stronger farm-gate prices and faster market expansion.
- December 2024: The European Union adopted the Carbon Removals and Carbon Farming regulation, creating certified carbon units from pulse rotations. The framework boosts grower profitability through carbon payments, encouraging larger pea acreage and underpinning long-term supply growth.
- November 2024: Lantmännen and Ingredion invested EUR 100 million (USD 105 million) in pea isolate production in Lidköping, Sweden, to develop low-carbon ingredients for dairy alternatives. The upcoming facility in 2027 will secure long-term contracts for yellow peas, tightening raw material supply and accelerating value growth across the European pea commodity market.


Europe Peas Market Report Scope
The pea is the tiny, spherical seed or seed pod of the flowering plant Pisum sativum. It is the fourth-most important legume crop, following soybeans, groundnuts, and beans. The European Pea Market Report is segmented by Geography (Russia, Ukraine, France, Spain, Netherland, and more). The Report Includes Production Analysis (Volume), Consumption Analysis (Value and Volume), Import Analysis (Value and Volume), Export Analysis (Value and Volume), Wholesale Price Trend Analysis and Forecast, Regulatory Framework, List of Key Players, Logistics and Infrastructure, and Seasonality Analysis. The Market Forecasts are Provided in Terms of Value (USD) and Volume (Metric Tons).
By Geography
| Russia | Production Analysis (Area Harvested, Yield, and Production Volume) | Consumption Analysis (Consumption Value and Volume) |
| Import Market Analysis (Import Value, Volume, and Key Supplying Markets) | ||
| Export Market Analysis (Export Value, Volume, and Key Destination Markets) | ||
| Wholesale Price Trend Analysis and Forecast | ||
| Regulatory Framework | ||
| List of Key Players | ||
| Logistics and Infrastructure | ||
| Seasonality Analysis | ||
| Ukraine | Production Analysis (Area Harvested, Yield, and Production Volume) | |
| Consumption Analysis (Consumption Value and Volume) | ||
| Import Market Analysis (Import Value, Volume, and Key Supplying Markets) | ||
| Export Market Analysis (Export Value, Volume, and Key Destination Markets) | ||
| Wholesale Price Trend Analysis and Forecast | ||
| Regulatory Framework | ||
| List of Key Players | ||
| Logistics and Infrastructure | ||
| Seasonality Analysis | ||
| France | Production Analysis (Area Harvested, Yield, and Production Volume) | |
| Consumption Analysis (Consumption Value and Volume) | ||
| Import Market Analysis (Import Value, Volume, and Key Supplying Markets) | ||
| Export Market Analysis (Export Value, Volume, and Key Destination Markets) | ||
| Wholesale Price Trend Analysis and Forecast | ||
| Regulatory Framework | ||
| List of Key Players | ||
| Logistics and Infrastructure | ||
| Seasonality Analysis | ||
| Spain | Production Analysis (Area Harvested, Yield, and Production Volume) | |
| Consumption Analysis (Consumption Value and Volume) | ||
| Import Market Analysis (Import Value, Volume, and Key Supplying Markets) | ||
| Export Market Analysis (Export Value, Volume, and Key Destination Markets) | ||
| Wholesale Price Trend Analysis and Forecast | ||
| Regulatory Framework | ||
| List of Key Players | ||
| Logistics and Infrastructure | ||
| Seasonality Analysis | ||
| Netherlands | Production Analysis (Area Harvested, Yield, and Production Volume) | |
| Consumption Analysis (Consumption Value and Volume) | ||
| Import Market Analysis (Import Value, Volume, and Key Supplying Markets) | ||
| Export Market Analysis (Export Value, Volume, and Key Destination Markets) | ||
| Wholesale Price Trend Analysis and Forecast | ||
| Regulatory Framework | ||
| List of Key Players | ||
| Logistics and Infrastructure | ||
| Seasonality Analysis | ||
| Germany | Production Analysis (Area Harvested, Yield, and Production Volume) | |
| Consumption Analysis (Consumption Value and Volume) | ||
| Import Market Analysis (Import Value, Volume, and Key Supplying Markets) | ||
| Export Market Analysis (Export Value, Volume, and Key Destination Markets) | ||
| Wholesale Price Trend Analysis and Forecast | ||
| Regulatory Framework | ||
| List of Key Players | ||
| Logistics and Infrastructure | ||
| Seasonality Analysis | ||
| Italy | Production Analysis (Area Harvested, Yield, and Production Volume) | |
| Consumption Analysis (Consumption Value and Volume) | ||
| Import Market Analysis (Import Value, Volume, and Key Supplying Markets) | ||
| Export Market Analysis (Export Value, Volume, and Key Destination Markets) | ||
| Wholesale Price Trend Analysis and Forecast | ||
| Regulatory Framework | ||
| List of Key Players | ||
| Logistics and Infrastructure | ||
| Seasonality Analysis | ||
| Poland | Production Analysis (Area Harvested, Yield, and Production Volume) | |
| Consumption Analysis (Consumption Value and Volume) | ||
| Import Market Analysis (Import Value, Volume, and Key Supplying Markets) | ||
| Export Market Analysis (Export Value, Volume, and Key Destination Markets) | ||
| Wholesale Price Trend Analysis and Forecast | ||
| Regulatory Framework | ||
| List of Key Players | ||
| Logistics and Infrastructure | ||
| Seasonality Analysis | ||
| Romania | Production Analysis (Area Harvested, Yield, and Production Volume) | |
| Consumption Analysis (Consumption Value and Volume) | ||
| Import Market Analysis (Import Value, Volume, and Key Supplying Markets) | ||
| Export Market Analysis (Export Value, Volume, and Key Destination Markets) | ||
| Wholesale Price Trend Analysis and Forecast | ||
| Regulatory Framework | ||
| List of Key Players | ||
| Logistics and Infrastructure | ||
| Seasonality Analysis | ||
| By Geography | Russia | Production Analysis (Area Harvested, Yield, and Production Volume) | Consumption Analysis (Consumption Value and Volume) |
| Import Market Analysis (Import Value, Volume, and Key Supplying Markets) | |||
| Export Market Analysis (Export Value, Volume, and Key Destination Markets) | |||
| Wholesale Price Trend Analysis and Forecast | |||
| Regulatory Framework | |||
| List of Key Players | |||
| Logistics and Infrastructure | |||
| Seasonality Analysis | |||
| Ukraine | Production Analysis (Area Harvested, Yield, and Production Volume) | ||
| Consumption Analysis (Consumption Value and Volume) | |||
| Import Market Analysis (Import Value, Volume, and Key Supplying Markets) | |||
| Export Market Analysis (Export Value, Volume, and Key Destination Markets) | |||
| Wholesale Price Trend Analysis and Forecast | |||
| Regulatory Framework | |||
| List of Key Players | |||
| Logistics and Infrastructure | |||
| Seasonality Analysis | |||
| France | Production Analysis (Area Harvested, Yield, and Production Volume) | ||
| Consumption Analysis (Consumption Value and Volume) | |||
| Import Market Analysis (Import Value, Volume, and Key Supplying Markets) | |||
| Export Market Analysis (Export Value, Volume, and Key Destination Markets) | |||
| Wholesale Price Trend Analysis and Forecast | |||
| Regulatory Framework | |||
| List of Key Players | |||
| Logistics and Infrastructure | |||
| Seasonality Analysis | |||
| Spain | Production Analysis (Area Harvested, Yield, and Production Volume) | ||
| Consumption Analysis (Consumption Value and Volume) | |||
| Import Market Analysis (Import Value, Volume, and Key Supplying Markets) | |||
| Export Market Analysis (Export Value, Volume, and Key Destination Markets) | |||
| Wholesale Price Trend Analysis and Forecast | |||
| Regulatory Framework | |||
| List of Key Players | |||
| Logistics and Infrastructure | |||
| Seasonality Analysis | |||
| Netherlands | Production Analysis (Area Harvested, Yield, and Production Volume) | ||
| Consumption Analysis (Consumption Value and Volume) | |||
| Import Market Analysis (Import Value, Volume, and Key Supplying Markets) | |||
| Export Market Analysis (Export Value, Volume, and Key Destination Markets) | |||
| Wholesale Price Trend Analysis and Forecast | |||
| Regulatory Framework | |||
| List of Key Players | |||
| Logistics and Infrastructure | |||
| Seasonality Analysis | |||
| Germany | Production Analysis (Area Harvested, Yield, and Production Volume) | ||
| Consumption Analysis (Consumption Value and Volume) | |||
| Import Market Analysis (Import Value, Volume, and Key Supplying Markets) | |||
| Export Market Analysis (Export Value, Volume, and Key Destination Markets) | |||
| Wholesale Price Trend Analysis and Forecast | |||
| Regulatory Framework | |||
| List of Key Players | |||
| Logistics and Infrastructure | |||
| Seasonality Analysis | |||
| Italy | Production Analysis (Area Harvested, Yield, and Production Volume) | ||
| Consumption Analysis (Consumption Value and Volume) | |||
| Import Market Analysis (Import Value, Volume, and Key Supplying Markets) | |||
| Export Market Analysis (Export Value, Volume, and Key Destination Markets) | |||
| Wholesale Price Trend Analysis and Forecast | |||
| Regulatory Framework | |||
| List of Key Players | |||
| Logistics and Infrastructure | |||
| Seasonality Analysis | |||
| Poland | Production Analysis (Area Harvested, Yield, and Production Volume) | ||
| Consumption Analysis (Consumption Value and Volume) | |||
| Import Market Analysis (Import Value, Volume, and Key Supplying Markets) | |||
| Export Market Analysis (Export Value, Volume, and Key Destination Markets) | |||
| Wholesale Price Trend Analysis and Forecast | |||
| Regulatory Framework | |||
| List of Key Players | |||
| Logistics and Infrastructure | |||
| Seasonality Analysis | |||
| Romania | Production Analysis (Area Harvested, Yield, and Production Volume) | ||
| Consumption Analysis (Consumption Value and Volume) | |||
| Import Market Analysis (Import Value, Volume, and Key Supplying Markets) | |||
| Export Market Analysis (Export Value, Volume, and Key Destination Markets) | |||
| Wholesale Price Trend Analysis and Forecast | |||
| Regulatory Framework | |||
| List of Key Players | |||
| Logistics and Infrastructure | |||
| Seasonality Analysis | |||


Key Questions Answered in the Report
What is the forecast value of the Europe peas market by 2031?
The market is projected to reach USD 5.0 billion by 2031.
Why are European feed mills using more peas?
They substitute soybean meal with non-genetically modified pea protein to meet sustainability and regulatory goals.
Which country leads regional pea consumption?
Russia held 32.5% of regional consumption value in 2025.
How will protein extraction affect pea demand?
New isolate plants in France, Sweden, and Belgium drive the fastest demand growth, absorbing large volumes of yellow peas.
Page last updated on:


