
Piece Picking Robots Market Size and Share
Market Overview
| Study Period | 2020 - 2031 |
|---|---|
| Market Size (2026) | USD 2.58 Billion |
| Market Size (2031) | USD 20.78 Billion |
| Growth Rate (2026 - 2031) | 51.78 % |
| Fastest Growing Market | North America |
| Largest Market | Asia Pacific |
| Market Concentration | Medium |
Major Players
*Disclaimer: Major Players sorted in no particular order Image © Mordor Intelligence. Reuse requires attribution under CC BY 4.0. |
|
Piece Picking Robots Market Analysis by Mordor Intelligence
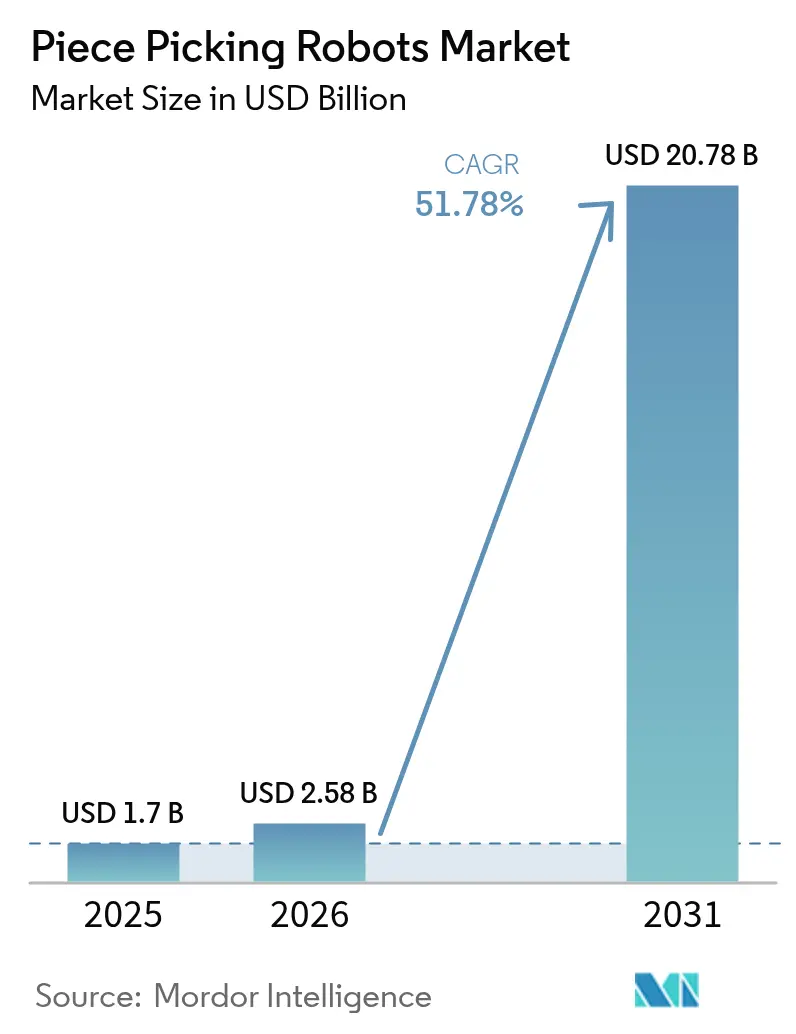
The piece-picking robots market size is expected to grow from USD 1.7 billion in 2025 to USD 2.58 billion in 2026 and is forecast to reach USD 20.78 billion by 2031 at 51.78% CAGR over 2026-2031. Rapid scalability arises from persistent labor shortages, e-commerce parcel growth, and artificial-intelligence breakthroughs that push robotic picking accuracy above 95%. The pace outstrips traditional warehouse automation because manual picking still absorbs up to 60% of fulfillment costs, prompting operators to automate the most labor-intensive workflows. Robots-as-a-Service (RaaS) models lower upfront capital while subscription pricing aligns expenses with seasonal volumes. North America leads adoption, yet Asia-Pacific records the steepest CAGR as aging workforces and wage inflation heighten automation urgency. Competitive positioning now depends less on hardware and more on software that refines grasp planning in real time, underpinning a swift shift toward intelligent, mobile systems that collaborate safely with people.
Key Report Takeaways
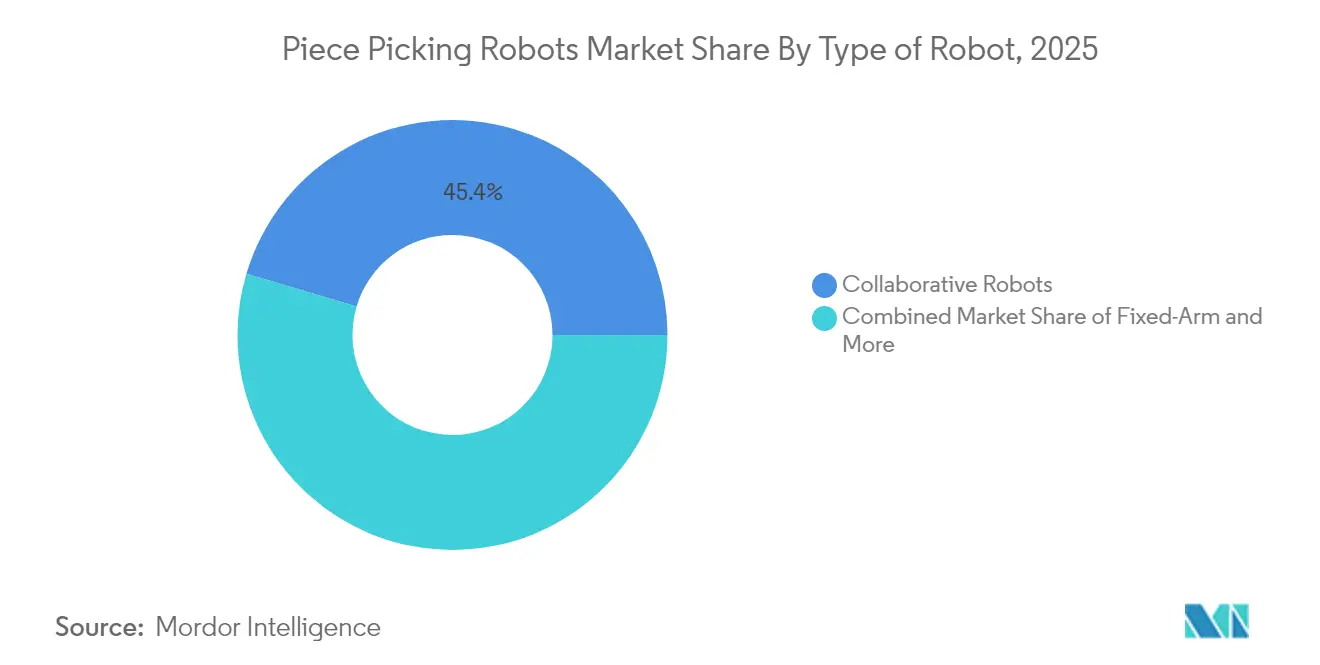
- By robot type, collaborative systems held 45.40% of the piece-picking robots market share in 2025, while mobile AMRs are projected to surge at a 49.2% CAGR to 2031.
- By component, hardware represented 57.10% of 2025 revenue; software is the fastest riser at a 51.3% CAGR through 2031.
- By end-user industry, e-commerce and retail commanded 53.20% of deployments in 2025; grocery and FMCG are expanding at a 55.4% CAGR to 2031.
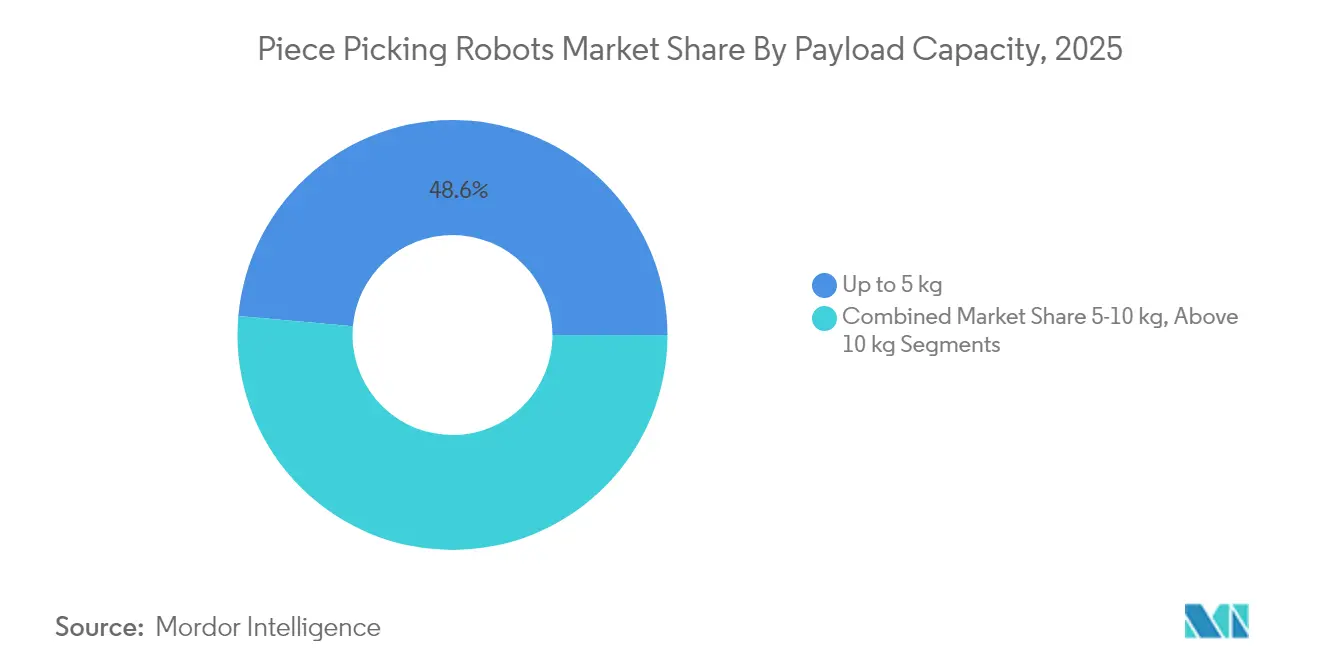
- By payload, the up-to-5 kg class accounted for 48.60% of the piece-picking robots market size in 2025 and is forecast to climb at a 52.9% CAGR through 2031.
- By deployment model, RaaS already represents 60.30% of 2025 installations and is growing at 52.6% annually.
- By geography, North America captured 36.70% revenue share in 2025; Asia-Pacific is advancing at a 54.9% CAGR over 2026-2031.
Note: Market size and forecast figures in this report are generated using Mordor Intelligence’s proprietary estimation framework, updated with the latest available data and insights as of 2026.
Market Trends and Insights
Drivers Impact Analysis of Piece Picking Robots Market*
| Driver | (~) % Impact on CAGR Forecast | Geographic Relevance | Impact Timeline |
|---|---|---|---|
| Rising e-commerce order volumes and SKU proliferation | +12.5% | Global, concentrated in North America & APAC | Medium term (2-4 years) |
| Labour scarcity & wage inflation in mature logistics hubs | +15.2% | North America & EU, spreading to APAC urban centers | Short term (≤ 2 years) |
| Vision-AI breakthroughs enabling ≥ 95% pick accuracy | +8.7% | Global, early adoption in North America & Northern Europe | Medium term (2-4 years) |
| Cost-down in cobot arms (< USD 15,000) widening SME adoption | +6.8% | Global, impactful in APAC & emerging markets | Long term (≥ 4 years) |
| Source: Mordor Intelligence | |||


Rising e-commerce order volumes and SKU proliferation
SKU counts are climbing 40% each year at large fulfillment centers, while order sizes fracture into smaller parcels. Piece-picking robots rely on machine-learning algorithms that now handle millions of unique items and reach 1,200 picks per hour. Micro-fulfillment footprints and same-day delivery guarantees intensify the requirement for systems that identify new objects in 0.3 seconds, driving the piece-picking robots market toward AI-rich software.
Labour scarcity and wage inflation in mature logistics hubs
More than 55% of warehouse operators cite labor shortages as the primary trigger for automation. [1]Locus Robotics, “Warehouse Labor Challenges: Automation Solutions,” locusrobotics.com Wage growth in logistics consistently exceeds general inflation, strengthening the investment case for robotics even at current price points. Japan underscores the point, with government programs positioning robotics as essential infrastructure amid a rapidly aging workforce s Robots also mitigate turnover by eliminating repetitive lifting tasks and enabling safer human-robot collaboration.
Vision-AI breakthroughs enabling ≥ 95% pick accuracy
Deep-learning perception now approaches human accuracy for object recognition, while tactile sensors add grip-force intelligence. Amazon’s Vulcan robot has cut damage rates and lifted throughput, highlighting how edge AI enables real-time decision-making at human-reaction speeds
Cost-down in cobot arms (< USD 15,000) widening SME adoption
Entry-level collaborative arms now list below USD 15,000, a sharp fall from 2020 prices that topped USD 50,000. [2]Standard Bots, “How Much Do Robots Cost?,” standardbots.com RaaS models reduce cash-flow hurdles further by spreading costs across pick volumes, letting smaller operations access top-tier capabilities without upfront capex.
Restraints Impact Analysis of Piece Picking Robots Market*
| Restraint | (~) % Impact on CAGR Forecast | Geographic Relevance | Impact Timeline |
|---|---|---|---|
| Persistent gripper limitations for deformable SKUs | -4.2% | Global, challenging in grocery & FMCG | Medium term (2-4 years) |
| High failure-on-first-pick KPI penalties in grocery | -2.8% | North America & EU grocery chains | Short term (≤ 2 years) |
| Source: Mordor Intelligence | |||
Persistent gripper limitations for deformable SKUs
Robots still struggle with soft goods and flexible packaging. Success rates drop to 75–80% on deformable items versus 95% on rigid parts, restricting uptake in grocery and FMCG where dexterity matters most .
High failure-on-first-pick KPI penalties in grocery
Grocery fulfilment tolerates error rates below 1%. Robotic mis-picks lead to substitutions and spoilage costs that can exceed an order’s value, so operators remain cautious until accuracy metrics improve for variable produce and chilled inventories.
*Our forecasts treat driver/restraint impacts as directional, not additive. The impact forecasts reflect baseline growth, mix effects, and variable interactions.
Piece Picking Robots Market Segment Analysis
By Type of Robot:
Mobile AMRs Unlock Flexible WorkflowsMobile autonomous robots are climbing at a 49.2% CAGR and underpin next-generation agility, while collaborative arms retained 45.40% of 2025 revenue. This mix shows the piece-picking robots market shifting from fixed stations toward fleets that navigate dynamic warehouse aisles without heavy infrastructure.
Mobile platforms adapt routing based on live congestion and eliminate conveyance bottlenecks, raising system uptime during peak seasons. Brightpick’s Autopicker lifts items directly from totes and places them into outbound orders, cutting travel cycles and reducing dock-to-ship times. Fixed-arm units remain vital in pharmaceuticals and electronics where micron-level precision outweighs layout flexibility, yet growth is slower than the mobile cohort.


By Component:
Software Emerges as the Prime DifferentiatorHardware accounted for 57.10% of 2025 spend, but software is growing 51.3% per year and fast becomes the profit engine. AI-driven stacks refine grasp-planning logic in real time, shrinking pick-cycle latency and expanding SKU coverage. AutoStore’s CarouselAI optimizes sequence selection without human tuning, demonstrating how software outpaces mechanical innovation in value creation .
Service revenues scale alongside software as integrators maintain fleets via cloud diagnostics and predictive maintenance. With over a petabyte of execution data, RightHand Robotics continuously updates algorithms, illustrating that data flywheels lock in customers through compounding accuracy gains
By End-User Industry:
Grocery Surge Redefines Demand ProfilesE-commerce and omnichannel retail still deliver 53.20% of deployments, but grocery and FMCG show a 55.4% CAGR as supermarkets target in-store pick stations and dedicated dark stores. AutoStore’s eOperator demonstrates 800 lines per hour while maintaining pharmaceutical-grade accuracy, proving robots can handle temperature-controlled inventories.
Pharmaceutical facilities prize full traceability, embedding barcode scans within each robotic cycle. Third-party logistics providers extend robots across client portfolios, valuing the flexibility to switch SKUs daily without re-engineering grippers or vision pipelines. Automotive parts, apparel, and B2B industrial supplies remain emerging use cases where high mix counts and variable form factors align with maturing AI.
By Payload Capacity:
Up to 5 kg Becomes the NormThe ≤ 5 kg band owned 48.60% of 2025 revenue and advances at a 52.9% CAGR, encapsulating lightweight consumer goods that dominate e-commerce picks. This bracket optimizes speed-to-weight ratios, achieving 1,200 picks per hour with minimal energy draw.
Mid-range 5–10 kg systems serve bulk grocery, power tools, and office supplies, while 10 kg+ robots linger in niche heavy parts and appliance lines where throughput demands differ. Concentrating on the high-volume lightweight tier creates learning-curve effects that keep costs on a downward slope and accelerate the overall piece-picking robots market size.
By Deployment Model:
RaaS Reshapes Capital AllocationRaaS commands 60.30% of installed units and grows 52.6% per year, translating capex into predictable opex and transferring obsolescence risk to vendors. The global RaaS segment is forecast to climb from USD 1.33 billion in 2023 to USD 4.79 billion by 2031. Pay-per-pick pricing aligns cash outflows with revenue, a structure particularly attractive to small and medium warehouses that face volatile order volumes.
Large enterprises still sign direct-purchase contracts when volumes and internal engineering capabilities justify asset ownership. Yet even top-tier retailers deploy hybrid models, leasing extra units for holiday peaks then scaling back fleets to steady-state levels without idle capital.
Geography Analysis
North America Piece Picking Robots Market
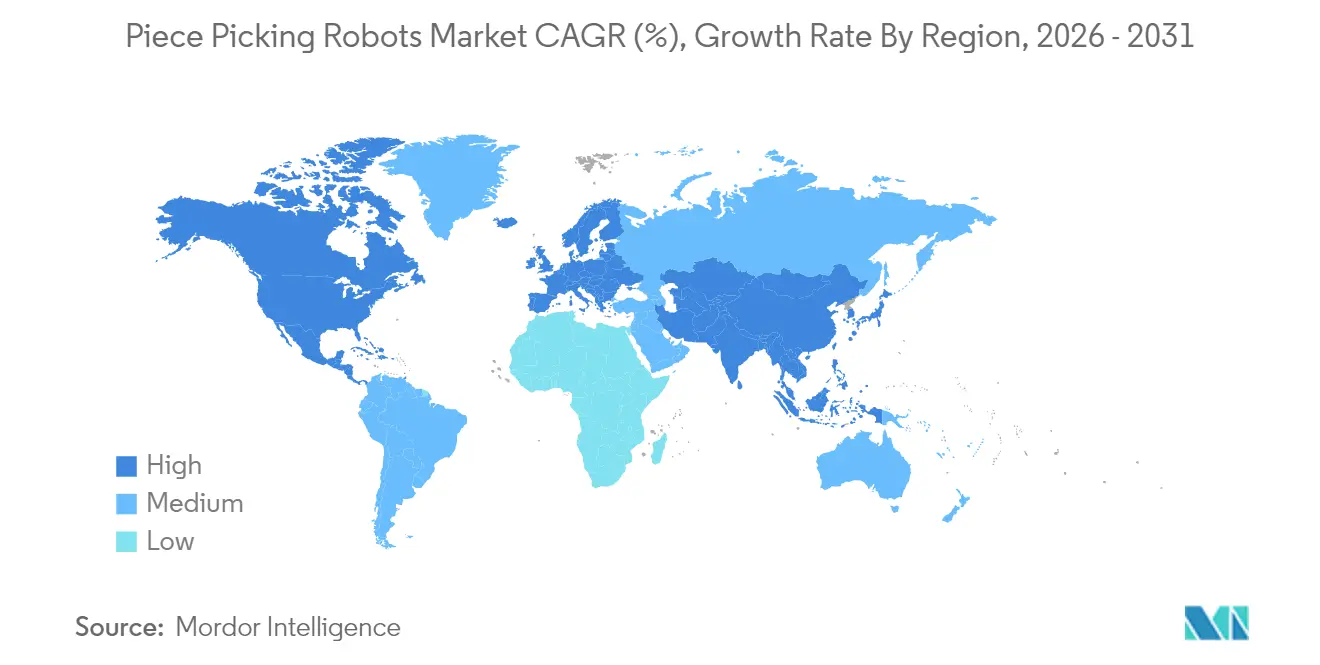
North America captured 36.70% of 2025 turnover by combining mature e-commerce, advanced logistics real estate, and sustained automation budgets. U.S. industrial companies now assign 25-30% of capital investment to automation compared with 15-20% before the pandemic, reinforcing demand for piece-picking solutions. Tax incentives further sweeten returns, and early movers like Staples report measurable productivity gains from intelligent picking cells.
APAC Piece Picking Robots Market
Asia-Pacific is expanding at a 54.9% CAGR and may eclipse North America before 2030. Government-backed initiatives in Japan support robotics as part of national productivity policy, while China’s logistics automation spending surpassed CNY 1.167 trillion (USD 160.5 billion) in 2023. foreign direct investment of USD 230 billion in 2023 fuels new fulfillment hubs that jump directly to advanced automation architectures.
EMEA and South America Piece Picking Robots Market
Europe shows steady expansion driven by Germany’s density of 415 robots per 10,000 workers and a venture ecosystem that raised EUR 2 billion (USD 2.2 billion) for robotics in 2023 sifted. Nomagic securing EUR 41.5 million (USD 44.7 million) to broaden AI picking underscores continuing appetite for specialized disruptors. South America and the Middle East & Africa are nascent, yet rising logistics investment and ecommerce adoption signal future inflection once proven solutions drop in cost and complexity.

Regulatory Landscape
Piece-picking robots sit within machinery safety regimes and voluntary robot safety standards. In Europe, the baseline is tightening through Regulation (EU) 2023/1230 (EU Machinery Regulation), which applies from 20 January 2027 and explicitly covers autonomous mobile machinery, safety-related AI functions, and cybersecurity considerations. The regulation raises conformity expectations for high-risk machinery, including third-party conformity assessment where there is self-evolving behavior via machine learning used in safety functions. As a result, compliance and documentation requirements increase for AI-enabled picking cells and AMR-based picking fleets.
In North America, safety compliance leans on consensus standards and workplace enforcement guidance. ANSI/A3 R15.06-2025 updates industrial robot system safety and clarifies risk assessment for collaborative applications, which are increasingly framed as collaborative applications rather than cobot-only attributes. Canada aligns through CSA Z434-2026, including updated approaches to safeguarding, risk assessment, and cybersecurity. Across regions, integrators and end users in warehouses and fulfillment centers face higher change-management expectations, since software updates that introduce new hazards can trigger re-assessment obligations under modern machinery compliance frameworks.
Value Chain Analysis
The value chain starts upstream with actuator and motion components (servo motors, reducers, drives), sensing and compute (3D vision, cameras, edge GPUs, safety scanners), and end-of-arm tooling (vacuum and finger grippers) that shape SKU coverage, especially for deformable grocery and FMCG items. Midstream, robot OEMs and solution providers package fixed arms, collaborative robots, and mobile platforms into picking cells or fleets. AI software suppliers provide perception, grasp planning, and exception handling, which increasingly differentiates offerings as hardware costs decline. System integrators and warehouse solution providers then combine picking with goods-to-person (ASRS/shuttles/cube storage), conveyors, and WMS/WES connectivity, along with safety validation. This is a key step, since picking performance in production depends on site-specific bin presentation, SKU mix, and throughput constraints.
Downstream, buyers include e-commerce and retail fulfillment centers, 3PL/parcel logistics, grocery micro-fulfillment, and regulated verticals such as pharmaceuticals that require traceability. Commercial models extend beyond capex to Robots-as-a-Service, shifting value capture toward software, services, and lifecycle support, including remote monitoring, maintenance, and spares. Field activity also reflects how deployments work as a combined system: Brightpick scaled Autopicker use at a Tennessee operation to a 50-robot footprint to raise pick rates, while Geek+ deployments and product moves such as RoboShuttle V5 continue to pair shuttle-based storage with robot arm picking stations. Large networks can also shape supplier roadmaps through volume learning and operational data, reinforcing the role of installed-base data in improving AI pick success and expanding SKU coverage.
Competitive Landscape
Innovation and Integration Drive Future Success
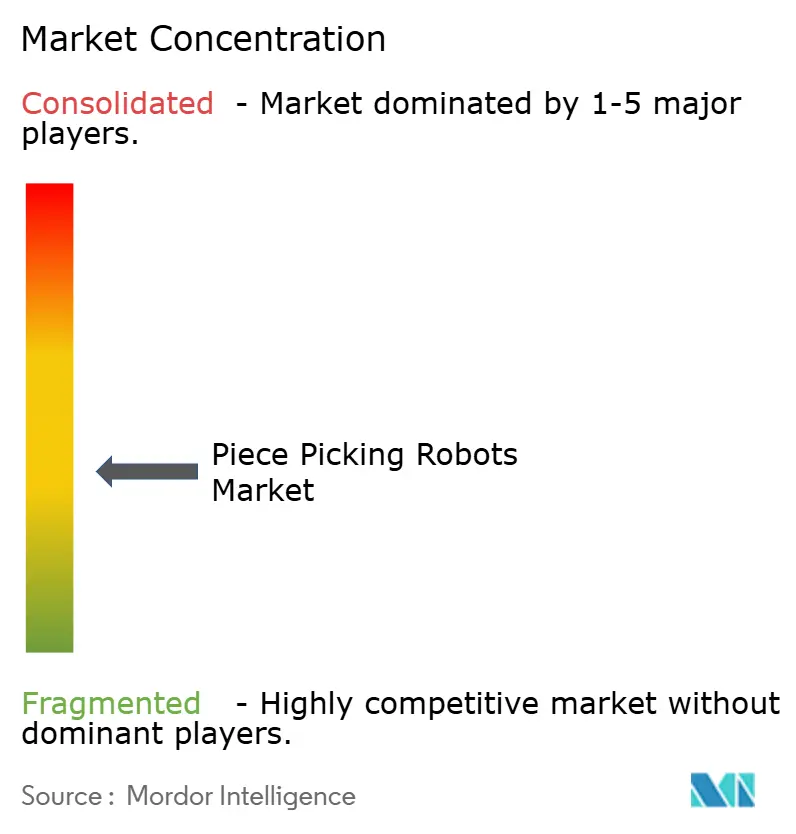
Competitive intensity is moderate. No single vendor exceeds a double-digit global share, yet technical moats form around AI algorithms, domain-specific grippers, and integration experience. RightHand Robotics and Covariant apply large operational datasets to refine cloud-delivered brains, while AutoStore, Geek+, and OTTO Motors bundle ASRS, AMRs, and piece-picking arms into turnkey platforms.
Strategic investments mark the path to scale. Rockwell Automation’s March 2025 stake in RightHand Robotics aims to fold best-in-class picking into Rockwell’s controls ecosystem, expanding addressable markets and accelerating time-to-integrate. Midsize innovators focus on niche white spaces. Nexera Robotics secured USD 4.5 million to refine compliant grippers for irregular grocery items, attacking a pain point incumbents have yet to master.
Vertical integration is accelerating. Logistics service giants like DHL commit tens of millions to automated life-science warehouses equipped with Geek+ fleets, locking in proprietary know-how that strengthens client retention. Simultaneously, software-first houses partner with hardware OEMs to ensure end-to-end warranty and maintenance coverage, a tactic that reassures risk-averse customers and compresses vendor selection cycles.
Piece Picking Robots Industry Leaders
-
RightHand Robotics
-
Berkshire Grey
-
Covariant
-
Plus One Robotics
-
Ocado Group (Robotics Solutions)
- *Disclaimer: Major Players sorted in no particular order
Piece Picking Robots Market Companies Covered in this Report
- RightHand Robotics Inc.
- Berkshire Grey Inc.
- Covariant
- Plus One Robotics Inc.
- Universal Robots A/S (Teradyne Inc.)
- Locus Robotics Corp.
- Ocado Group plc
- KNAPP AG
- Dematic Group (KION AG)
- Swisslog Holding AG
- GreyOrange Pte Ltd
- Mujin Inc.
- XYZ Robotics Inc.
- Nomagic Inc.
- Osaro Inc.
- Nimble Robotics Inc.
- Lyro Robotics Pty Ltd
- Robomotive BV
- Hand Plus Robotics Pte Ltd
- SSI SCHAEFER Group
- Daifuku Co. Ltd.

Market Opportunities and Future Outlook
Opportunities concentrate where operators can remove manual travel and repetitive picks while still managing SKU variability, particularly in brownfield fulfillment sites looking for retrofits rather than full rebuilds. In this market context, RaaS already represents 60.30% of 2025 installations, which creates room for vendors that bundle robots, software updates, and maintenance into pay-per-pick or subscription contracts aligned with peak-season demand. Enterprise rollouts and platform deployments show the direction of travel: Zalando announced the rollout of up to 50 AI-powered Nomagic robots across its European fulfillment network for item-level picking and shoebox handling (March 2026), and Maersk deployed a goods-to-person robotic fulfillment center in Singapore using Hai Robotics systems and AMRs (April 2026). Both examples point to demand for end-to-end solutions that integrate storage, mobility, and picking.
Software-defined picking also broadens addressable SKU sets by reducing reliance on per-item training and by improving exception handling, which is especially relevant in grocery and FMCG where deformables and strict first-pick KPIs have constrained automation. Ongoing technology progress and operational learning cycles create space for providers that can demonstrate fast onboarding of new items, provide robust safety validation for collaborative applications, and coordinate orchestration with WES/WMS across heterogeneous fleets. With Europe moving toward a dual compliance environment for machinery safety and AI obligations, vendors that can productize compliance artifacts, including risk assessment, logging, cybersecurity, and update governance, have a practical differentiator for multinational deployments, particularly as mobile AMR-based piece picking extends beyond pilots into larger fleet footprints.
Recent Industry Developments in Piece Picking Robots Market
- February 2026: Berkshire Grey launched the Scoop robotic trailer unloader to automate unloading in high-variability dock environments. By addressing one of the most labor-intensive and safety-sensitive inbound workflows, the launch expands automation scope beyond picking stations and supports end-to-end material flow automation for large parcel and warehouse operators.
- November 2025: RightHand Robotics launched RightPick One, a more compact, lower-cost piece-picking system. The product move targets adoption in space-constrained sites and provides a simpler starting point for operations that want standardized cells before scaling to larger fleets or higher-SKU complexity.
- October 2024: Berkshire Grey released the V3 Put Wall for automated order consolidation. This supports higher-throughput sortation and packing workflows and complements robotic picking by reducing downstream manual touches at the final consolidation stage.


Piece Picking Robots Market Report Scope and Research Methodology
Market Definition and Coverage
This market covers revenue generated from robots designed to identify, grasp, and place individual items in warehouse and distribution operations, typically using vision guidance and end-of-arm gripping. We size the market at the point a system is sold or a service contract starts.
Scope exclusions: We exclude case-level palletizing robots, agricultural harvesting robots, and lab-scale micro pick-and-place systems from this market count.
Segments Covered in This Report
-
By Type of Robot
- Collaborative
- Fixed-Arm
- Mobile Piece-Picking AMR
- Others
-
By Component
- Hardware
- Software
- Services
-
By End-User Industry
- E-commerce / Retail Fulfilment Centres
- Pharmaceutical & Healthcare
- Grocery and FMCG
- 3PL / Parcel Logistics
- Others
-
By Payload Capacity
- Up to 5 kg
- 5-10 kg
- Above 10 kg
-
By Deployment Model
- Capital Purchase (CapEx)
- Robots-as-a-Service (RaaS)
-
By Geography
-
North America
- United States
- Canada
- Mexico
-
South America
- Brazil
- Argentina
- Colombia
- Rets of South America
-
Europe
- Germany
- United Kingdom
- France
- Italy
- Spain
- Rest of Europe
-
Asia
- China
- Japan
- South Korea
- India
- Singapore
- Rest of Asia
-
Middle East and Africa
- Saudi Arabia
- United Arab Emirates
- South Africa
- Rest of Middle East and Africa
-
North America
Data Sources, Market Sizing, and Validation
Desk Research
Desk work is used to set the market frame before we start modeling numbers. We leaned on public, non-paywalled sources such as International Federation of Robotics releases, US Census Bureau trade and manufacturing series, Eurostat industrial statistics, UN Comtrade import and export tables for robotics related HS codes, and US Patent and Trademark Office patent search outputs for vision and gripping themes.
On top of that, we reviewed company filings, investor presentations, product catalogs, and reputable logistics automation coverage to understand typical system configurations and how pricing is packaged. Where needed, we also used paid subscriptions for company financials and intelligence, news and financials, patent databases, and an import and export shipment-level database to sanity-check demand signals. The desk sources listed here are illustrative, and many other public and paid references were used for data collection, validation, and clarification.
Primary Interviews and Surveys
Primary work was used to confirm what is actually being bought for piece picking and what gets counted as a separate automation line item. We spoke with robot integrators, warehouse automation teams, component suppliers (vision, grippers, controllers), and end users in retail, e-commerce fulfillment, and 3PL operations to validate adoption pace, typical deal structures (capex sale versus service), and practical utilization levels across regions.
Distribution of primary research fieldwork respondents
| Company type | Respondent position | Region |
|---|---|---|
| Top tier: 27% | CXOs: 12% | APAC: 50% |
| Mid tier: 59% | Functional/Unit leaders: 30% | EMEA: 30% |
| Smaller Players: 14% | Managers: 58% | Americas: 20% |
Market-Sizing & Forecasting
Our main model uses a demand-pool view where warehouse throughput growth and automation penetration are translated into deployable picking capacity, and then converted into annual revenues using blended system pricing. To keep it grounded, totals are corroborated with selective bottom-up approximations, such as integrator revenue sampling, installed-base additions inferred from public announcements, and a check using sampled average selling price times estimated unit shipments.
Inputs that matter in this market include e-commerce order growth and SKU complexity, labor availability and wage pressure in warehouses, the share of facilities running goods-to-person or AMR-enabled workflows, average robot picks per hour achieved in production, and typical attachment rates for vision and gripper upgrades. Where gaps appear in bottom-up checks (for example, private company revenues or bundled pricing), we fill them with ranges agreed during interviews and then narrow them using region-level deployment realities. For forecasting, we used scenario analysis supported by an exponential smoothing layer on the key demand drivers, and then aligned the final curve with what operators and integrators expect for rollout timing and ramp-up delays.
Data Validation & Update Cycle
Outputs are cross-checked against independent signals such as industrial robot shipment trends, warehouse capex commentary, and automation adoption indicators, and then reviewed for obvious mismatches by geography and end-use behavior. If a segment shows an unusual jump or drop, the assumptions are re-opened, and experts are re-contacted to confirm whether it was driven by pricing, contract timing, or a one-time project. Before sign-off, another analyst reviews the logic, inputs, and calculations so any weak links are caught early.
Reports are refreshed annually, and interim updates are made when material events shift demand or pricing expectations. Before delivery, we do a fresh pass on the key assumptions so clients receive the most current view available at that time.
Mordor Intelligence's Piece Picking Robots Market Sizing Compared With Other Published Estimates
Published market sizes for piece picking robots can look far apart, even when they are describing similar warehouse use cases. The differences usually come from what each publisher counts as a piece picking robot sale, which revenue timing is used, and how fast adoption is assumed to expand across facilities.
Case-level palletizers are one of the biggest mix-ups, and that equipment sits outside Mordor Intelligence's scope for this market, which can pull some external totals higher even if unit economics look realistic. Other gaps come from whether estimates count only robot hardware versus including vision, grippers, software, and integration as part of the system value, and whether pricing is modeled as a one-time sale versus a service contract start, which shifts revenue between years.
Benchmark comparison
| Source | Market Size | Gaps in Research Methodology |
|---|---|---|
| Mordor Intelligence | USD 1.70 B (2025) | |
| Global Consultancy A | USD 1.15 B (2025) | Often constrained to robot arm hardware shipments and a narrower definition of piece picking, with limited inclusion of vision, grippers, and integration value that buyers typically pay for as part of deployed cells. |
| Industry Association B | USD 2.35 B (2025) | Can expand the scope to adjacent warehouse automation like case handling and palletizing, and may apply aggressive average selling prices without separating full-system deployments from partial upgrades. |
The table shows that the spread is mostly explained by scope and revenue capture timing, not by a disagreement that robots are being adopted quickly. By keeping the unit of analysis tied to deployed piece-level picking systems and checking pricing and adoption assumptions with real operators, we arrive at a market value that is traceable to clear inputs and repeatable steps.


Key Questions Answered in the Report
What is the current piece-picking robots market size and growth outlook?
The market recorded USD 2.58 billion revenue in 2026 and is on track to reach USD 20.78 billion by 2031, registering a 51.78% CAGR.
Which segment leads the piece-picking robots market share today?
Collaborative robots held 45.40% revenue share in 2025, benefitting from safe human-robot collaboration in mixed workflows.
Why is Asia-Pacific growing faster than other regions?
Aging workforces, rising wages, and high e-commerce penetration push Asia-Pacific to a 54.9% CAGR, the highest among all regions.
How is Robots-as-a-Service changing procurement strategies?
RaaS shifts automation from capex to opex, already accounting for 60.30% of 2025 deployments and letting firms scale fleets during peak demand without buying hardware outright.
What technical hurdle most restricts grocery automation?
Current grippers still struggle with deformable items, keeping success rates around 75–80% and limiting adoption where retailers require near-perfect first-pick accuracy.
Page last updated on:





