Market Overview
| Study Period | 2020 - 2031 |
|---|---|
| Forecast Data Period | 2026 - 2031 |
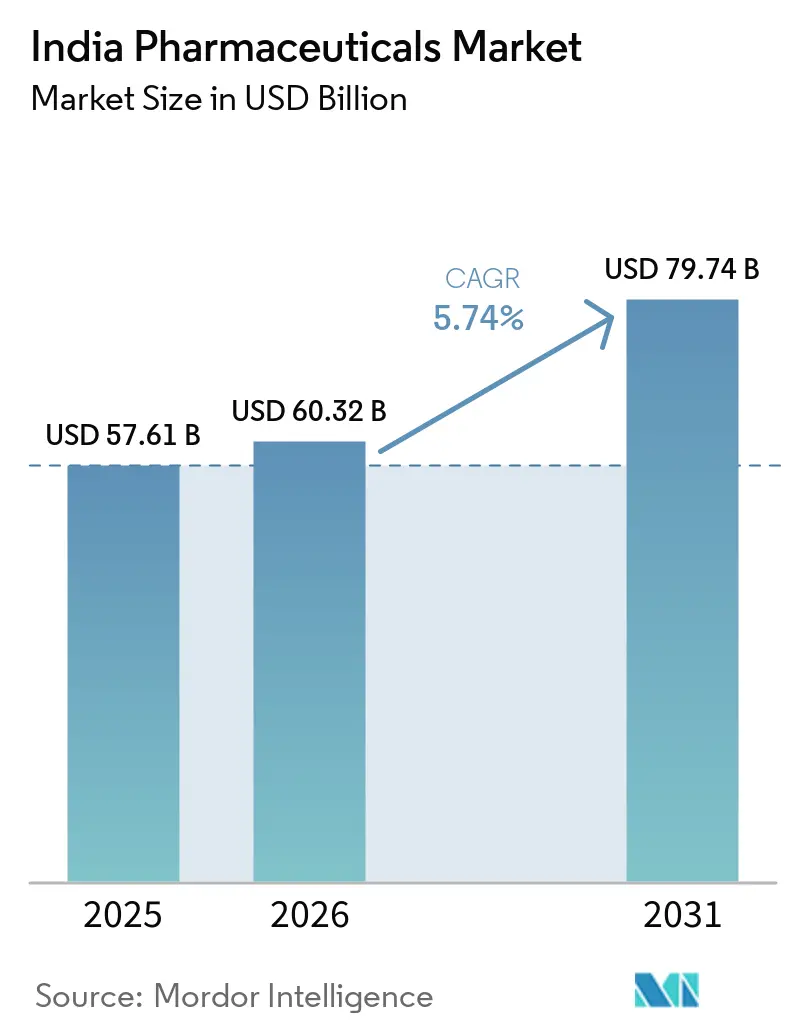
| Base Year Market Size (2025) | USD 57.61 Billion |
| Market Size (2026) | USD 60.32 Billion |
| Market Size (2031) | USD 79.74 Billion |
| Growth Rate (2026 - 2031) | 5.74% CAGR |
| Market Concentration | Low |
Major Players *Disclaimer: Major Players sorted in no particular order Image © Mordor Intelligence. Reuse requires attribution under CC BY 4.0. | |
India Pharmaceuticals Market Analysis by Mordor Intelligence
The India Pharmaceuticals Market size is projected to be USD 57.61 billion in 2025, USD 60.32 billion in 2026, and reach USD 79.74 billion by 2031, growing at a CAGR of 5.74% from 2026 to 2031.
The growth curve is underpinned by patent expiries that widen the generic pipeline, government production-linked incentives that bolster active pharmaceutical ingredient capacity, and a rapid rise in chronic diseases that ties patients to multi-year therapy plans. Anti-infectives continue to dominate day-to-day prescribing, yet oncology volumes outpace every other therapeutic class as biosimilar approvals and state-funded cancer schemes remove affordability barriers. Parallel policy shifts such as outcome-based procurement in private hospitals reward manufacturers that provide real-world evidence, while Central Drugs Standard Control Organisation's e-pharmacy rules legitimize home delivery and reinforce the “phygital” loop that links doctors, pharmacies, and digital health IDs. Competitive intensity stays moderate, creating white space for mid-tier producers that specialize in backward-integrated generics or value-added biosimilars.
Key Report Takeaways
- Anti-infectives led the therapeutic portfolio with 34.11% of India pharmaceuticals market share in 2025, whereas oncology is forecast to post the fastest 8.22% CAGR through 2031.
- Prescription drugs captured 61.26% of revenue in 2025, but over-the-counter products are set to expand at a 7.24% CAGR as self-medication gains ground.
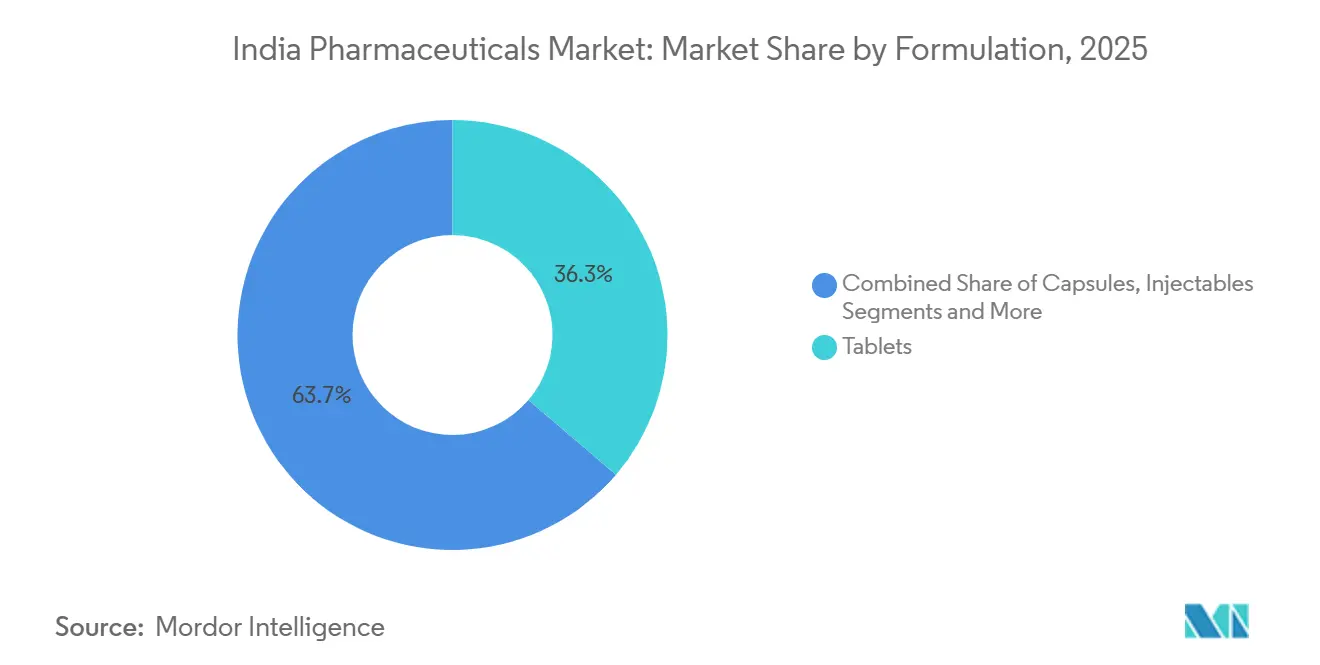
- Tablets accounted for 36.25% of formulation revenue in 2025, while injectables recorded the quickest 6.98% CAGR as biologics scaled up.
- Oral accounted for 74.33% of route of administration revenue in 2025, while inhalational record the quickest 9.13% CAGR.
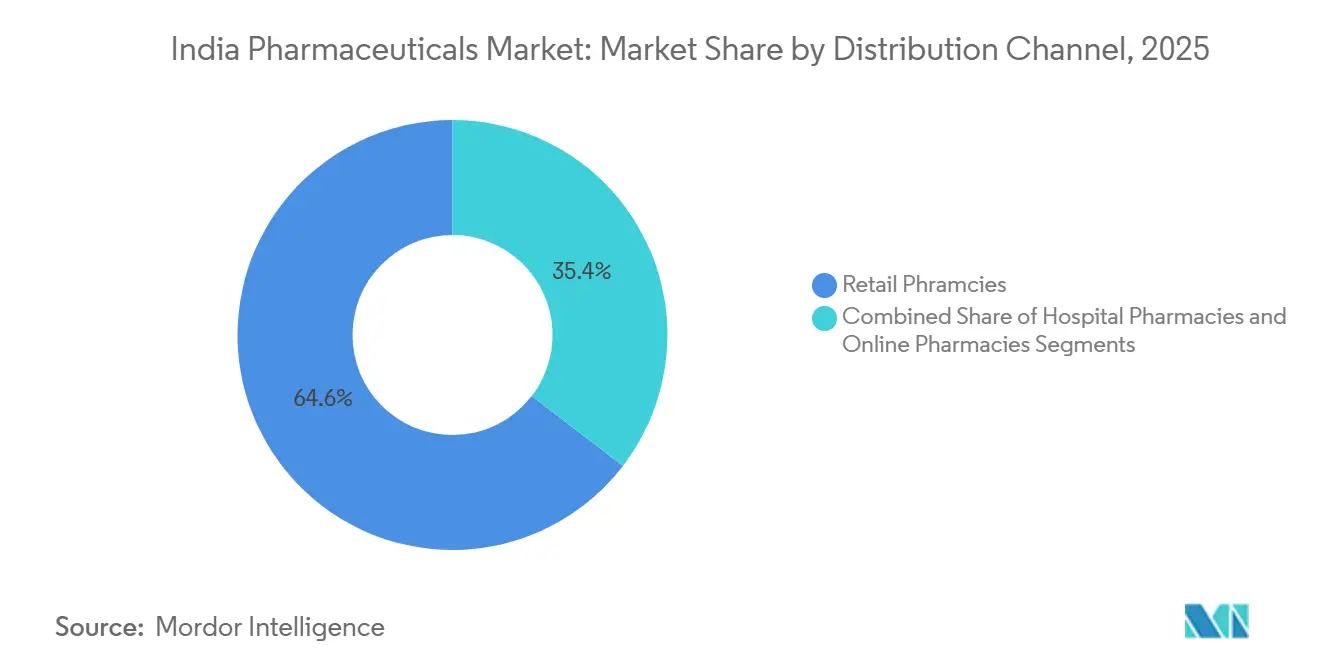
- Retail pharmacies accounted for 64.57% of overall sales in 2025, while online pharmacies are projected to grow at a 9.45% CAGR on the back of favorable e-pharmacy guidelines.
- West India retained 32.24% of overall sales in 2025, although South India is projected to grow at a 7.27% CAGR.
Note: Market size and forecast figures in this report are generated using Mordor Intelligence’s proprietary estimation framework, updated with the latest available data and insights as of January 2026.
India Pharmaceuticals Market Trends and Insights
Drivers Impact Analysis*
| Driver | (~) % Impact on CAGR Forecast | Geographic Relevance | Impact Timeline |
|---|---|---|---|
| Patent-cliff of legacy blockbusters fuels generic penetration | +1.2% | National, with export spillover to US and EU | Medium term (2-4 years) |
| Government PLI schemes accelerating domestic API & formulation capacity | +1.4% | National, concentrated in Gujarat, Telangana, Andhra Pradesh | Long term (≥4 years) |
| Rapid chronic-disease incidence (diabetes, CVD) expands long-term demand | +1.6% | National, higher prevalence in urban metros and Tier-2 cities | Long term (≥4 years) |
| Pay-for-performance tendering by large hospital chains | +0.6% | National, early adoption in Delhi-NCR, Mumbai, Bengaluru | Medium term (2-4 years) |
| AI-enabled drug-repurposing hubs in Hyderabad & Bengaluru | +0.4% | National, with licensing to global partners | Long term (≥4 years) |
| Rise of "phygital" e-pharmacy–doctor ecosystems improving adherence | +0.8% | National, accelerated in Tier-1 and Tier-2 cities | Short term (≤2 years) |
| Source: Mordor Intelligence | |||


Patent-Cliff of Legacy Blockbusters Fuels Generic Penetration
Blockbuster molecules that lost exclusivity between 2024 and 2026 created a USD 4 billion annual window for Indian generic makers. Sun Pharmaceutical captured 18% domestic share within six months of launching three oncology generics in 2025, while Dr. Reddy’s filed 12 first-to-file abbreviated new drug applications in the United States for 2026 expiries. Contract development and manufacturing organizations compress filing timelines from 36 to 18 months by bundling bioequivalence and dossier services. Biosimilar rivalry narrows the opportunity because Biocon Biologics seized 22% of trastuzumab prescriptions by mid-2025. The competitive clock therefore pushes firms to lock in scale advantages before biosimilars cannibalize adjacent small-molecule volumes.
Government Production-Linked Incentives Accelerate Domestic API & Formulation Capacity
The production-linked incentive program disbursed INR 6,800 crore (USD 817 million) in April 2024 underwriting 53 greenfield fermentation and chemical-synthesis projects.[1]IBEF, “US$ 815.5 Million (Rs. 6,800 Crores) Disbursed to Beneficiaries of the PLI Scheme in FY24: DPIIT Secretary,” IBEF, ibef.org Laurus Labs alone pledged INR 5,000 crore (USD 601 million) for antiretroviral and antidiabetic intermediates that target 40% self-sufficiency by 2027.[2]VIS News Service, “Laurus Labs to Invest Rs. 5,000 Crore in AP,” Vizag Industrial Scan, viscan.in Aurobindo Pharma revived domestic penicillin-G output, trimming Chinese dependency by 30%. Yet 18% of approved facilities missed 2025 milestones because of land acquisition and environmental hurdles, highlighting execution risk. Mid-size players such as Divi’s and Piramal use the incentive to back-integrate into value-added intermediates and cushion raw-material volatility.
Rapid Chronic-Disease Incidence Expands Long-Term Demand
In 2024, India reported 89.8 million adults living with diabetes, a figure projected to surge to 156.7 million by 2050.[3]International Diabetes Federation, “India Country Data,” Diabetes Atlas, diabetesatlas.org Cardiovascular disease cases reached 64 million in 2024, driven by hypertension in working-age populations. Long-term therapy needs lift anti-diabetic, statin, and antihypertensive volumes by double digits each year. Cipla’s chronic-care revenue grew 19% in fiscal 2025, well ahead of its acute portfolio. Ayushman Bharat reimbursement lowers out-of-pocket spending and raises adherence, though coverage lags in metro clusters with fragmented private insurance.
Pay-for-Performance Tendering by Large Hospital Chains
Apollo Hospitals and Fortis Healthcare introduced outcome-linked contracts in 2024 that tie up to 20% of payments to clinical metrics such as readmissions. Zydus Lifesciences secured a three-year Apollo deal by embedding adherence tracking in electronic medical records. Early adopters report 12% to 18% lower total care costs, a lever that could mainstream the model nationwide. Smaller firms struggle to fund data generation and risk losing institutional share. Although fewer than 10% of hospital tenders follow this structure, performance evidence is already nudging procurement policy reviews in top hospital chains.
Restraints Impact Analysis*
| Restraint | (~) % Impact on CAGR Forecast | Geographic Relevance | Impact Timeline |
|---|---|---|---|
| Frequent retail price caps under NLEM revisions squeeze margins | -0.8% | National, affecting all manufacturers | Short term (≤2 years) |
| Compliance gaps with revised Schedule M cGMP audits | -0.5% | National, concentrated in smaller facilities | Medium term (2-4 years) |
| Delay in patent linkage system hampers innovative drug launches | -0.3% | National, deterring multinational R&D investment | Long term (≥4 years) |
| Reduced Chinese intermediate supply optionality drives cost volatility | -0.6% | National, acute for cephalosporins and macrolides | Medium term (2-4 years) |
| Source: Mordor Intelligence | |||
Frequent Retail Price Caps Under NLEM Revisions Squeeze Margins
The National Pharmaceutical Pricing Authority added 34 formulations to the essential-medicines list in 2024, trimming ceiling prices on key chronic therapies by up to 25%. Alkem Laboratories reported a 320-basis-point gross-margin contraction in fiscal 2025 after its lead antihypertensive moved under control. Eleven percent of Indian Pharmaceutical Alliance members rank price caps as their top profitability threat. The 18- to 24-month revision cycle clouds capital-planning decisions, nudging companies toward dermatology and ophthalmology niches that remain free of controls. Over time, this migration can erode economies of scale in mainstream chronic therapies.
Compliance Gaps with Revised Schedule M Audits
Stricter sterility and data-integrity rules took effect in January 2024, and 18% of inspected sites failed to meet the benchmark. J.B. Chemicals shut its Panoli plant for four months to fix FDA-flagged lapses, losing USD 22 million in export revenue. Mid-tier contract manufacturers lack the cash to modernize cleanrooms and electronic batch records, which accelerates consolidation. Injectables and ophthalmic lines bear the highest burden because continuous environmental monitoring is mandatory. Remediation costs of USD 6 million to USD 18 million per site represent a steep hurdle for firms with thin cash flows.
*Our forecasts treat driver/restraint impacts as directional, not additive. The impact forecasts reflect baseline growth, mix effects, and variable interactions.
Segment Analysis
By Therapeutic Area: Oncology Growth Outstrips High-Volume Segments
Oncology leads segment growth with an 8.22% CAGR through 2031 as biosimilar trastuzumab and rituximab gain rapid uptake under state cancer schemes. Anti-infectives held the largest 34.11% share in 2025, yet stewardship programs slow volume gains to 4.8% CAGR. Cardiovascular therapies account for 22% of revenue, supported by India pharmaceuticals market size expansion in urban hypertensive cohorts, while anti-diabetic drugs serve 101 million patients. Respiratory, gastrointestinal, and analgesic lines grow in the mid-single-digit range.
The oncology upswing mirrors 1.46 million new cancer diagnoses in 2024 and the National Cancer Grid’s outreach to 300 centers. Ayushman Bharat added 17 high-cost oncology drugs to its reimbursement list, cutting household spend by 55%. Anti-infective use is tempered by new over-the-counter restrictions on 39 antibiotics. Cardiovascular adherence improves because fixed-dose combinations simplify regimens; Cipla’s triple combo captured 14% share in 2025. Respiratory demand climbs as Delhi and Mumbai breach World Health Organization air-quality limits on most days.


By Drug Type: OTC Momentum Builds on Self-Medication and E-Pharmacy Reach
Prescription drugs contributed 61.26% of 2025 revenue, but OTC products record the quickest 7.24% CAGR amid looser scheduling and digital availability. CDSCO moved 12 molecules, including antihistamines, from prescription-only to OTC in 2024. Mankind Pharma’s consumer health line grew 23% in fiscal 2025, driven by cough and digestive remedies.
OTC penetration is strongest in Tier-2 cities where pharmacy density is high and India pharmaceuticals market size gains from rising disposable incomes. Sun Pharmaceutical’s OTC basket rose 18% in the same period. Price pressure emerges because supermarkets and e-commerce demand deep discounts. Prescription drugs remain dominant in chronic care and inpatient oncology, where insurance frameworks reward physician oversight. Patented molecules grow at 6.8% CAGR on biosimilar adoption, while generics advance 5.4% under price-cap strain.
By Formulation: Injectables Rise on Biologics and Sterile Capacity
Injectables chart a 6.98% CAGR through 2031, underpinned by PLI-funded sterile lines and biologics expansion. Tablets kept a 36.25% revenue share in 2025 but growth slows to 5.1% CAGR because price controls bite into flagship molecules. Capsules and syrups trail behind.
Laurus Labs opened a 50-million-vial plant in 2024, sharpening the focus on oncology injectables. Biocon Biologics expanded monoclonal capacity by 40% in 2025. Tablets continue to dominate anti-diabetic and cardiovascular care thanks to convenience and fixed-dose innovation. Capsules grow on probiotic and nutraceutical demand, while syrups lag because pediatric growth has flattened. CDSCO’s stricter aseptic norms raise the entry barrier for newcomers in injectables, concentrating India pharmaceuticals market share among manufacturers with proven cleanroom track records.
By Route of Administration: Inhalational Therapies Accelerate on Pollution-Driven Respiratory Burden
Oral drugs held 74.33% of 2025 sales because tablets and capsules remain the default for chronic conditions such as diabetes and hypertension. Inhalational products, however, are set to climb at a 9.13% CAGR to 2031 as asthma and COPD cases hit 37 million and 55 million in 2024, and Delhi overshot WHO PM₂.₅ limits on 274 days that year. Dry-powder inhalers already command 62% of the category, while Cipla’s Rotahaler platform pushed the firm’s respiratory line up 21% in fiscal 2025. Parenteral routes grow 6.2% on hospital use of oncology and biologic infusions, yet biosimilar price cuts keep margins tight.
National Health Mission deployment of 1,200 spirometers in 2024 raised COPD diagnoses 18%, accelerating inhaler uptake. GSK’s triple-combination inhaler secured 9% share within six months of its 2025 launch, showing the speed of respiratory innovation. Tablets still benefit from fixed-dose combos, Zydus’s triple antihypertensive holds 11% of its niche, and topical or transdermal formats trail at 4.7% CAGR because payers seldom reimburse them.
By Distribution Channel: Online Growth Outpaces Brick-and-Mortar
Online pharmacies are projected to post a 9.45% CAGR through 2031 as CDSCO rules and Ayushman Bharat integration normalize home delivery. Retail pharmacies still contributed 64.57% of 2025 revenue, a reflection of 850,000 outlets across India. Hospital pharmacies hold 28%.
PharmEasy and 1mg commanded a combined 55% share of online sales by mid-2025. Apollo Pharmacy’s omnichannel model links physical stores and an app, capturing 18% online turnover. India pharmaceuticals market size in digital channels expands fastest in Tier-1 cities where broadband speeds top 50 Mbps, yet Tier-2 growth accelerates as 5G coverage extends to 500 cities by 2026. Retail chains respond with loyalty programs and rapid-delivery models, but margin pressure will intensify as subscription services lock customers into automatic refills.
Geographic Analysis
West India led with 32.24% of 2025 revenue thanks to Gujarat–Maharashtra clusters that drew INR 4,200 crore (USD 505 million) in PLI funds by December 2025. South India is the fastest-growing at 7.27% CAGR through 2031, powered by API plants in Telangana and Andhra Pradesh plus diabetes prevalence above 12% in Tamil Nadu and Kerala. Hyderabad Pharma City added 12 units and INR 8,500 crore (USD 1.02 billion) in investment in 2024-2025, while Aurobindo’s penicillin-G site reduced reliance on Chinese inputs by 28%. North India holds 26% share on Delhi-NCR’s high per-capita spend and Uttar Pradesh’s scale, with severe smog lifting inhaler sales 19% in 2024.
East and Northeast regions together capture 15% but face logistics costs 12–18% above the national norm. Ayushman Bharat enrollment above 65% in West Bengal and Odisha is pushing reimbursed demand up 9% yearly. Karnataka’s 25% capital subsidy for biosimilar plants drew INR 2,400 crore (USD 289 million) of new money in 2024-2025, signaling that targeted state incentives will keep the South at the front of the growth curve.
Competitive Landscape
The India pharmaceuticals market remains moderately fragmented because the top five firms control under 30% of revenue. Sun Pharmaceutical runs a diversified chronic-care and specialty mix, whereas Cipla dominates respiratory therapies through inhaler leadership. Biocon Biologics captured 22% of trastuzumab doses within 18 months of launch, illustrating the disruptive speed of biosimilar entries.
Contract development outfits such as Syngene and Piramal Pharma Solutions win high-margin discovery and clinical-supply contracts from multinationals that seek cost efficiency. Domestic patent filings climbed 18% in 2024 and made up 42% of total applications, signaling rising local innovation. CDSCO cleared 127 new drug applications in 2024, 38% of which were biosimilars, underscoring regulatory openness to advanced modalities. However, the absence of patent linkage discourages large foreign trials, giving domestic companies an innovation edge at lower capital thresholds.
India Pharmaceuticals Industry Leaders
Sun Pharmaceutical Industries Limited
Cipla Pharmaceuticals
Dr. Reddy’s laboratories
Torrent Pharmaceuticals
Cipla Ltd.
- *Disclaimer: Major Players sorted in no particular order

Recent Industry Developments
- December 2025: Novo Nordisk introduced Ozempic, pricing the 0.25 mg dose at USD 24.35 per week to address escalating diabetes and obesity needs.
- December 2025: Emcure Pharmaceuticals commenced nationwide sales of Poviztra, a semaglutide injection formulated for weight management.
- December 2025: Cipla launched Afrezza inhaled insulin after securing CDSCO approval, offering a needle-free alternative for glycemic control.
- August 2025: Dr. Reddy’s rolled out Colozo (linaclotide) for chronic constipation, broadening its gastro portfolio.


Research Methodology Framework and Report Scope
Market Definitions and Key Coverage
Our study views the Indian pharmaceuticals market as all human-use, prescription and over-the-counter medicines, whether small-molecule, biologic or vaccine, manufactured or imported for commercial sale within India in finished-dosage form. Active pharmaceutical ingredient exports, medical devices, veterinary drugs and nutraceuticals are kept outside this boundary.
Scope Exclusions: Inputs such as bulk APIs, diagnostics, and medical devices are not counted in the market value to avoid double accounting.
Segmentation Overview
- By Therapeutic Area
- Anti-infectives
- Cardiovascular
- Anti-diabetic
- Respiratory
- Oncology
- Gastrointestinal
- Pain / Analgesics
- Others
- By Drug Type
- Prescription Drugs
- Patented Drugs
- Generic Drugs
- OTC Drugs
- Prescription Drugs
- By Formulation
- Tablets
- Capsules
- Injectables
- Syrups / Suspensions
- Others
- By Route of Administration
- Oral
- Inhalational
- Parental
- Others
- By Distribution Channel
- Hospital Pharmacies
- Retail Pharmacies
- Online Pharmacies
- By Region
- North India
- West India
- South India
- East and Northeast India
Detailed Research Methodology and Data Validation
Primary Research
Mordor analysts interviewed procurement heads at hospital chains, senior marketing managers at leading generic producers, e-pharmacy category leads, and regulators across four zones. Guided discussions verified channel mark-ups, therapy penetration, and expected policy trajectories, while short surveys with retail chemists gauged stocking patterns in Tier-2 and Tier-3 towns. Insights from these interactions filled data gaps and shaped the assumptions embedded in our forecast model.
Desk Research
We first mapped the demand pool through freely available tier-1 sources such as the Ministry of Chemicals & Fertilizers annual output tables, MOSPI national accounts, CDSCO approval logs, and Directorate General of Commercial Intelligence export statistics, complemented by association yearbooks from IDMA and Pharmexcil. Company filings, investor decks, reputable business press and academic journals supplied pricing ranges, therapy mix and channel insights. Subscription data sets, including D&B Hoovers for manufacturer financials and Dow Jones Factiva for transaction news, helped us cross-check volumes and spot abnormal swings. These references are illustrative, not exhaustive; many additional records were reviewed for clarification and validation purposes.
Market-Sizing & Forecasting
A top-down construct converts national drug sales, invoices and trade data, into ex-manufacturer value, which is then corroborated with selective bottom-up checks such as sampled average selling price multiplied by audited plant dispatch volumes for major firms. Key variables driving the model include chronic-therapy prescription counts, average retail mark-ups, Jan Aushadhi outlet additions, import share of high-value biologics, capacity utilization in formulation plants, and INR-USD exchange trends. Multivariate regression links these variables to annual sales, while scenario analysis adjusts for policy shocks like price-cap revisions. Data voids on smaller private players are bridged using peer margin proxies and capacity heuristics before final triangulation.
Data Validation & Update Cycle
Outputs pass a two-step analyst review that flags anomalies against historical series, IQVIA quarterly panels and corporate guidance. We refresh every twelve months and trigger interim updates for material events such as GST rate changes or large recalls. A final sense-check is run before publication to ensure clients receive the latest view.
Why Our India Pharmaceutical Market Analysis - Industry Growth, Size & Forecast Report Baseline Commands Reliability
Published estimates often differ because publishers choose divergent scope, price-point assumptions, and refresh rhythms. Model boundaries, whether they include veterinary drugs, bulk APIs or trade margins, can swing totals by billions.
Key gap drivers in this market are (i) inclusion of manufacturing value-added versus ex-factory sales, (ii) treatment of hospital procurement discounts, (iii) currency conversion dates, and (iv) refresh cadence that may miss recent NLEM price ceilings. Mordor's clearly defined finished-dosage scope, annual refresh and dual validation process limit these distortions.
Benchmark comparison
| Market Size | Anonymized source | Primary gap driver |
|---|---|---|
| USD 66.66 B (2025) | Mordor Intelligence | - |
| USD 39.82 B (2024) | Global Consultancy A | Excludes OTC and vaccine revenues; uses FY22 exchange rate |
| USD 53.29 B (2025) | Regional Consultancy B | Omits trade margins and hospital discounts not netted |
| USD 61.36 B (2024) | Industry Association C | Mixes bulk API exports with domestic formulations |
In short, our disciplined scope choice, variable-level cross-checks and transparent update cycle give decision-makers a balanced, reproducible baseline they can trust for strategic planning.


Key Questions Answered in the Report
How large is the India pharmaceuticals market in 2026?
The market is valued at USD 60.32 billion in 2026 and is projected to reach USD 79.74 billion by 2031.
Which therapeutic class is growing fastest in India?
Oncology records the quickest 8.22% CAGR through 2031, buoyed by biosimilar uptake and state cancer reimbursements.
What drives the surge in online pharmacy sales?
CDSCO e-pharmacy rules, rising smartphone use, and integration with Ayushman Bharat Digital Mission health IDs fuel a 9.45% CAGR for online channels.
How do price caps affect manufacturer margins?
Additions to the National List of Essential Medicines cut ceiling prices by up to 25% and can compress gross margins by 200–400 basis points.
Why is injectable production expanding?
Production-linked incentives fund new sterile capacity and biologics manufacturing, resulting in a 6.98% CAGR for injectables through 2031.
What is the outlook for chronic-disease drugs?
Rising diabetes and cardiovascular cases lift long-term demand, causing manufacturers with chronic-care portfolios to outgrow acute segments.
Page last updated on:


