Pharmaceutical TIC Market Size and Share
Market Overview
| Study Period | 2020 - 2031 |
|---|---|
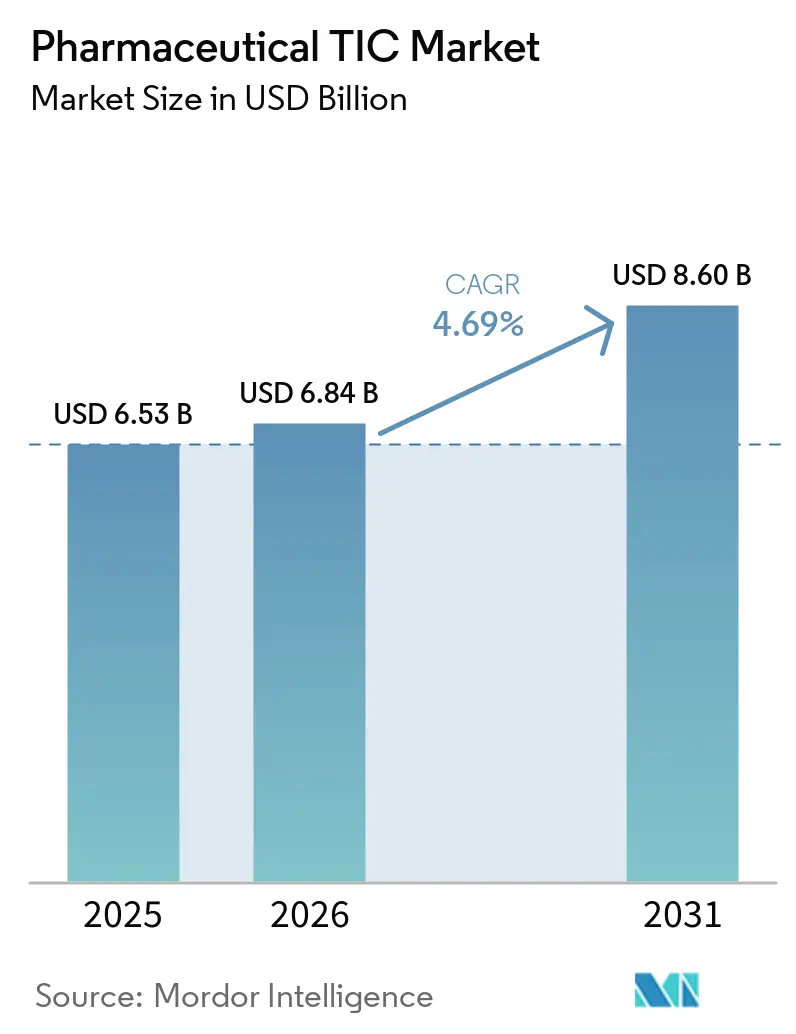
| Market Size (2026) | USD 6.84 Billion |
| Market Size (2031) | USD 8.60 Billion |
| Growth Rate (2026 - 2031) | 4.69% CAGR |
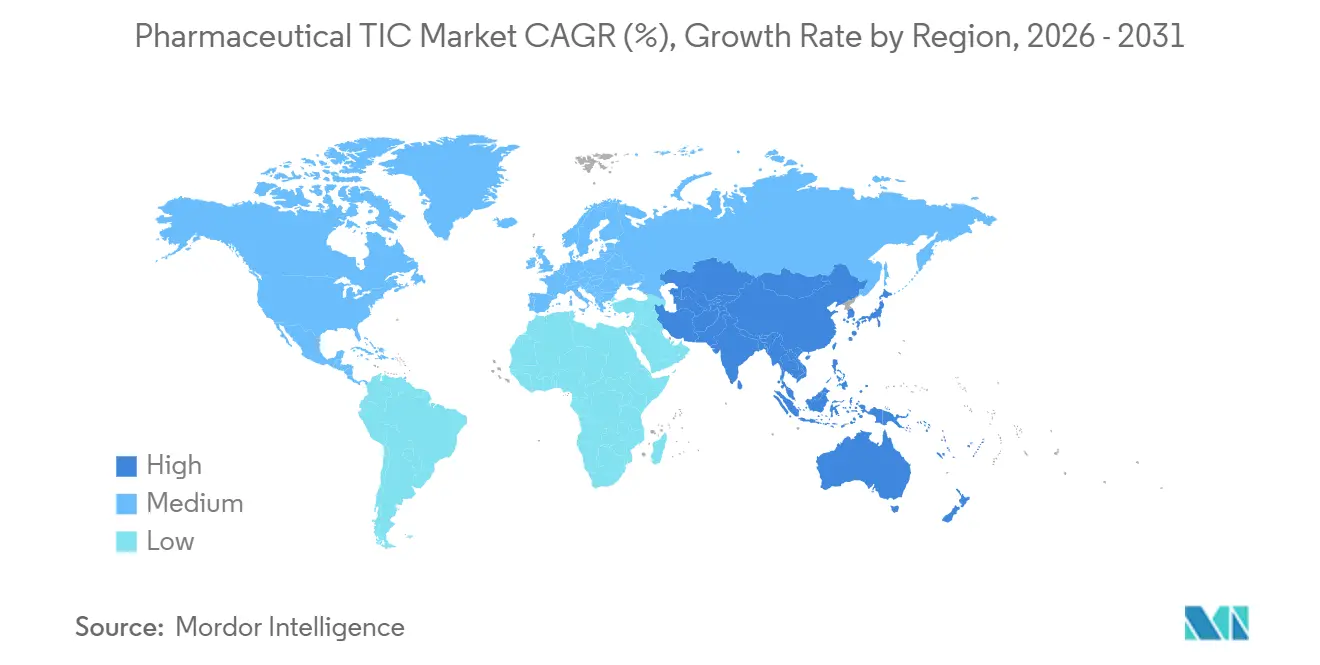
| Fastest Growing Market | Asia Pacific |
| Largest Market | North America |
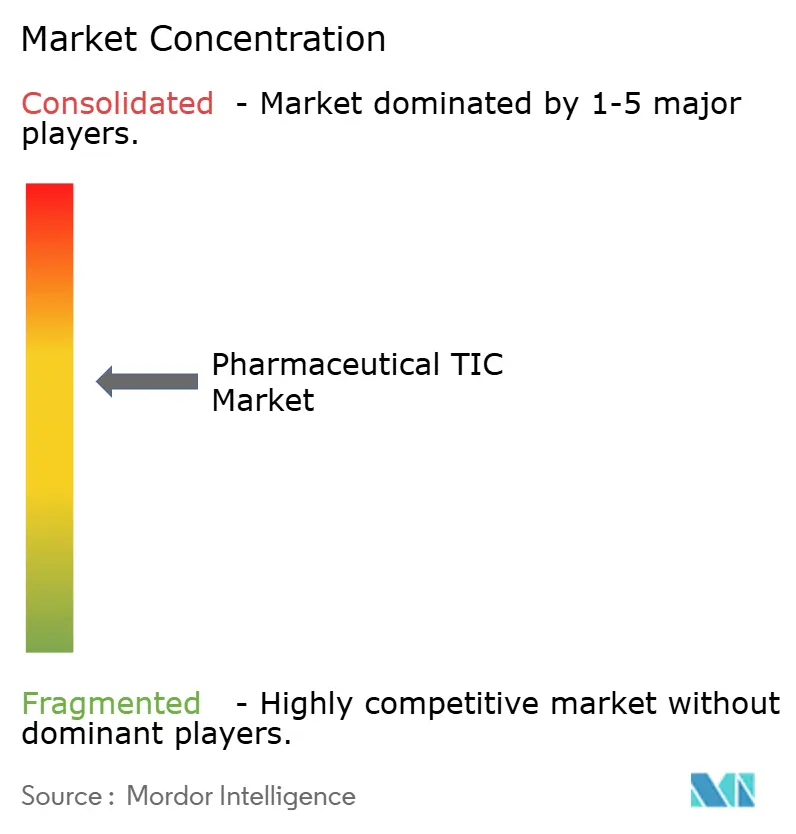
| Market Concentration | Medium |
Major Players *Disclaimer: Major Players sorted in no particular order Image © Mordor Intelligence. Reuse requires attribution under CC BY 4.0. | |
Pharmaceutical TIC Market Analysis by Mordor Intelligence
The pharmaceutical TIC market was valued at USD 6.53 billion in 2025 and is estimated to grow from USD 6.84 billion in 2026 to USD 8.60 billion by 2031, at a CAGR of 4.69% from 2026 to 2031. Heightened regulatory vigilance, evidenced by 112 FDA warning letters in 2025, is steering companies toward continuous, third-party quality oversight rather than episodic internal audits.[1]United States Food and Drug Administration, “Warning Letters and Untitled Letters to Pharmaceutical Companies,” FDA.GOV Europe’s updated GMP Annex 1 rules on contamination control have further broadened demand for environmental monitoring and aseptic-process inspections, while the FDA PreCheck pilot launched in February 2026 validates remote-first audit models and digital twins. Simultaneously, manufacturers shifting to continuous manufacturing and green chemistry seek TIC partners capable of calibrating process analytical technology sensors and verifying carbon-reduction claims. Together, these factors are moving the pharmaceutical testing, inspection, and certification (TIC) market toward predictive quality assurance embedded within production workflows.
Key Report Takeaways
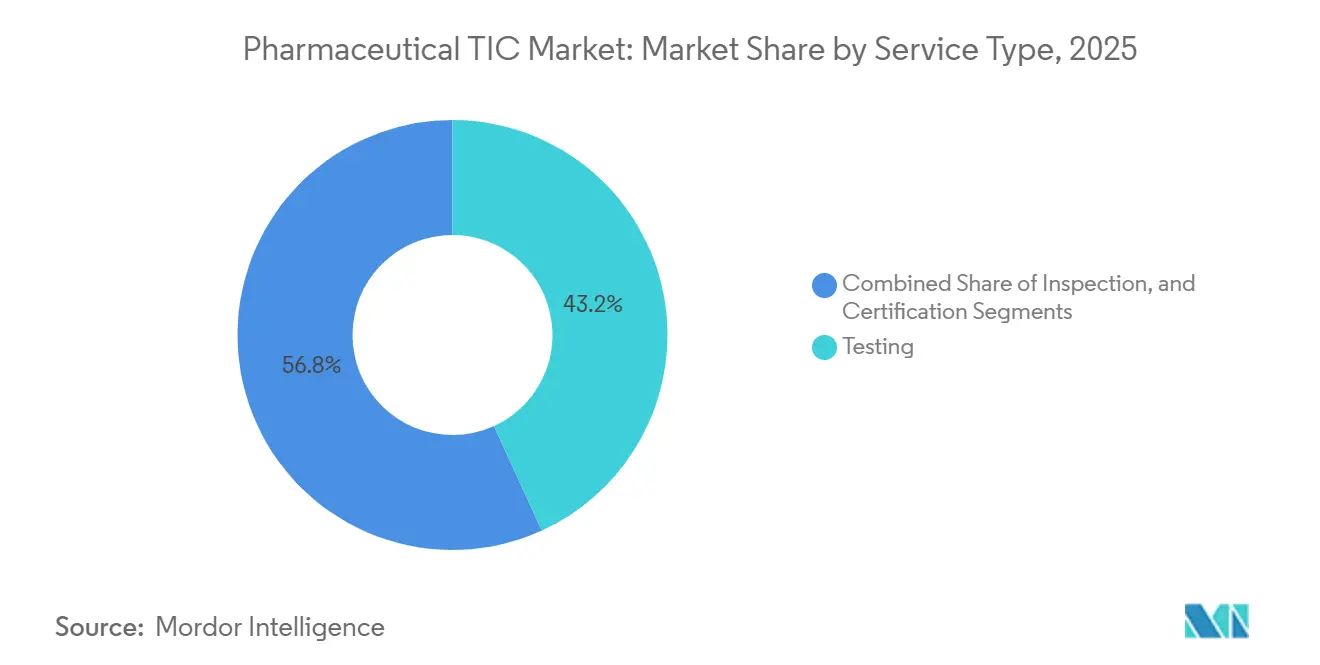
- By service type, testing held 43.19% of pharmaceutical TIC market share in 2025, whereas certification is set to grow the fastest at a 4.71% CAGR through 2031.
- By sourcing type, outsourced models commanded 64.22% of pharmaceutical TIC market share in 2025 and are advancing at a 5.98% CAGR through 2031.
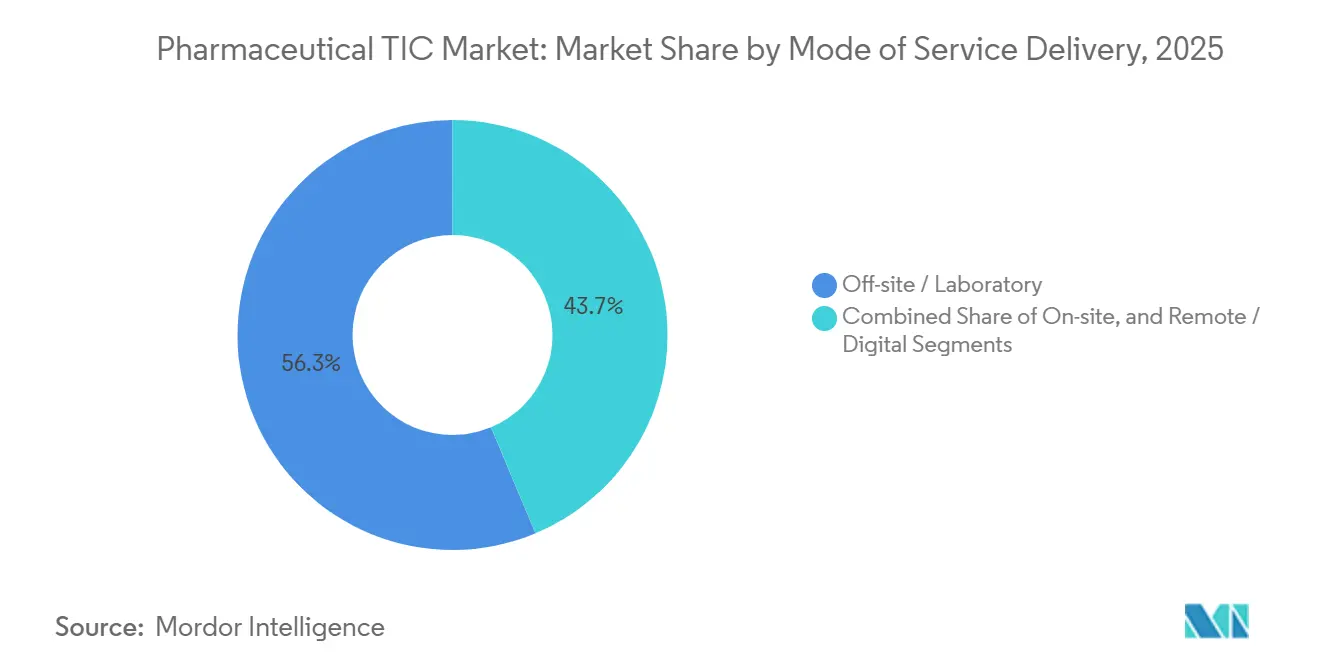
- By mode of service delivery, off-site laboratory work captured 56.31% of pharmaceutical TIC market share in 2025, while remote and digital platforms lead growth at a 4.86% CAGR.
- By geography, North America contributed 34.41% of pharmaceutical TIC market share in 2025, but Asia-Pacific is forecast to expand the quickest at a 5.54% CAGR through 2031.
Note: Market size and forecast figures in this report are generated using Mordor Intelligence’s proprietary estimation framework, updated with the latest available data and insights as of January 2026.
Global Pharmaceutical TIC Market Trends and Insights
Drivers Impact Analysis*
| Driver | (~) % Impact on CAGR Forecast | Geographic Relevance | Impact Timeline |
|---|---|---|---|
| Stringent Global GMP Enforcement | +1.2% | North America, Europe, Asia-Pacific | Long term (≥ 4 years) |
| Accelerating Biologics Pipeline | +1.0% | North America, Europe, Asia-Pacific | Medium term (2-4 years) |
| Rising Pre-approval Inspection Frequency | +0.8% | North America, Europe, India, China | Medium term (2-4 years) |
| Shift Toward Continuous Manufacturing | +0.7% | North America, Europe, Asia-Pacific | Long term (≥ 4 years) |
| Digital Twin Adoption for Remote Inspection | +0.5% | North America, Europe, Asia-Pacific | Medium term (2-4 years) |
| Green Chemistry Validation Mandates | +0.4% | Europe, North America | Long term (≥ 4 years) |
| Source: Mordor Intelligence | |||
Stringent Global GMP Enforcement
The FDA, in 2025, issued its highest number of warning letters in two decades, largely for data-integrity lapses and aseptic errors, prompting manufacturers to seek third-party validation of sterile-fill lines and electronic records.[2]United States Food and Drug Administration, “FDA Launches PreCheck Pilot Program for Pharmaceutical Manufacturing,” FDA.GOV The European Medicines Agency’s 2022 Annex 1 update imposed prescriptive contamination-control rules that now drive demand for routine clean-room certification across the region. WHO expanded prequalification to 87 sites by end-2025, each requiring biennial audits by approved testing, inspection, and certification (TIC) bodies. Early results from the FDA PreCheck pilot indicate inspection lead times are shrinking to 60 days when accredited TIC assurances are in place. Collectively, these moves embed external testing and certification into baseline pharmaceutical operations.
Accelerating Biologics Pipeline Requiring Complex Testing
The FDA cleared 16 biologics in 2024, with monoclonal antibodies dominating approvals, while the EMA authorized an additional 11 biosimilars the same year. Biologics demand advanced assays such as glycosylation profiling and host-cell protein quantification that few in-house labs possess. The 2024 revision of ICH Q5E pushed many manufacturers to revalidate methods via ISO/IEC 17025-accredited partners. Growing cell-and-gene therapy pipelines add vector potency and replication-competent virus testing to the services mix. As product portfolios fragment into niche and personalized medicines, contract laboratories with deep biologics expertise become indispensable allies.
Rising Pre-approval Inspection Frequency by US FDA and EMA
The FDA, in 2025, inspected 92% of NDA facilities before approval, versus 78% in 2020, compressing inspection windows to 90 days on average. The EMA mirrored this trend with a 22% jump in pre-approval site visits over 2023. Mutual recognition deals let agencies rely on each other’s findings, yet manufacturers still commission independent mock audits to prevent Form 483 observations that can stall launches by up to a year. Hybrid inspection models combining remote document review with shorter site visits further elevate demand for digital-readiness assessments.
Shift Toward Continuous Manufacturing in Pharma Plants
Eighteen FDA-approved solid-oral drugs used continuous lines in 2025 compared with nine in 2020, confirming the shift away from batch mode. Regulators now require validation of process-analytical-technology sensors and real-time data controls, services often outsourced to TIC firms versed in 21 CFR Part 11 compliance. Continuous workflows support real-time release testing, but only after external verification of sensor accuracy, statistical process control, and deviation management. Annual third-party audits of PAT systems are therefore becoming a baked-in operating cost for plants adopting continuous processes.
Restraints Impact Analysis*
| Restraint | (~) % Impact on CAGR Forecast | Geographic Relevance | Impact Timeline |
|---|---|---|---|
| Scarcity of Skilled Auditors in Emerging Markets | -0.6% | Asia-Pacific (excluding Japan), Middle East, Sub-Saharan Africa | Medium term (2-4 years) |
| High Cost of Advanced Analytical Instrumentation | -0.5% | Global, stronger in cost-sensitive regions | Short term (≤ 2 years) |
| Fragmented Regulatory Frameworks Across Middle East | -0.3% | Saudi Arabia, UAE, Turkey, Egypt | Medium term (2-4 years) |
| Cybersecurity Risks in Connected Lab Equipment | -0.2% | North America, Europe, Global | Short term (≤ 2 years) |
| Source: Mordor Intelligence | |||
Scarcity of Skilled Auditors in Emerging Markets
India’s CDSCO reported a 40% vacancy rate among inspectors in 2025, and 62% of Asia-Pacific labs cited hiring challenges for advanced biologics analysts.[3]Central Drugs Standard Control Organisation, “Pharmaceutical Inspector Vacancy Report 2025,” CDSCO.GOV.IN Limited training pipelines and talent migration into higher-paying pharma roles lengthen audit backlogs by 4 to 6 weeks. Leading TIC firms have responded with regional academies and university partnerships, yet tangible workforce growth is several years off, constraining rapid service expansion in high-growth geographies.
High Cost of Advanced Analytical Instrumentation
Ultra-high-performance liquid chromatography or TOF-MS units cost USD 300,000 to USD 1.2 million each, and biologic-specific LC-MS configurations can exceed USD 1.5 million. Small TIC labs in India, Brazil, and South Africa often lack financing for such outlays, limiting their participation in high-value biologics contracts. Equipment leasing programs offered by large vendors ease the burden but can inflate service pricing, slowing adoption among cost-sensitive manufacturers.
*Our forecasts treat driver/restraint impacts as directional, not additive. The impact forecasts reflect baseline growth, mix effects, and variable interactions.
Segment Analysis
By Service Type: Testing Commands Revenue, Certification Accelerates
Testing generated 43.19% of 2025 revenue, marking the largest pharmaceutical TIC market share among service types. Demand stems from complex assays for monoclonal antibodies and cell-and-gene therapies that require costly, specialized instrumentation, which is unavailable in many in-house labs. Certification, though smaller, is rising fastest at a 4.71% CAGR as firms pursue ISO 13485 and WHO prequalification to unlock exports. The pharmaceutical TIC market size linked to certification is expected to widen steadily alongside global mutual recognition agreements.[4]International Council for Harmonization, “ICH Q5E: Comparability of Biotechnological/Biological Products,” ICH.ORG
Margin pressure is sharper in inspection services as remote platforms shorten on-site work, yet specialized audits for continuous manufacturing and data integrity retain pricing power. Bundled multi-year certification contracts that combine ISO 13485, ISO 9001, and GDP audits position TIC providers for recurring revenue. Data-rich testing workflows also generate long-tail opportunities in analytics, enabling laboratories to advise on process optimization alongside compliance.


By Sourcing Type: Outsourcing Extends Reach
Outsourced arrangements accounted for 64.22% of 2025 revenue, underscoring industry preference for asset-light quality strategies. The model is expanding at a 5.98% CAGR because outsourcing shifts capital risk for laboratories costing USD 8 million or more onto TIC partners. For biologics, external labs already handle most glycan profiling and peptide mapping, locking in a substantial pharmaceutical TIC market size advantage for outsourced players.
In-house testing persists for high-volume, low-complexity assays but falters in biologics and continuous-manufacturing validation. Outsourcing also gives sponsors geographic agility, letting them tap local labs in India or China under overarching global contracts. With regulators embracing continuous data sharing, TIC providers offering round-the-clock virtual oversight further deepen client stickiness.
By Mode of Service Delivery: Remote Platforms Gain Ground
Off-site laboratory work accounted for 56.31% of revenue in 2025, thanks to centralized LC-MS and microbiology suites that deliver economies of scale. Yet remote and digital inspections, growing at 4.86% annually, are remaking compliance workflows as the FDA PreCheck program accepts secure real-time data feeds. Early adopters achieve shorter approval cycles, incentivizing broader uptake and increasing the pharmaceutical TIC market share for virtual-first providers.
On-site audits remain critical for clean-room certification and equipment qualification, especially in aseptic facilities. However, hybrid protocols reduce average site-visit days from five to two, nudging TIC firms toward subscription models that bundle continuous remote monitoring with limited physical verification. Labs that invest in secure data-sharing infrastructure and AI-driven anomaly detection are best placed to capture upcoming demand.
Geography Analysis
North America accounted for 34.41% of 2025 revenue as biologics clusters in Massachusetts, New Jersey, and North Carolina relied heavily on third-party validations. The region’s strict oversight, reinforced by 112 warning letters in 2025, has driven near-universal adoption of accredited testing across sterile-fill lines and electronic records. The 2026 PreCheck pilot further entrenches external audits through digital twins and real-time data streams. Canada and Mexico add incremental volume as both scale production for regional supply, creating new bids for WHO prequalification and export certificates.
Asia-Pacific is the fastest-growing area, advancing at a 5.54% CAGR through 2031, buoyed by India’s INR 150 billion (USD 12 million) production-linked incentives and China’s 48 biologic approvals in 2024.[5]National Medical Products Administration of China, “Biologics Approvals 2024,” NMPA.GOV.CN Indian facilities faced 87 FDA pre-approval inspections in 2025, up sharply from 2020, prompting widespread engagement of TIC firms for readiness checks. China’s push into trastuzumab and adalimumab biosimilars further lifts analytical demand, while Japan’s risk-based GMP regime prioritizes continuous-manufacturing audits. South Korea and Australia contribute niche volumes through export-oriented biologics and vaccine plants.
Europe maintains a sizable demand on the back of its 2022 EMA Annex 1 contamination-control rules. Germany, France, and the United Kingdom anchor biologics output that necessitates extensive charge-variant and potency testing. Although EU-US mutual recognition eases regulatory duplication, manufacturers still retain local TIC partners for cross-border assurance. The Middle East remains fragmented; Saudi Arabia aligns toward Vision 2030, while the UAE and Turkey operate distinct frameworks, boosting multi-jurisdiction consulting. South America and Africa presently contribute modest revenue but are investing in capacity to cut import reliance, setting the stage for greater TIC penetration after 2028.

Competitive Landscape
The market exhibits moderate concentration, with the top five providers holding a significant share of global revenue. Multinationals leverage ISO/IEC 17025 networks and recognition agreements to win large cross-regional contracts, yet face price pressure as digital audits slash on-site billables. Regional specialists in India, China, and Brazil gain share with faster turnaround and granular regulatory know-how, though limited capital curbs their entry into high-cost biologics assays.
Strategic thrusts concentrate on building cell-and-gene therapy capabilities, expanding into high-growth geographies, and investing in digital platforms that enable continuous monitoring. Recent moves include Charles River’s USD 485 million acquisition of Vigil Biosciences, Eurofins’ USD 19.4 million biologics lab in Hyderabad, and SGS’s five-year continuous-manufacturing validation deal with a multinational sponsor. These illustrate a pivot toward premium niches such as vector-potency testing and PAT sensor calibration.
Technology differentiation is accelerating; Bureau Veritas rolled out blockchain audit trails, and leading providers integrate AI anomaly detection into LIMS to satisfy 21 CFR Part 11 and EU Annex 11 data-integrity rules.[6]United States Food and Drug Administration, “Guidance for Industry: Continuous Manufacturing of Solid Oral Dosage Forms,” FDA.GOV Labs with positive FDA inspection histories, EMA-qualified person sign-off, or WHO accreditation command premium contracts. Disruptors offering purely virtual oversight via cloud dashboards are carving out space among digital-native biotechs that prefer subscription-based compliance.
Pharmaceutical TIC Industry Leaders
SGS SA
Eurofins Scientific SE
Bureau Veritas SA
TÜV SÜD AG
Intertek Group plc
- *Disclaimer: Major Players sorted in no particular order

Recent Industry Developments
- February 2026: The FDA launched the PreCheck pilot, which lets qualified plants secure inspections within 60 days, cutting the prior 90-day average and anchoring demand for accredited TIC validations.
- January 2026: SGS completed the USD 1.325 billion acquisition of Applied Technical Services, adding 85 U.S. facilities and more than 2,100 employees.
- November 2025: Bureau Veritas acquired Brazil-based Lab System Institute of Research and Testing, strengthening its Latin American presence.
- July 2025: Eurofins Scientific acquired Ascend Clinical for USD 89 million, reinforcing its bioanalytical footprint.


Global Pharmaceutical TIC Market Report Scope
The Pharmaceutical TIC Market Report is Segmented by Service Type (Testing, Inspection, and Certification), Sourcing Type (In-house, and Outsourced), Mode of Service Delivery (On-site, Off-site/Laboratory, and Remote/Digital), and Geography (North America, Europe, Asia-Pacific, Middle East, Africa, and South America). The Market Forecasts are Provided in Terms of Value (USD).
| Testing |
| Inspection |
| Certification |
| In-house |
| Outsourced |
| On-site |
| Off-site / Laboratory |
| Remote / Digital |
| North America | United States |
| Canada | |
| Mexico | |
| Europe | United Kingdom |
| Germany | |
| France | |
| Italy | |
| Rest of Europe | |
| Asia-Pacific | China |
| Japan | |
| India | |
| South Korea | |
| Rest of Asia-Pacific | |
| Middle East | Israel |
| Saudi Arabia | |
| United Arab Emirates | |
| Turkey | |
| Rest of Middle East | |
| Africa | South Africa |
| Egypt | |
| Rest of Africa | |
| South America | Brazil |
| Argentina | |
| Rest of South America |
| By Service Type | Testing | |
| Inspection | ||
| Certification | ||
| By Sourcing Type | In-house | |
| Outsourced | ||
| By Mode of Service Delivery | On-site | |
| Off-site / Laboratory | ||
| Remote / Digital | ||
| By Geography | North America | United States |
| Canada | ||
| Mexico | ||
| Europe | United Kingdom | |
| Germany | ||
| France | ||
| Italy | ||
| Rest of Europe | ||
| Asia-Pacific | China | |
| Japan | ||
| India | ||
| South Korea | ||
| Rest of Asia-Pacific | ||
| Middle East | Israel | |
| Saudi Arabia | ||
| United Arab Emirates | ||
| Turkey | ||
| Rest of Middle East | ||
| Africa | South Africa | |
| Egypt | ||
| Rest of Africa | ||
| South America | Brazil | |
| Argentina | ||
| Rest of South America | ||


Key Questions Answered in the Report
What is the current size of the pharmaceutical TIC market and its expected growth?
The pharmaceutical TIC market stands at USD 6.84 billion in 2026 and is projected to reach USD 8.60 billion by 2031 at a 4.69% CAGR.
Which service type holds the largest share in pharmaceutical TIC?
Testing leads with 43.19% of 2025 revenue as it covers complex assays for biologics and advanced therapies.
Why is Asia-Pacific the fastest growing region?
Government incentives in India and a surge in biologic approvals in China are driving a 5.54% regional CAGR through 2031.
How is continuous manufacturing influencing TIC demand?
Plants adopting continuous lines outsource validation of PAT sensors and real-time release testing, expanding TIC engagement.
What challenges limit TIC expansion in emerging markets?
Shortages of trained auditors and the high cost of advanced instruments slow service deployment and capacity scaling.
Which emerging technology is reshaping inspection practices?
Remote audit platforms using digital twins and blockchain trails are reducing on-site visit days and accelerating approvals.
Page last updated on:


