Pharmaceutical Electronic Data Interchange Market Size and Share
Market Overview
| Study Period | 2020 - 2031 |
|---|---|
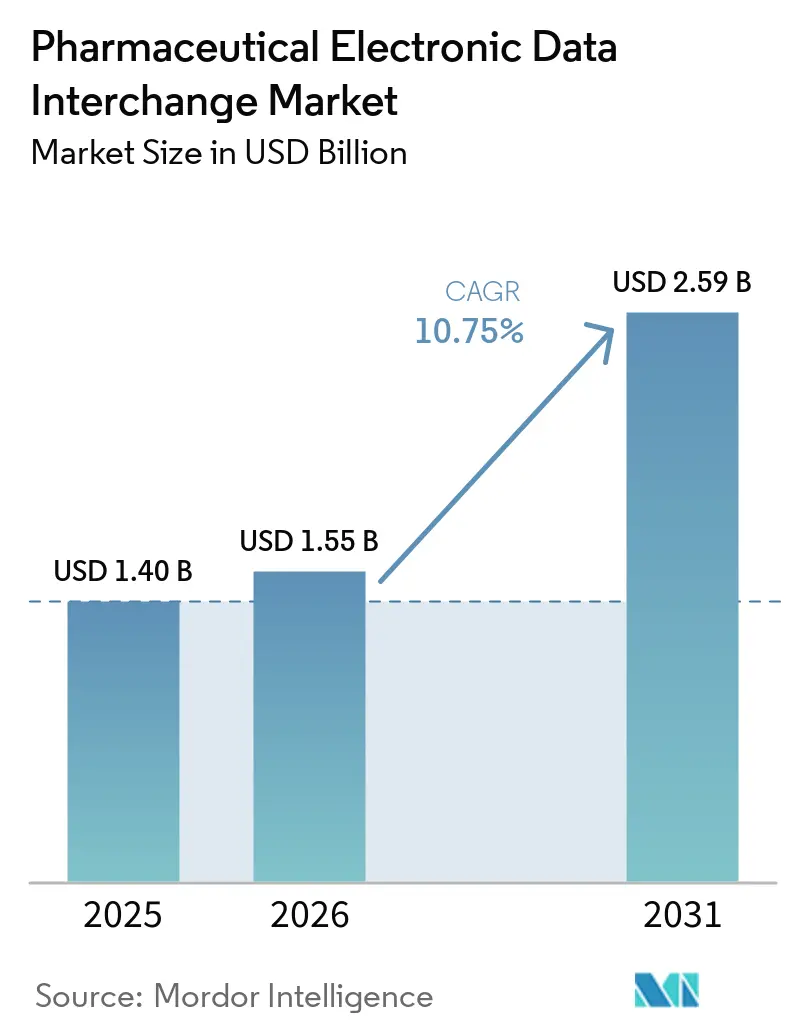
| Market Size (2026) | USD 1.55 Billion |
| Market Size (2031) | USD 2.59 Billion |
| Growth Rate (2026 - 2031) | 10.75% CAGR |
| Fastest Growing Market | Asia-Pacific |
| Largest Market | North America |
| Market Concentration | Medium |
Major Players *Disclaimer: Major Players sorted in no particular order Image © Mordor Intelligence. Reuse requires attribution under CC BY 4.0. | |
Pharmaceutical Electronic Data Interchange Market Analysis by Mordor Intelligence
The Pharmaceutical Electronic Data Interchange Market size was valued at USD 1.40 billion in 2025 and is estimated to grow from USD 1.55 billion in 2026 to reach USD 2.59 billion by 2031, at a CAGR of 10.75% during the forecast period (2026-2031).
Growth in this cycle surpasses the earlier adoption wave, which focused on baseline HIPAA X12 transaction compliance and initial DSCSA documentation needs. Current demand is driven by overlapping compliance deadlines in the U.S., including DSCSA interoperability requirements through 2026, the CMS and ONC's transition to NCPDP SCRIPT Version 2023011, and the HIPAA claims attachment standards effective May 26, 2026, with compliance required by May 26, 2028.[1]Centers for Medicare & Medicaid Services, “Administrative Simplification, Adoption of Standards for Health Care Claims Attachments Transactions and Electronic Signatures Final Rule CMS-0053-F,” CMS, cms.gov These mandatory deadlines limit buyers' ability to delay spending on interoperability tools, testing, and managed support.
Key Report Takeaways
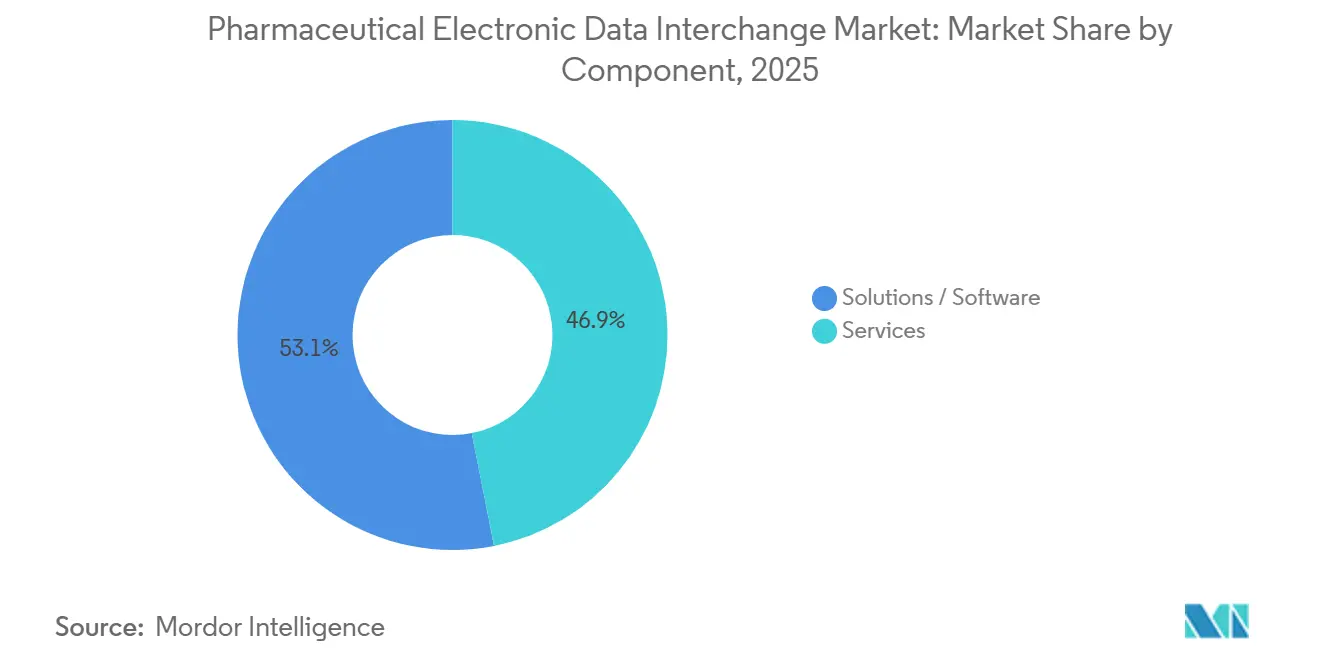
- By component, solutions/software held 53.12% share in 2025, while services are projected to expand at a 10.95% CAGR through 2031.
- By delivery mode, on-premises EDI held 55.89% share in 2025, while web- and cloud-based EDI is projected to grow at an 11.15% CAGR through 2031.
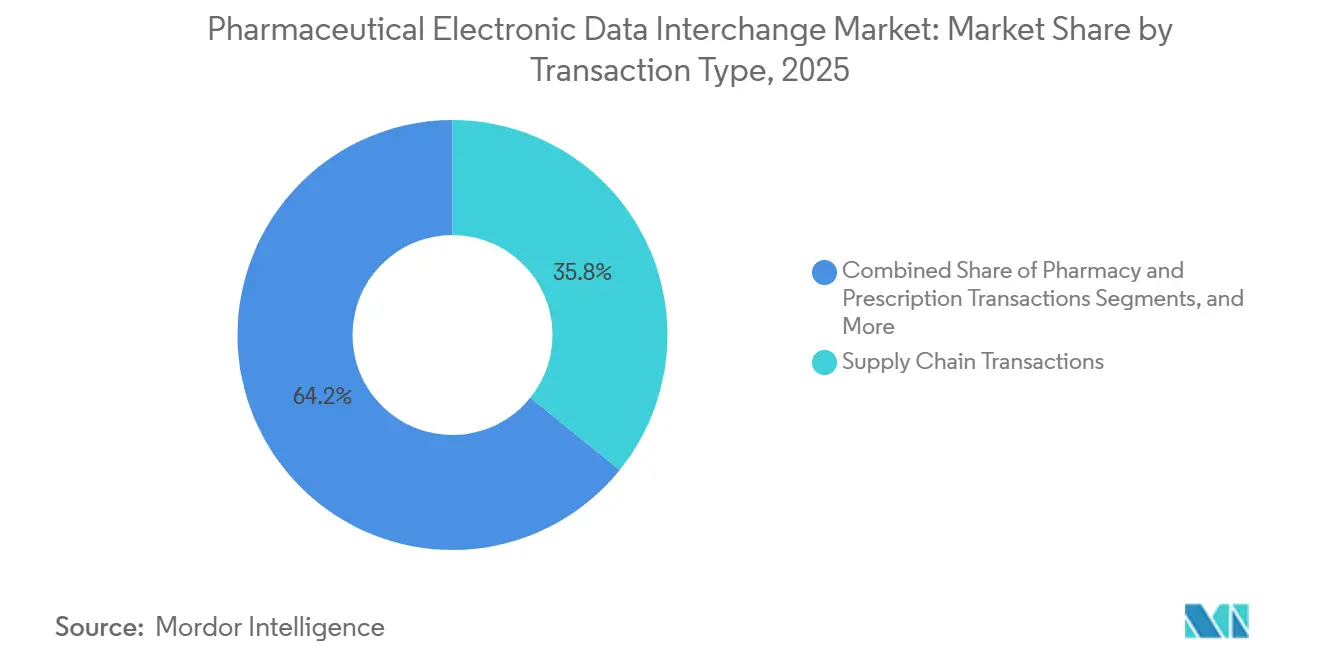
- By transaction type, supply chain transactions accounted for 35.79% share in 2025, while pharmacy and prescription transactions are expected to grow at an 11.66% CAGR through 2031.
- By end user, pharmaceutical manufacturers and biopharmaceuticals held 36.75% share in 2025, while CMOs and CDMOs are projected to expand at a 12.15% CAGR through 2031.
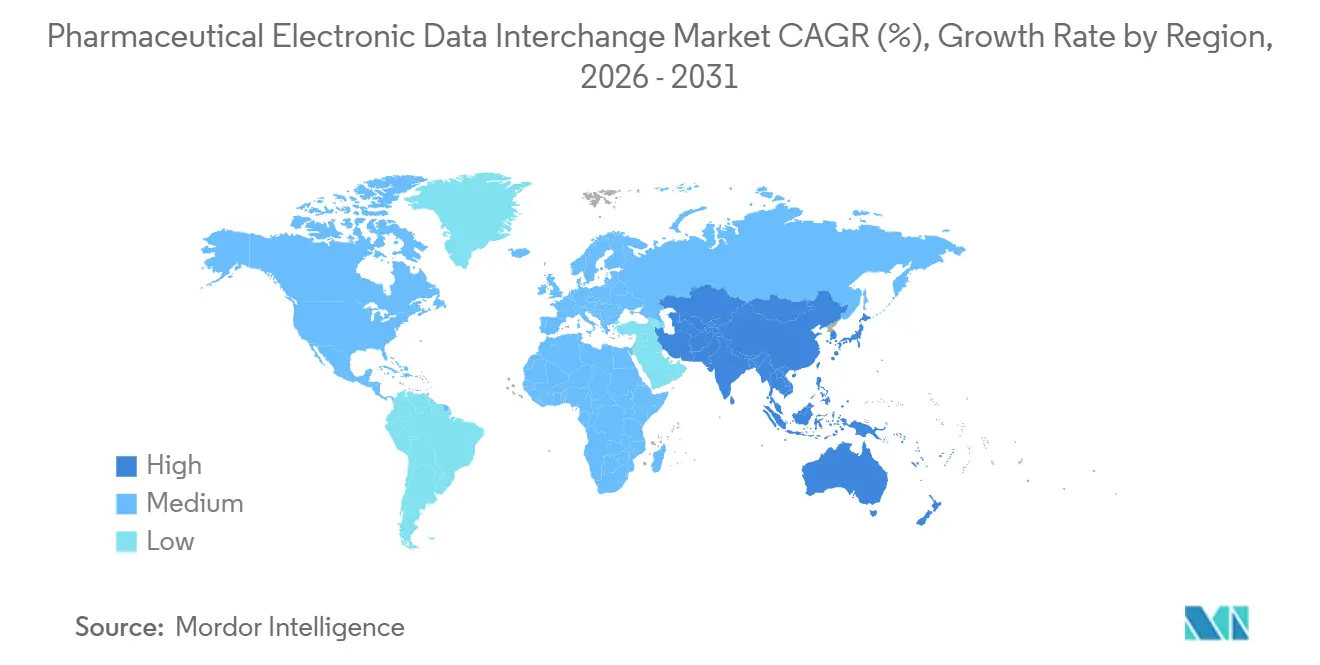
- By geography, North America held 40.76% share in 2025, while Asia-Pacific is projected to grow at a 12.25% CAGR through 2031.
Note: Market size and forecast figures in this report are generated using Mordor Intelligence’s proprietary estimation framework, updated with the latest available data and insights as of January 2026.
Global Pharmaceutical Electronic Data Interchange Market Trends and Insights
Drivers Impact Analysis*
| DRIVER | (~) % IMPACT ON CAGR FORECAST | GEOGRAPHIC RELEVANCE | IMPACT TIMELINE |
|---|---|---|---|
| Regulatory mandates for standardized healthcare transactions | +1.8% | Global, compliance intensity highest in North America and EU | Medium term (2-4 years) |
| NCPDP SCRIPT and pharmacy workflow upgrades | +1.5% | North America primary, with spillover through U.S.-linked pharmacy networks | Short term (≤ 2 years) |
| Cloud and API-enabled EDI modernization | +1.6% | Global, with early adoption in North America and Western Europe | Medium term (2-4 years) |
| Claims attachments digitization and workflow automation | +1.4% | North America core, with EU adoption emerging under digital health frameworks | Medium term (2-4 years) |
| DSCSA serialized EPCIS repository adoption | +2.0% | North America core, with spillover into global CMO and export-linked networks | Short term (≤ 2 years) |
| Rebate and chargeback automation in pharma channel | +1.2% | North America primary, with gradual uptake in Europe | Long term (≥ 4 years) |
| Source: Mordor Intelligence | |||
DSCSA EPCIS Repository Adoption: The Binding Near-Term Demand Catalyst
With DSCSA enforcement now active across the U.S. drug supply chain, full electronic traceability has become a critical driver in the pharmaceutical electronic data interchange market. The FDA's focus on interoperable, electronic package-level tracing eliminates reliance on manual workarounds. GS1 US is steering the market toward Release 1.3 adoption, with phased rollouts starting in 2026 for dispensers and extending to 2027 for manufacturers.[2]U.S. Food and Drug Administration, “Drug Supply Chain Security Act (DSCSA),” FDA, fda.gov This ensures ongoing activity in repository upgrades, partner onboarding, and conformance testing, driving recurring revenue from exception handling and message alignment.
NCPDP SCRIPT Upgrades Create a Locked-In Compliance Investment Window Through 2028
CMS has mandated NCPDP SCRIPT Standard Version 2023011 compliance for Medicare Part D e-prescribing by 2028, with additional standards due by 2027. ONC has aligned certification requirements with this timeline, pushing health IT developers to complete transitions by 2027.[3]Centers for Medicare & Medicaid Services, “Administrative Simplification, Adoption of Standards for Health Care Claims Attachments Transactions and Electronic Signatures Final Rule CMS-0053-F,” CMS, cms.gov Surescripts has upgraded workflows and introduced a certification tester to assist trading partners. This creates a defined investment window for vendors, intermediaries, and platforms to update systems, while expanding the scope of real-time benefits and prior authorization data exchange.
HHS Claims Attachment Standards: A USD 781.98 Million Annual Efficiency Gain for EDI Adopters
The pharmaceutical electronic data interchange market is set to benefit from HIPAA-adopted standards for health care claims attachments, effective from 2026 and fully implemented by 2028. HHS has adopted X12N 277 and 275 Version 6020 with HL7 C-CDA guides, replacing traditional documentation methods. Annualized savings are projected at USD 781.98 million. This is particularly impactful for specialty drug pathways with high documentation and claims support demands, with future spending expected for FHIR-linked policy changes.
Cloud and Network-Based EDI Displaces Point-to-Point Architectures
The pharmaceutical electronic data interchange market is shifting from bilateral links to cloud and network-based models, reducing maintenance burdens and centralizing updates. These models simplify partner onboarding and validation management across larger networks. Vendors offering governed connections for multiple counterparties are gaining traction, particularly among mid-sized manufacturers and outsourced production partners seeking scalability, auditability, and faster compliance management.
Restraints Impact Analysis*
| RESTRAINT | (~) % IMPACT ON CAGR FORECAST | GEOGRAPHIC RELEVANCE | IMPACT TIMELINE |
|---|---|---|---|
| Cybersecurity and HIPAA/HITECH exposure | -1.2% | North America and EU, concentrated in clearinghouse-dependent environments | Short term (≤ 2 years) |
| Legacy-system integration and multi-standard mapping | -1.5% | Global, with sharper pressure in APAC and MEA | Medium term (2-4 years) |
| EPCIS interpretation mismatches across trading partners | -0.8% | North America core, with spillover into export-linked markets | Short term (≤ 2 years) |
| Manual, fax, email, and portal persistence in long-tail distributors | -1.0% | North America, South America, and MEA | Long term (≥ 4 years) |
| Source: Mordor Intelligence | |||
Ransomware and HIPAA Enforcement Impose Measurable EDI Infrastructure Costs
Cybersecurity has become a significant expense for the pharmaceutical electronic data interchange market, as connected transaction environments are now integral to operations. An August 2025 ransomware attack on Inotiv disrupted internal business applications and data storage while compromising data of 9,542 individuals. This incident highlights the combined operational and legal risks. Additionally, HIPAA enforcement drives up costs for audits, contracts, and platform security, particularly impacting smaller entities that cannot distribute compliance expenses across large transaction volumes.
Legacy Multi-Standard Integration Suppresses Mid-Market Adoption Velocity
The pharmaceutical electronic data interchange market operates across multiple standards, including ASC X12, NCPDP SCRIPT, HL7-based formats, API-linked workflows, and GS1 EPCIS. This complexity requires integration across serialization platforms, ERP systems, and partner-specific messaging, slowing adoption for mid-sized companies. Regions with overlapping national and global standards face added translation and testing challenges, delaying procurement and deployment despite clear business cases.
*Our forecasts treat driver/restraint impacts as directional, not additive. The impact forecasts reflect baseline growth, mix effects, and variable interactions.
Segment Analysis
By Component: Services Growth Signals Integration Complexity Ahead
In 2025, Solutions/Software accounted for 53.12% of the market, driven by translation software, serialization platforms, and pharmacy management tools. This base remains critical as large organizations rely on embedded enterprise systems for transaction processing. Services are projected to grow at a 10.95% CAGR from 2026 to 2031, highlighting the rising importance of compliance execution, testing, and managed operations over software.
Buyers are prioritizing services to address EPCIS 2.0 readiness, DSCSA conformance, and outsourced transaction management under tight deadlines. Mid-sized manufacturers and CDMOs, lacking internal resources, are key demand drivers, shifting the market toward recurring service revenue models.


By Delivery Mode: Cloud Migration Gains Structural Irreversibility
On-Premises EDI held a 55.89% share in 2025, reflecting the established base of AS2, SFTP, and VAN-connected systems. These systems remain vital for high-volume distributors and manufacturers integrated with EDI, ERP, and warehouse workflows. Web- and Cloud-Based EDI is the fastest-growing segment, with an 11.15% CAGR from 2026 to 2031, driven by scalability and ease of updates.
Direct point-to-point EDI remains relevant for large trading pairs, while Mobile EDI serves niche use cases like last-mile ordering. Cloud deployment reduces infrastructure costs and accelerates updates, aligning with regulatory deadlines and easing partner onboarding.
By Transaction Type: Serialization Traceability Emerges as a Structurally New Fifth Pillar
Supply Chain Transactions led with a 35.79% share in 2025, supported by purchase orders, invoices, and price catalog flows. Pharmacy and Prescription Transactions are the fastest-growing segment, with an 11.66% CAGR from 2026 to 2031, driven by mandatory e-prescribing standards upgrades. Administrative and Financial Transactions are expanding due to claims attachment rules, while Serialization and Traceability Data Exchange is becoming a durable pillar, enabling continuous data generation. Rebates, remittances, and chargebacks are driving financial automation, creating a balanced market across supply, prescription, administrative, and traceability use cases.

By End User: CDMOs Accelerate as Sponsors Raise the Digital Integration Bar
Pharmaceutical Manufacturers and Biopharmaceuticals held a 36.75% share in 2025, reflecting their role in serialization, distribution data management, and regulated transactions. CMOs and CDMOs are projected to grow at a 12.15% CAGR from 2026 to 2031, driven by increased demand for digital readiness and compliance in outsourced manufacturing.
Wholesale and specialty distributors continue investing in repository connectivity and traceability post-2025 DSCSA milestones. Retail, chain, and specialty pharmacies face ongoing SCRIPT and claims attachment upgrades. GPOs, third-party logistics providers, and hub service organizations remain significant, supporting transaction volumes and coordination workflows.
Geography Analysis
In 2025, North America accounted for 40.76% of the pharmaceutical electronic data interchange market, securing the largest revenue share. The U.S. leads this growth due to regulatory initiatives like DSCSA, HIPAA claims attachments, and NCPDP SCRIPT upgrades, which drive investments in connectivity, testing, and workflow adjustments. Canada and Mexico contribute through import-driven trade and cross-border pharmaceutical distribution, increasing serialization and documentation complexity.
Asia-Pacific is projected to grow at a 12.25% CAGR from 2026 to 2031, making it the fastest-growing region in the pharmaceutical electronic data interchange market. Growth is driven by digitalization in pharmaceuticals across manufacturing, prescription workflows, and supply documentation, with China, India, Japan, Australia, and South Korea as key players. Japan's JD-NET system migration and initiatives like the May 2025 agreement between Shionogi, Astellas, and NTT DATA highlight compliance and platform-led growth in the region.
The Middle East and Africa region is growing steadily, led by GCC countries like Saudi Arabia and the UAE, with South Africa advancing in regulated pharmaceutical supply documentation. In South America, Brazil and Argentina drive growth through policy modernization supporting electronic prescribing and traceability. Smaller markets in MEA and South America remain in early adoption stages but offer long-term opportunities for vendors catering to localized standards and mid-market buyers.

Competitive Landscape
The pharmaceutical electronic data interchange market is moderately fragmented, with leadership varying by transaction layer and customer group. McKesson, IBM, Oracle, and OpenText lead in supply chain and administrative processing due to their enterprise integration depth, workflow presence, and trading partner relationships. In pharmacy workflows and serialization activities, specialists like TraceLink, Cleo, SPS Commerce, and TrueCommerce compete by offering network breadth, fast implementation, and regulatory update support. Buyers evaluate vendors based on specific transaction needs rather than a single-platform dominance.
Large incumbents maintain an advantage in areas requiring transaction scale, ERP integration, and long-standing relationships. McKesson's fiscal 2026 performance, with USD 6.2 billion in operating cash flow and AI-driven planning across demand, supply, inventory, and operations, highlights how operational scale reinforces partner reliance. Specialist platforms are driving competition through targeted strategies. Cotiviti's March 2025 acquisition of Edifecs combined X12 interoperability with analytics, increasing competitive pressure in payer, provider, and pharma exchanges. Surescripts strengthened its position by upgrading e-prescribing, electronic prior authorization, and medication history workflows aligned with the new NCPDP timetable.
White-space demand persists in CMO and CDMO integration, rebate automation, and compliance support for mid-market partners. SignalEDI's May 2026 AI-led platform launch, Veradigm's 2026 8-way match offering with Meperia, and GHX's orchestration platform launch reflect the market's focus on reducing manual reconciliation and improving real-time validation. Vendors that simplify exception handling and accelerate partner onboarding are gaining traction. Competition remains active across specialized niches, with differentiation driven by workflow fit, regulatory responsiveness, and network utility rather than scale alone.
Pharmaceutical Electronic Data Interchange Industry Leaders
Optum, Inc.
SPS Commerce, Inc.
Oracle Corporation
McKesson Corporation
International Business Machines Corporation
- *Disclaimer: Major Players sorted in no particular order

Recent Industry Developments
- May 2026: The HHS CMS-0053-F HIPAA Claims Attachment standards were implemented, introducing X12N 277/275 Version 6020 standards. Compliance is required by May 26, 2028, with expected annual savings of USD 781.98 million for healthcare entities.
- May 2026: CHEPLAPHARM, a Germany-based pharmaceutical group, implemented TraceLink MINT to enhance global supply chain digitalization. The platform replaced fragmented EDI connections, ensuring GxP-compliant data exchange, reducing validation cycles, and minimizing reliance on external consultants.
- May 2026: GHX launched its healthcare supply chain Orchestration Platform. The platform introduced Bill-Only Automation, linking supplier inventory with provider EHR data to streamline procedure reconciliation and reduce manual intervention in pharmaceutical workflows.
- May 2026: SignalEDI unveiled an AI-driven EDI automation platform for healthcare and pharmaceutical data exchange. Featuring API-first architecture, real-time validation, and automated processing, it offers a modern alternative to legacy VAN-based EDI systems.


Global Pharmaceutical Electronic Data Interchange Market Report Scope
As per the scope of the report, pharmaceutical electronic data interchange (EDI) is the computer-to-computer exchange of structured business and regulatory documents (e.g., invoices, purchase orders, product catalogs) between pharmaceutical manufacturers, distributors, pharmacies, and regulators. It eliminates manual data entry, speeds up supply chain fulfillment, and ensures industry compliance.
The pharmaceutical electronic data interchange market is segmented by component, delivery mode, transaction type, end-user, and geography. By component, the market includes solutions/software and services. By delivery mode, the market is segmented into on-premises, web- and cloud-based EDI, direct (point-to-point) EDI, and mobile EDI. By transaction type, the market is categorized into supply chain transactions, pharmacy and prescription transactions, administrative and financial transactions, and serialization and traceability data exchange. By end-user, the market is segmented into pharmaceutical manufacturers and biopharmaceutical companies, CMOs and CDMOs, wholesale distributors and specialty distributors, retail, chain, mail-order, and specialty pharmacies, and others. By geography, the market is analyzed across North America, Europe, Asia-Pacific, the Middle East and Africa, and South America. The report also covers the estimated market sizes and trends for 17 countries across major regions globally. The report offers the market sizes and forecasts in terms of value (USD) for the above segments.
| Solutions / Software |
| Services |
| On-Premises |
| Web- and Cloud-Based EDI |
| Direct (Point-to-Point) EDI |
| Mobile EDI |
| Supply Chain Transactions |
| Pharmacy and Prescription Transactions |
| Administrative and Financial Transactions |
| Serialization and Traceability Data Exchange |
| Pharmaceutical Manufacturers and Biopharmaceutical Companies |
| CMOs and CDMOs |
| Wholesale Distributors and Specialty Distributors |
| Retail, Chain, Mail-Order, and Specialty Pharmacies |
| Others |
| North America | United States |
| Canada | |
| Mexico | |
| Europe | Germany |
| United Kingdom | |
| France | |
| Italy | |
| Spain | |
| Rest of Europe | |
| Asia-Pacific | China |
| India | |
| Japan | |
| Australia | |
| South Korea | |
| Rest of Asia-Pacific | |
| Middle East and Africa | GCC |
| South Africa | |
| Rest of Middle East and Africa | |
| South America | Brazil |
| Argentina | |
| Rest of South America |
| By Component | Solutions / Software | |
| Services | ||
| By Delivery Mode | On-Premises | |
| Web- and Cloud-Based EDI | ||
| Direct (Point-to-Point) EDI | ||
| Mobile EDI | ||
| By Transaction Type | Supply Chain Transactions | |
| Pharmacy and Prescription Transactions | ||
| Administrative and Financial Transactions | ||
| Serialization and Traceability Data Exchange | ||
| By End User | Pharmaceutical Manufacturers and Biopharmaceutical Companies | |
| CMOs and CDMOs | ||
| Wholesale Distributors and Specialty Distributors | ||
| Retail, Chain, Mail-Order, and Specialty Pharmacies | ||
| Others | ||
| By Geography | North America | United States |
| Canada | ||
| Mexico | ||
| Europe | Germany | |
| United Kingdom | ||
| France | ||
| Italy | ||
| Spain | ||
| Rest of Europe | ||
| Asia-Pacific | China | |
| India | ||
| Japan | ||
| Australia | ||
| South Korea | ||
| Rest of Asia-Pacific | ||
| Middle East and Africa | GCC | |
| South Africa | ||
| Rest of Middle East and Africa | ||
| South America | Brazil | |
| Argentina | ||
| Rest of South America | ||


Key Questions Answered in the Report
What is the 2026 value and 2031 outlook for pharmaceutical electronic data interchange?
The pharmaceutical electronic data interchange market is valued at USD 1.55 billion in 2026 and is projected to reach USD 2.59 billion by 2031 at a 10.75% CAGR.
Which region leads pharmaceutical electronic data interchange adoption?
North America held the largest share at 40.76% in 2025 because DSCSA, NCPDP, and HIPAA attachment standards are all driving spending in the same market.
Which region is growing the fastest through 2031?
Asia-Pacific is the fastest-growing region with a projected 12.25% CAGR from 2026 to 2031, supported by broader pharmaceutical digitalization across major countries.
Which transaction category is expanding the fastest?
Pharmacy and Prescription Transactions are projected to grow at an 11.66% CAGR through 2031, supported by the NCPDP SCRIPT 2023011 compliance cycle.
Why are services growing faster than software in this space?
Services are forecast to grow at a 10.95% CAGR because companies need more implementation support, testing, certification, onboarding, and managed operations as standards change.
Which end users are creating the strongest new demand?
CMOs and CDMOs are the fastest-growing end-user group at a 12.15% CAGR because sponsors now expect stronger digital coordination and compliant electronic exchange from outsourced partners.
Page last updated on:


