Medical Devices Electronic Data Integration Market Size and Share
Market Overview
| Study Period | 2020 - 2031 |
|---|---|
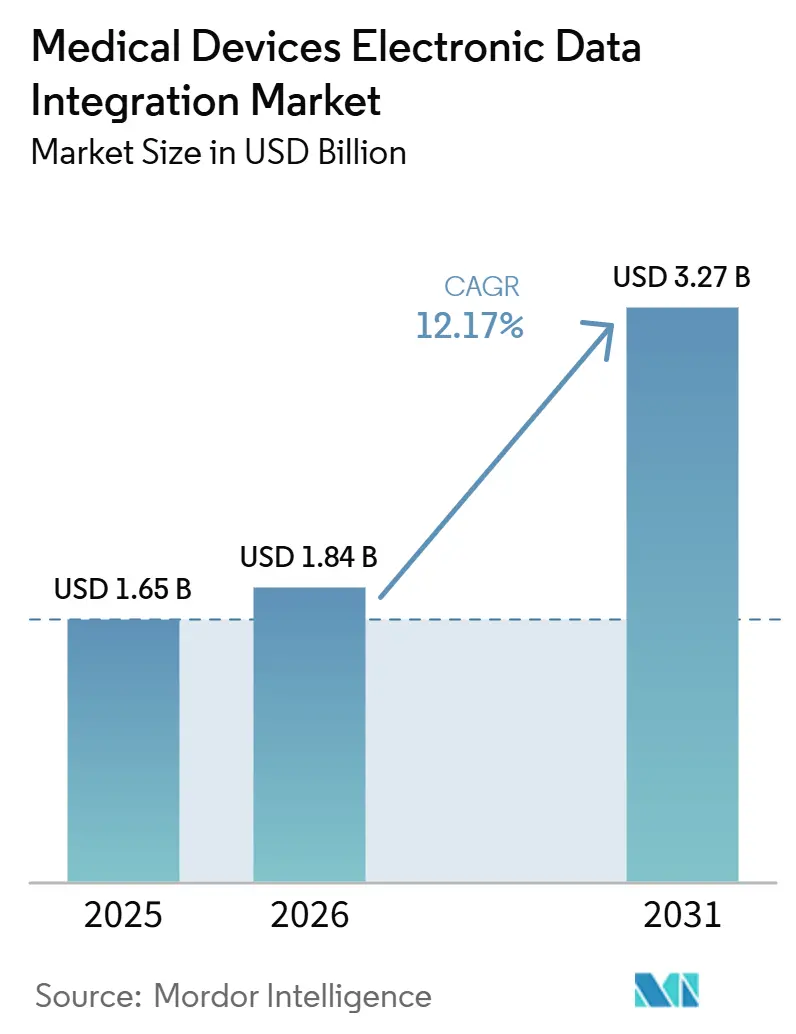
| Market Size (2026) | USD 1.84 Billion |
| Market Size (2031) | USD 3.27 Billion |
| Growth Rate (2026 - 2031) | 12.17% CAGR |
| Fastest Growing Market | Asia-Pacific |
| Largest Market | North America |
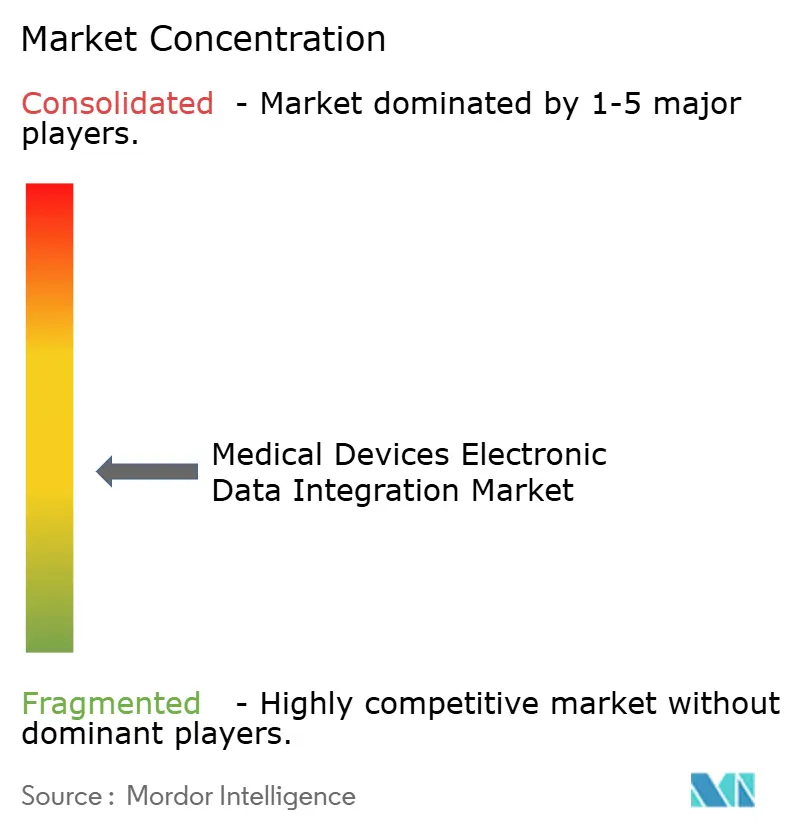
| Market Concentration | Medium |
Major Players *Disclaimer: Major Players sorted in no particular order Image © Mordor Intelligence. Reuse requires attribution under CC BY 4.0. | |
Medical Devices Electronic Data Integration Market Analysis by Mordor Intelligence
The Medical Devices Electronic Data Integration Market size was valued at USD 1.65 billion in 2025 and is estimated to grow from USD 1.84 billion in 2026 to reach USD 3.27 billion by 2031, at a CAGR of 12.17% during the forecast period (2026-2031).
\The medical device electronic data integration market is moving ahead because hospitals, laboratories, and ambulatory care settings are under steady pressure to connect rising volumes of device-generated data with clinical systems without adding manual work. The pace of adoption is also being shaped by stronger software validation and documentation requirements under the FDA’s Quality Management System Regulation, which took effect in February 2026 and aligned important quality expectations with ISO 13485:2016. The medical device electronic data integration market is also seeing competition shift upward from simple data routing toward deeper interoperability, hardware-level parameter integration, and platform validation programs that shorten deployment time for health systems. Medtronic’s March 2026 expansion of its alliance with GE HealthCare shows that leading vendors are trying to embed data integration directly into monitoring platforms rather than leaving the whole burden to middleware layers. The medical device electronic data integration market will also keep finding opportunities in hybrid deployments, laboratory workflows, and digitally upgraded critical care environments where real-time data flow has become part of both care quality and compliance.
Key Report Takeaways
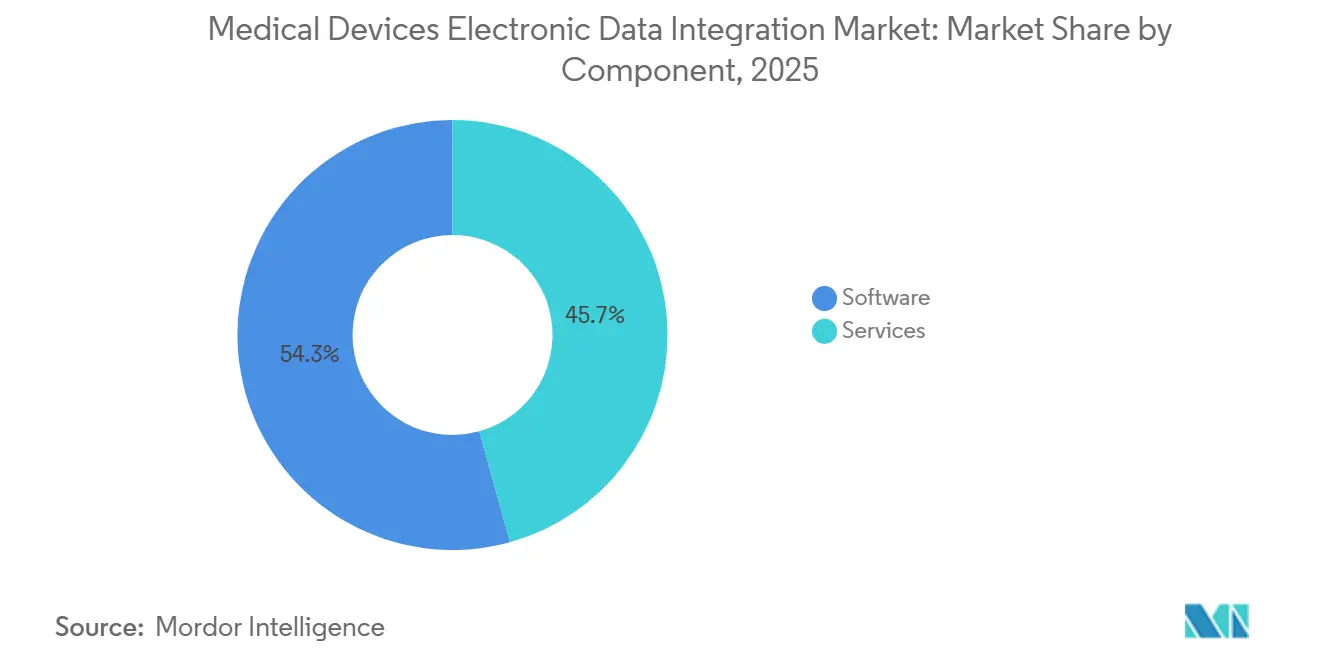
- By component, software held 54.3% of the market in 2025, and software also recorded the fastest projected CAGR at 12.48% through 2031.
- By deployment, cloud-based deployment led with 47.62% share in 2025, while hybrid deployment is forecasted to grow fastest at 13.07% through 2031.
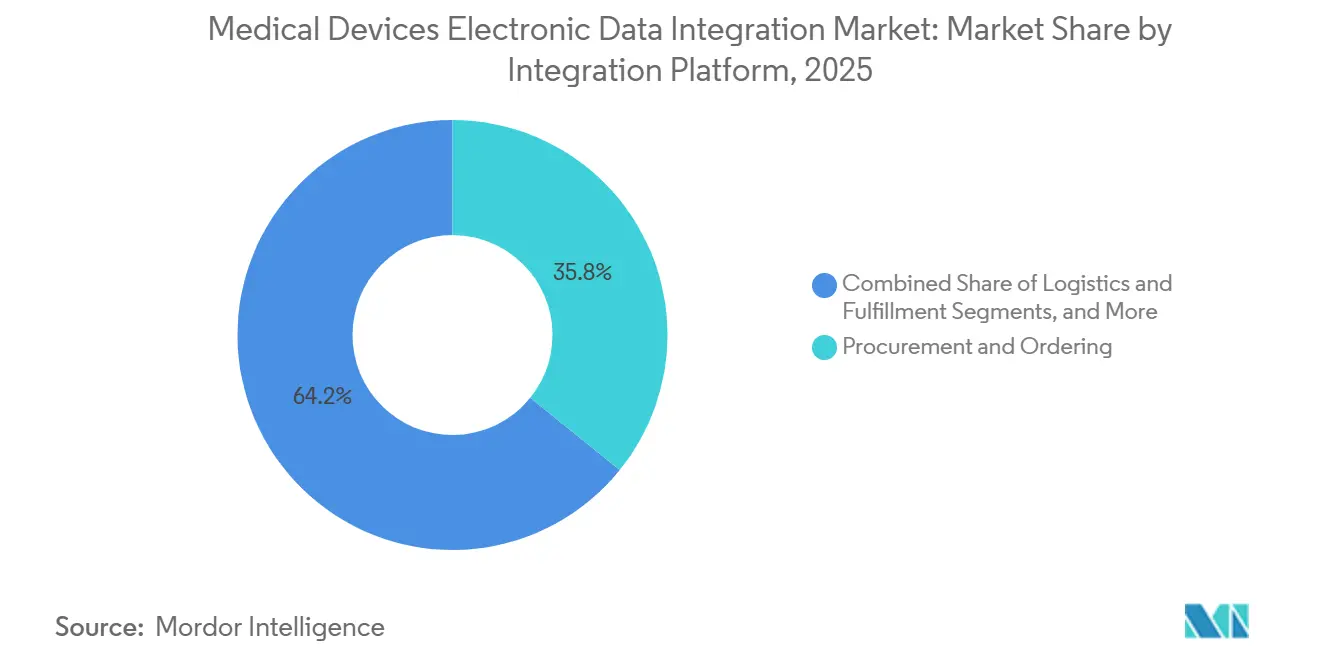
- By integration platform, medical device integration software accounted for 40.28% share in 2025, while device connectivity middleware is projected to advance fastest at 13.56% through 2031.
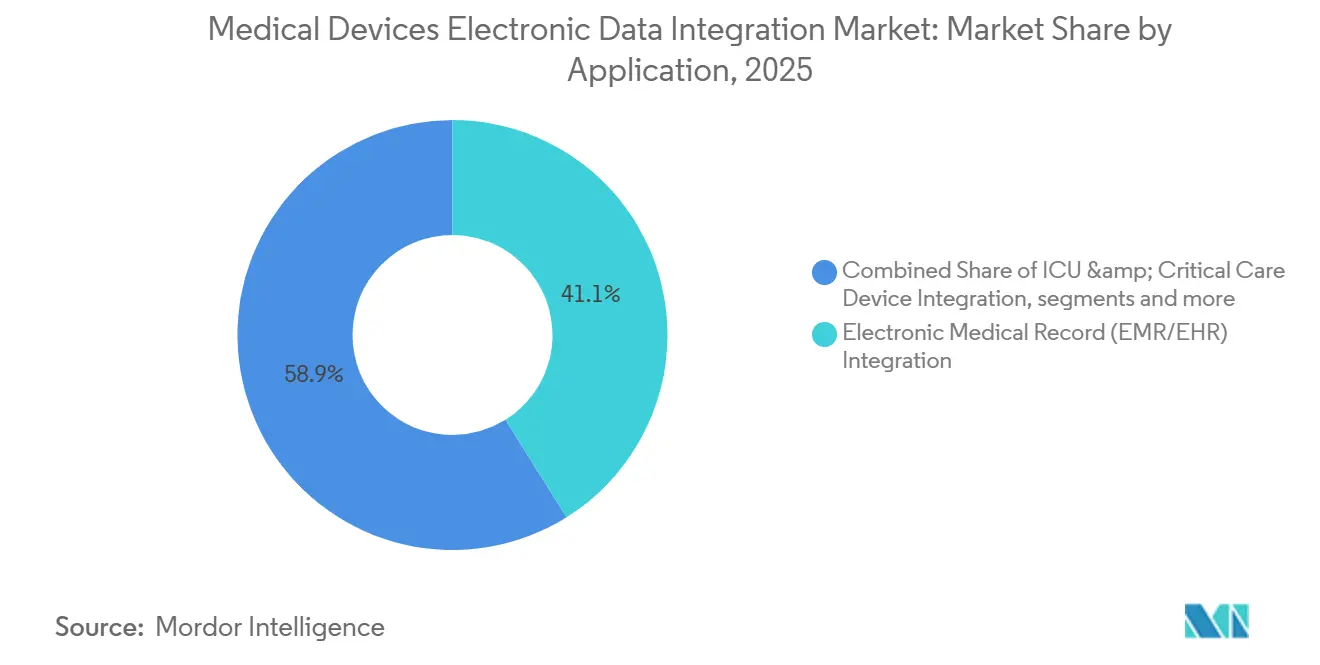
- By application, electronic medical record (EMR/EHR) integration captured 41.10% share in 2025, while laboratory data integration is expected to expand fastest at 14.66% through 2031.
- By end-user, hospitals represented 42.03% share in 2025, while diagnostic laboratories are expected to record the fastest CAGR of 14.27% through 2031.
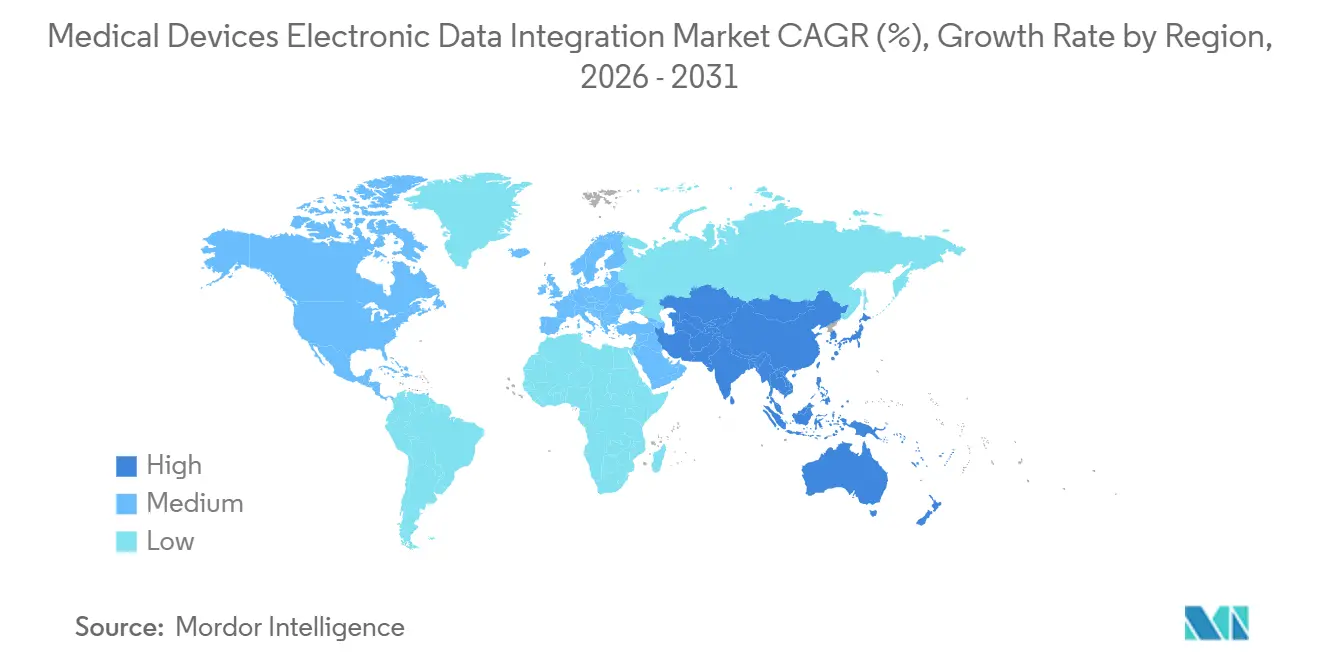
- By geography, North America held 47.35% share in 2025, while Asia-Pacific is projected to grow fastest at 15.53% through 2031.
Note: Market size and forecast figures in this report are generated using Mordor Intelligence’s proprietary estimation framework, updated with the latest available data and insights as of January 2026.
Global Medical Devices Electronic Data Integration Market Trends and Insights
Drivers Impact Analysis*
| Driver | (~) % Impact on CAGR Forecast | Geographic Relevance | Impact Timeline |
|---|---|---|---|
| Increasing Adoption of Connected Medical Devices | +3.0% | Global | Short term (≤ 2 years) |
| Growing Need for Automated Device Data Capture | +2.2% | North America & Europe | Short term (≤ 2 years) |
| Expansion of Smart Hospitals and Digital ICUs | +2.3% | APAC core, spill-over to MEA | Medium term (2-4 years) |
| Rising Demand for Real-Time Clinical Decision Support | +1.7% | Global | Medium term (2-4 years) |
| Regulatory Focus on Electronic Documentation and Data Accuracy | +1.4% | North America & Europe | Short term (≤ 2 years) |
| Growth of Home Healthcare Device Integration | +1.1% | North America, APAC | Long term (≥ 4 years) |
| Source: Mordor Intelligence | |||
Increasing Adoption of Connected Medical Devices
Hospitals are adding more connected endpoints, and each new monitor, wearable, implantable, or sensor increases the amount of clinical data that must move reliably across information systems. A June 2025 study in the Journal of Big Data showed that a layered smart hospital architecture can support simultaneous device data capture across perception, gateway, and cloud layers, while edge processing at the gateway can reduce latency by 70% compared with cloud-only designs.[1]Springer Nature, “A Unified IoT Architectural Model for Smart Hospitals: Enhancing Interoperability, Security, and Efficiency Through Clinical Information Systems (CIS),” Journal of Big Data, link.springer.com The medical device electronic data integration market is benefiting because intensive care units and perioperative settings generate the highest per-bed data volumes and often become the first locations where enterprise integration is tested and scaled. The publication of ISO/IEEE 11073-10700 in 2024, with European adoption in 2025, also gave procurement teams a clearer baseline for point-of-care device communication in ICU and operating room settings.[2]MDPI, “Design and Implementation of an Intensive Care Unit Command Center for Medical Data Fusion,” Sensors, doi.org This direction supports vendors that can show certified interoperability at the device level rather than only promising protocol translation after deployment.
Growing Need for Automated Device Data Capture
The medical device electronic data integration market is also being pushed by the need to remove manual transcription from bedside and laboratory workflows that still cause avoidable delays and documentation errors. LabLynx stated in 2026 that direct instrument-to-LIMS integration can eliminate more than 95% of transcription errors and free 10 to 15 hours per technician each week, which makes the business case much easier for health systems facing staff pressure.[3]LabLynx, “2026 Laboratory Compliance Guide: Regulations and ROI Strategy,” LabLynx, lablynx.com Yoctobe also reported in Q1 2026 that standardized middleware profiles reduced analyzer integration cycle times from 5 to 10 days down to 1 to 3 days, showing that faster data capture is becoming a repeatable operating model rather than a custom project each time. As a result, the medical device electronic data integration market is gaining support from both clinical teams that want cleaner records and finance teams that want more predictable delivery timelines.
Expansion of Smart Hospitals and Digital ICUs
Smart hospital investment is reinforcing demand because physical modernization produces limited value until device data can move across care teams, dashboards, and record systems in real time. The medical device electronic data integration market is, therefore, seeing smart ICU projects become one of the clearest demand anchors for higher-value deployments. In June 2026, South Korea’s Chonnam National University Hospitals completed installation of the AI-based thynC monitoring system across 558 beds, and the deployment was linked to a broader smart hospital construction program valued at KRW 1 trillion, or USD 726 million at the 2026 average conversion used. These programs matter because they pair connectivity spending with clinical workflow redesign rather than treating integration as a stand-alone IT task. The medical device electronic data integration market will continue to benefit where hospitals are building digital command centers, remote oversight models, and bed-level monitoring networks at the same time.
Legacy ERP, WMS, EHR, and Supplier-System Integration Complexity
Integration complexities hinder the electronic data interchange market for medical devices, especially in large health systems managing mixed ERP, WMS, EHR, and supplier platforms. Deployments require customized mapping, validation, and testing, increasing implementation time and costs. Organizations relying on manual processes further complicate integration. Services dominate the market as buyers seek ongoing support, with application sprawl and procurement inefficiencies limiting automation scalability.
Restraints Impact Analysis*
| Restraint | (~) % Impact on CAGR Forecast | Geographic Relevance | Impact Timeline |
|---|---|---|---|
| Legacy Medical Device Compatibility Issues | -1.3% | Global, most acute in MEA & South America | Medium term (2-4 years) |
| Complex Multi-Vendor Device Integration | -1.0% | North America & Europe | Short term (≤ 2 years) |
| Cybersecurity and Patient Data Privacy Risks | -0.9% | Global | Short term (≤ 2 years) |
| High Implementation and Validation Costs | -0.7% | MEA, South America, APAC emerging markets | Long term (≥ 4 years) |
| Source: Mordor Intelligence | |||
Legacy Medical Device Compatibility Issues
A large part of the installed medical device base still runs on proprietary or older communication protocols, and that limits how far new enterprise integration platforms can scale without device-side work. In practice, the value of a hospital-wide platform is often capped by the least capable device in the network, which means one outdated instrument can slow a much larger modernization program. The medical device electronic data integration market therefore faces a structural drag in facilities that have long replacement cycles and mixed fleets across departments. The challenge is especially visible in regions where hospitals replace capital equipment more slowly and cannot absorb repeated validation work across many sites.
Cybersecurity and Patient Data Privacy Risks
Cybersecurity remains one of the clearest restraints because every connected endpoint expands the attack surface around clinical systems and patient data flows. A 2025 Censinet analysis found that only 1% of 4,000 scanned DICOM servers had proper authentication and that more than 1 million IoT medical devices were exposed online, which showed how far security hardening still lags deployment. The medical device electronic data integration market is therefore concentrating more purchasing with vendors that can support live component documentation, security governance, and audit readiness as part of the product offering. Smaller health systems may move more slowly because those ongoing requirements add overhead after the initial installation is complete.
*Our forecasts treat driver/restraint impacts as directional, not additive. The impact forecasts reflect baseline growth, mix effects, and variable interactions.
Segment Analysis
By Component: Software Drives Revenue and Recurring Growth
Software held 54.32% of the market in 2025, and it is also the fastest-growing component with a projected 12.48% CAGR through 2031. The component mix shows that buyers increasingly want platforms that stay active after implementation instead of one-time integration work that ends once devices are connected. The medical device electronic data integration market is reflecting this change as subscription-based models spread across health systems that prefer predictable updates, validation support, and service continuity. Software also benefits from the fact that hospitals are trying to standardize data mapping, monitoring, and audit trails across many departments instead of paying for isolated interface work each time a new device is added.
Services remain important because large deployments still need implementation, training, and managed support, especially where internal health IT capacity is limited. In the medical device electronic data integration industry, services often continue to shape the first phase of deal value even when software becomes the main revenue engine later in the customer relationship. Overall, the medical device electronic data integration market is rewarding software suppliers that can combine interoperability, compliance support, and long-term account retention in a single offering.


By Deployment: Hybrid Gains Ground as Compliance Complexity Rises
Cloud-based deployment led with 47.62% share in 2025, while hybrid deployment is projected to grow fastest at 13.07% CAGR through 2031. The size of the cloud segment reflects its appeal to mid-sized health systems that want scalability and lower upfront infrastructure cost. At the same time, the growth of hybrid deployment shows that many organizations still need local control over sensitive workflows even while they adopt cloud-based analytics and oversight tools. The medical device electronic data integration market size for hybrid models is rising because regulated buyers often need a practical balance between modern functionality and data governance requirements.
On-premises systems still hold a meaningful place in large academic centers and public hospitals that operate under stricter control requirements. Many organizations that built local integration infrastructure before 2024 are now adding cloud layers for analytics and remote monitoring instead of replacing the full installed base. The medical device electronic data integration market is therefore moving toward blended architectures that fit complex enterprise environments better than pure cloud or pure local models. Vendors that support this blend will be better placed where healthcare groups want modernization without major disruption to existing environments.
By Integration Platform: Middleware Expands Its Role in Multi-Vendor Settings
Medical device integration software held 40.28% share in 2025, while device connectivity middleware is expected to grow fastest at 13.56% through 2031. The leading share of dedicated integration software reflects its long-standing role as the core architecture for device-to-EHR connectivity across hospital networks. The faster growth of middleware shows that buyers increasingly value hardware-agnostic translation layers when they manage fleets from many manufacturers across different care settings. The medical device electronic data integration market is responding to this need because hospitals do not want a single device vendor to dictate the full data architecture of the enterprise.
Enterprise integration platforms and API-based platforms are still expanding their healthcare relevance, but high-acuity settings continue to favor purpose-built solutions that are designed for clinical workflows from the start. In the medical device electronic data integration industry, cloud integration platforms also remain useful in lower-latency-sensitive workflows such as remote monitoring and population health data aggregation. For that reason, the medical device electronic data integration market is likely to keep supporting several platform models at once, with middleware gaining share where multi-vendor complexity is highest.

By Application: EMR and EHR Integration Holds the Base While Labs Grow Faster
Electronic medical record (EMR/EHR) integration accounted for 41.10% of the market in 2025, while laboratory data integration is projected to grow fastest at 14.66% through 2031. EMR and EHR workflows remain the main commercial entry point because device data only delivers full operational value when it reaches the patient record quickly and accurately. Laboratory data integration is growing faster because many hospitals are moving away from batch-style result transfer and toward continuous analyzer-to-record pipelines.
The medical device electronic data integration market also continues to open space in critical care workflows where alarms, physiological parameters, and bedside data are being used more actively. ICU and critical care integration is benefiting from quiet alarm management and workflow orchestration models that depend on more structured device communication. Clinical documentation automation is also expanding as health systems look for ways to pull more procedural and device-linked data directly into records without extra staff time. Taken together, these patterns show that the medical device electronic data integration market is broadening beyond basic record transfer and moving deeper into workflow control, monitoring, and real-time clinical operations.
By End-User: Hospitals Lead Current Demand While Laboratories Accelerate
Hospitals held 42.03% of the market in 2025, while diagnostic laboratories are expected to grow fastest at 14.27% through 2031. Hospitals remain the primary center of demand because they carry the highest density of connected bedside devices and the largest need for enterprise-scale coordination. Large provider organizations are also under pressure to connect nursing workflows, communication systems, and records more tightly, which keeps enterprise integration near the top of digital spending priorities. This is why hospitals continue to anchor both current share and near-term deployment volume across the medical device electronic data integration market.
Diagnostic laboratories are expanding faster because they are more directly focused on eliminating manual analyzer data transfer and improving throughput without equivalent staffing growth. That growth is also supported by the spread of LIMS environments, middleware standardization, and instrument connectivity investments that shorten cycle times across test workflows. The medical device electronic data integration market is therefore widening across end users, but hospitals and laboratories will remain the clearest volume and growth anchors over the forecast period.
Geography Analysis
North America held 47.35% of the market in 2025, which gave the region the largest position in the medical device electronic data integration market. The region’s leadership is tied to dense EHR penetration, established interoperability mandates, and stronger provider pressure to standardize device-linked documentation across health systems. The medical device electronic data integration market share in North America also reflects faster procurement of integration upgrades that support governance, record quality, and clinical workflow consistency. Canada and Mexico are moving at different speeds, but both are still extending demand for more standardized device data feeds into larger care networks.
Europe remained the second-largest regional block, supported by health IT modernization programs across Germany, the United Kingdom, France, Italy, and Spain. The region’s demand profile is shaped by the need to satisfy national data residency expectations while still enabling wider use of device-generated health data across health systems. Europe’s position in the medical device electronic data integration market is also supported by public procurement processes that increasingly emphasize standards, compliance, and long-term maintainability. As a result, vendors with stronger documentation, interoperability coverage, and regional deployment models are better placed in this geography.
Asia-Pacific is projected to be the fastest-growing region with a 15.53% CAGR through 2031, and it is becoming the most active expansion zone in the medical device electronic data integration market. Growth is being supported by hospital digitalization programs, smart facility investment, expanding installed device bases, and continued build-out of hospital infrastructure across major economies. The medical device electronic data integration market size is also rising in Asia-Pacific because new facilities can design integration into the digital architecture earlier instead of retrofitting everything later. The Middle East and Africa and South America remain earlier-stage opportunities, but long sales cycles and capital constraints mean adoption will depend on vendors that can price and support deployments for more complex replacement environments.

Competitive Landscape
The medical device electronic data integration market is moderately fragmented. Competition comes from enterprise IT companies such as Oracle, SAP, and Cisco, as well as healthcare-focused specialists including InterSystems, Baxter’s Capsule Technologies, Redox, GE HealthCare, Siemens Healthineers, Lyniate, and MEDITECH. This mix means the market does not revolve around one winning architecture, because buyers can choose between broad enterprise platforms, dedicated clinical interoperability tools, and device-linked ecosystems. The medical device electronic data integration market is also becoming more layered, with vendors competing on standards depth, pre-built device libraries, security posture, and deployment flexibility rather than only on raw interface count. That structure supports steady activity from both large diversified groups and narrower specialists.
One visible strategy is to shorten adoption time by formalizing interoperability validation and partner ecosystems. Another strategy is to push integration deeper into hardware relationships, as seen in Medtronic’s March 2026 expansion of its global alliance with GE HealthCare. That move matters because it shifts part of the value proposition away from after-the-fact middleware translation and toward embedded parameter interoperability. Vendors that can demonstrate this type of certified, workflow-ready connection are likely to gain more leverage in larger enterprise tenders.
A third strategy is to build hybrid-ready and standards-led platforms that fit tightening regulatory and operating requirements. InterSystems’ 2026.1 release for IRIS, IRIS for Health, and HealthShare Health Connect shows how vendors are packaging cloud-first managed services, configurable local components, and AI-assisted data transformation in the same platform family. SAP and Fresenius also signaled that sovereign FHIR-based platforms could become a stronger competitive factor in Europe where cross-border data use and national control requirements must coexist. The medical device electronic data integration market still has open space in AI-augmented integration operations, hybrid-native middleware, and laboratory connectivity, but vendors will need stronger compliance documentation and device coverage to defend those positions over time.
Medical Devices Electronic Data Integration Industry Leaders
Capsule Technologies
GE HealthCare
Oracle Corporation
InterSystems Corporation
Ascom Holding AG
- *Disclaimer: Major Players sorted in no particular order

Recent Industry Developments
- June 2026: Redox launches AI capabilities across its interoperability platform: Redox launched an MCP server, AI Assistant Suite, and intelligent in-flight data processing features with HIPAA-compliant and HITRUST AI security governance, positioning its integration infrastructure as the data foundation for AI workflows in healthcare organizations.
- June 2026: Oracle Health and Theator partner for AI-native surgical documentation: Oracle Health partnered with Theator to integrate AI-powered surgical video analytics and automated EHR documentation into the Oracle Health platform for operating room workflows, extending device data capture into procedural clinical environments for the first time on this platform.
- May 2026: InterSystems IntelliCare achieves EU MDR Class IIa certification: InterSystems announced that IntelliCare and TrakCare secured EU Medical Device Regulation certification, with IntelliCare becoming the first fully unified AI-native EHR to achieve Class IIa device status in the EU, a compliance factor relevant to integration software embedded within certified EHR ecosystems.


Global Medical Devices Electronic Data Integration Market Report Scope
According to the report’s scope, the medical devices electronic data integration market refers to the process of electronically capturing, standardizing, integrating, and exchanging data generated by medical devices with healthcare information systems such as electronic health records (EHRs), laboratory information systems (LIS), and hospital information systems (HIS). It enables seamless data flow, improves clinical workflows, reduces manual data entry, and supports real-time patient monitoring and informed clinical decision-making.
The medical devices electronic data integration market is segmented into component, deployment, integration platform, application, end-user, and geography. By component, the market is segmented into software and services. By deployment, the market is segmented into cloud-based, on-premises, and hybrid. By integration platform, the market is segmented into device connectivity middleware, medical device integration software, enterprise integration platforms, API-based integration platforms, and cloud integration platforms. By application, the market is segmented into electronic medical record (EMR/EHR) integration, ICU & critical care device integration, laboratory data integration, clinical documentation automation, remote device monitoring, and other applications. By end-user, the market is segmented into hospitals, ambulatory surgical centers, diagnostic laboratories, specialty clinics, and other end-users. By geography, the market is segmented into North America, Europe, Asia-Pacific, the Middle East and Africa, and South America. The report also covers the estimated market sizes and trends for 17 countries across major regions globally. The report offers values (USD) for all the above segments.
| Software |
| Services |
| Cloud-Based |
| On-Premises |
| Hybrid |
| Device Connectivity Middleware |
| Medical Device Integration Software |
| Enterprise Integration Platforms |
| API-Based Integration Platforms |
| Cloud Integration Platforms |
| Electronic Medical Record (EMR/EHR) Integration |
| ICU & Critical Care Device Integration |
| Laboratory Data Integration |
| Clinical Documentation Automation |
| Remote Device Monitoring |
| Other Applications |
| Hospitals |
| Ambulatory Surgical Centers |
| Diagnostic Laboratories |
| Specialty Clinics |
| Other End-Users |
| North America | United States |
| Canada | |
| Mexico | |
| Europe | Germany |
| United Kingdom | |
| France | |
| Italy | |
| Spain | |
| Rest of Europe | |
| Asia-Pacific | China |
| Japan | |
| India | |
| Australia | |
| South Korea | |
| Rest of Asia-Pacific | |
| Middle East and Africa | GCC |
| South Africa | |
| Rest of Middle East and Africa | |
| South America | Brazil |
| Argentina | |
| Rest of South America |
| By Component | Software | |
| Services | ||
| By Deployment | Cloud-Based | |
| On-Premises | ||
| Hybrid | ||
| By Integration Platform | Device Connectivity Middleware | |
| Medical Device Integration Software | ||
| Enterprise Integration Platforms | ||
| API-Based Integration Platforms | ||
| Cloud Integration Platforms | ||
| By Application | Electronic Medical Record (EMR/EHR) Integration | |
| ICU & Critical Care Device Integration | ||
| Laboratory Data Integration | ||
| Clinical Documentation Automation | ||
| Remote Device Monitoring | ||
| Other Applications | ||
| By End-User | Hospitals | |
| Ambulatory Surgical Centers | ||
| Diagnostic Laboratories | ||
| Specialty Clinics | ||
| Other End-Users | ||
| By Geography | North America | United States |
| Canada | ||
| Mexico | ||
| Europe | Germany | |
| United Kingdom | ||
| France | ||
| Italy | ||
| Spain | ||
| Rest of Europe | ||
| Asia-Pacific | China | |
| Japan | ||
| India | ||
| Australia | ||
| South Korea | ||
| Rest of Asia-Pacific | ||
| Middle East and Africa | GCC | |
| South Africa | ||
| Rest of Middle East and Africa | ||
| South America | Brazil | |
| Argentina | ||
| Rest of South America | ||


Key Questions Answered in the Report
What is the 2031 outlook for medical device electronic data integration?
The market is forecasted to reach USD 3.27 billion by 2031 from USD 1.65 billion in 2025 to USD 1.84 billion in 2026, with a 12.17% CAGR from 2026 to 2031.
Which component category leads revenue today?
Software led with 54.32% share in 2025, supported by recurring subscription models, validation needs, and ongoing platform updates.
Which deployment model is growing fastest?
Hybrid deployment is expected to grow at 13.07% through 2031 because many providers want cloud benefits while retaining local control over sensitive workflows.
Which region offers the fastest expansion opportunity?
Asia-Pacific is projected to grow at 15.53% through 2031, supported by hospital digitalization, smart facility investment, and new infrastructure build-outs.
Page last updated on:


