PET Packaging Market Size and Share
Market Overview
| Study Period | 2020 - 2031 |
|---|---|
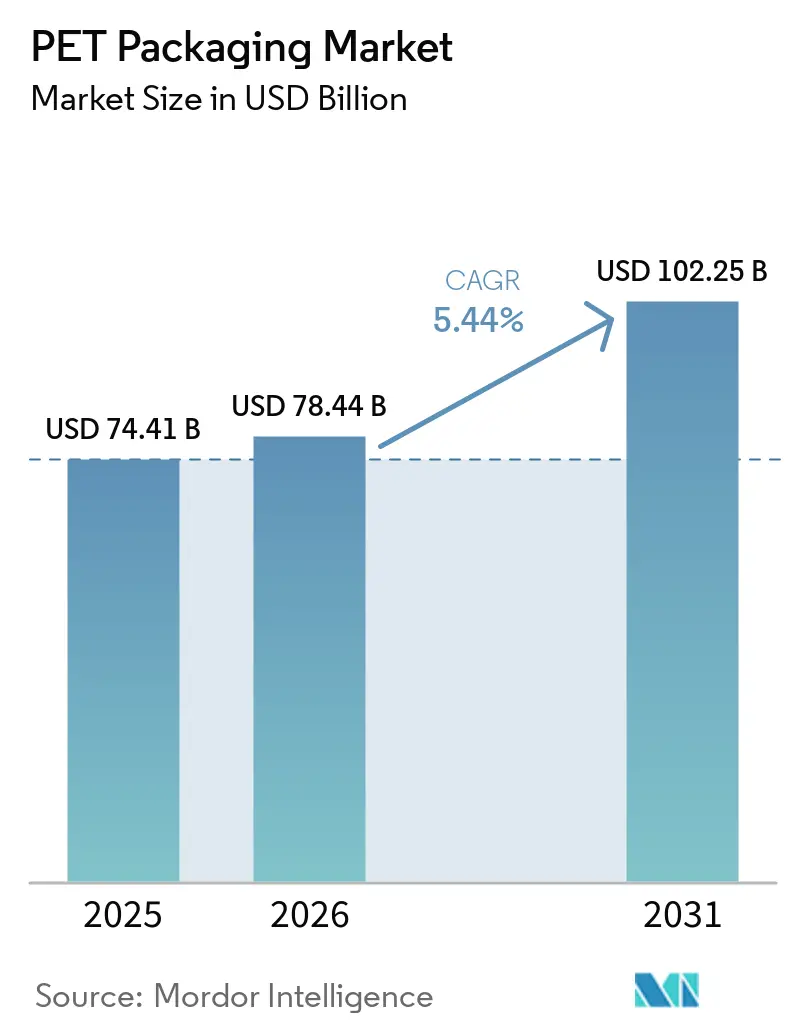
| Market Size (2026) | USD 78.44 Billion |
| Market Size (2031) | USD 102.25 Billion |
| Growth Rate (2026 - 2031) | 5.44% CAGR |
| Fastest Growing Market | Asia-Pacific |
| Largest Market | Asia-Pacific |
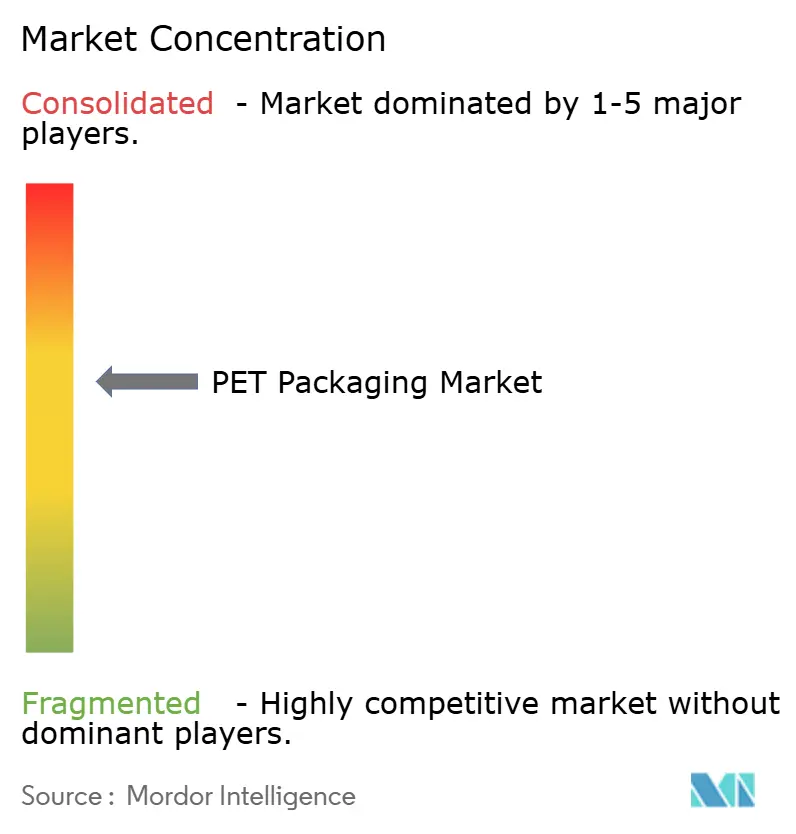
| Market Concentration | Medium |
Major Players *Disclaimer: Major Players sorted in no particular order Image © Mordor Intelligence. Reuse requires attribution under CC BY 4.0. | |
PET Packaging Market Analysis by Mordor Intelligence
The PET packaging market size was valued at USD 74.41 billion in 2025 and is forecasted to grow from USD 78.44 billion in 2026 to USD 102.25 billion by 2031, advancing at a CAGR of 5.44% during 2026-2031. The PET packaging market continues to benefit from its established role across beverage, food, pharmaceutical, and personal care supply chains, where clarity, barrier performance, and recyclability continue to support broad commercial use at scale. The recycled PET packaging segment is shifting from a compliance issue to a core sourcing priority as recycled-content rules enter enforcement cycles in Europe and North America. This is also shifting bargaining power toward players that can secure rPET supply, traceability, and processing access before mandate deadlines tighten further. At the same time, digital sorting systems and watermark-enabled packaging are beginning to reshape how packaging value is judged because sortability is becoming part of brand positioning and procurement decisions. Competition remains strongest among large converters that can pair light-weighting, recycled content, and supply integration, while margin pressure remains sensitive to feedstock disruptions and resin cost swings.
Key Report Takeaways
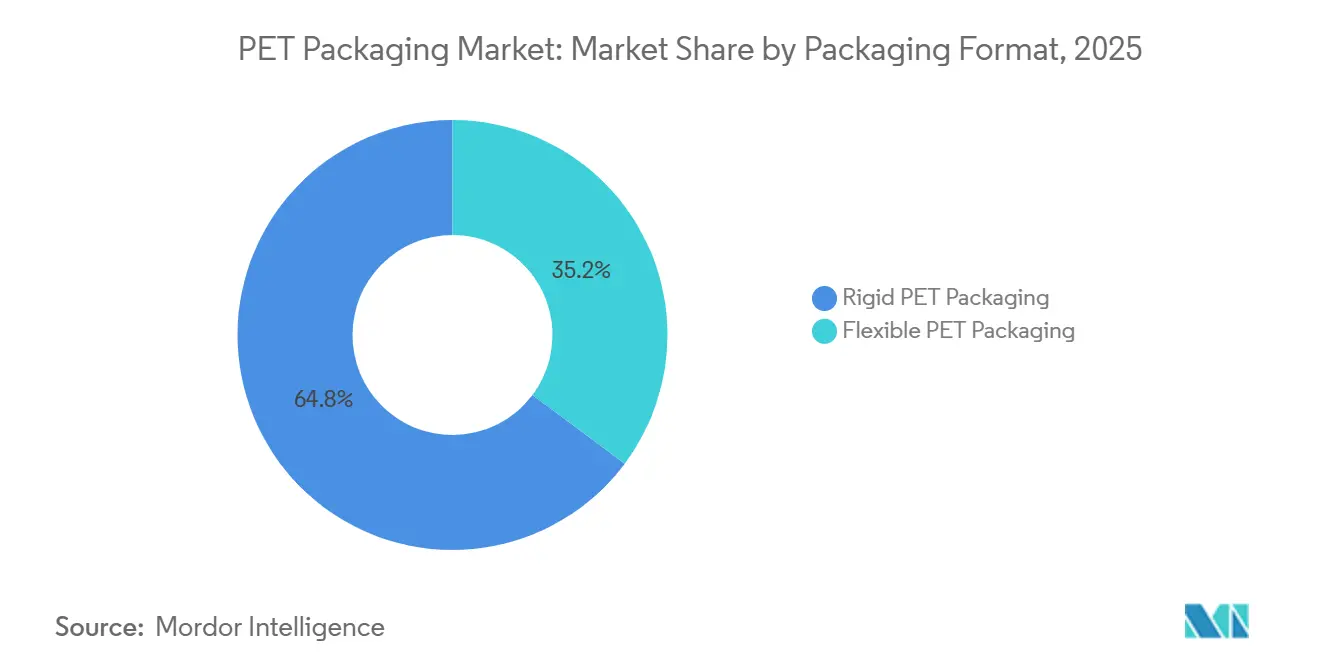
- By packaging format, rigid PET packaging held a 64.78% share in 2025 in the PET packaging market, while flexible PET packaging is forecasted to expand at 5.98% CAGR through 2031.
- By product type, bottles and jars held a 68.91% share in 2025, while pouches and sachets are projected to grow at 6.22% CAGR through 2031.
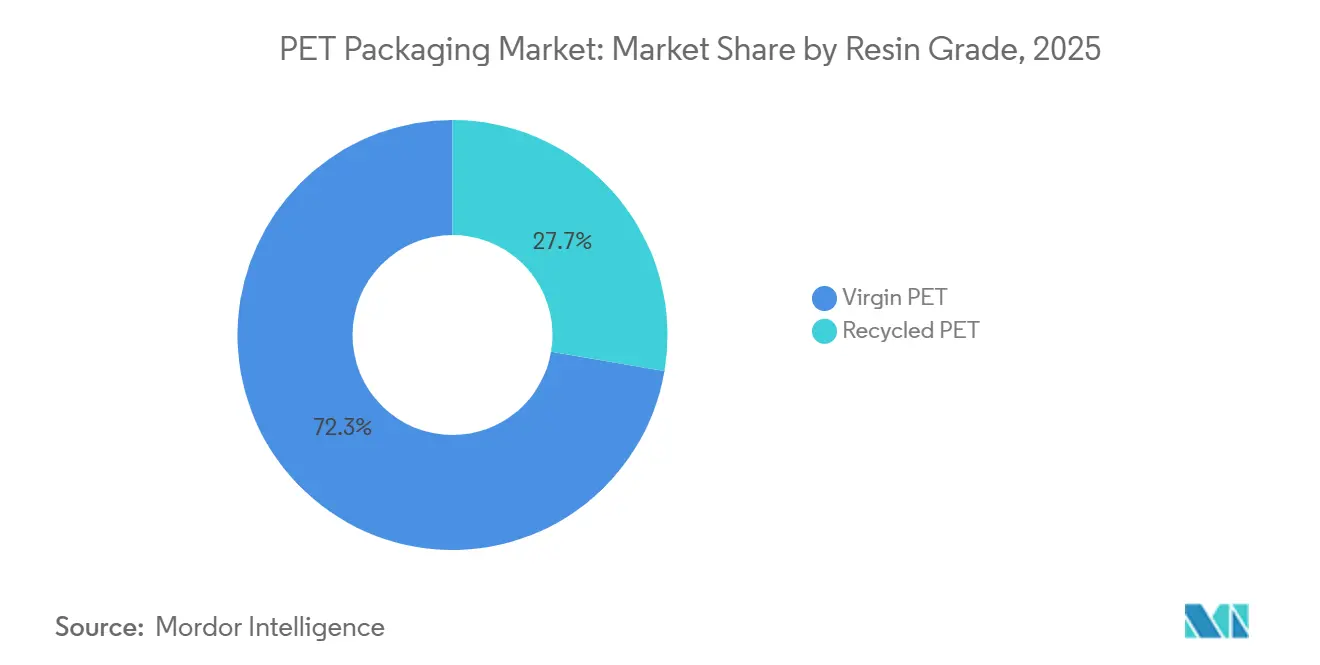
- By resin grade, virgin PET held a 72.33% share of the PET (Polyethylene Terephthalate) packaging market in 2025, while recycled PET is forecasted to grow at 5.80% CAGR through 2031.
- By end-user industry, food and beverage held a 59.74% share in 2025, while personal care and cosmetics are projected to advance at 6.51% CAGR through 2031.
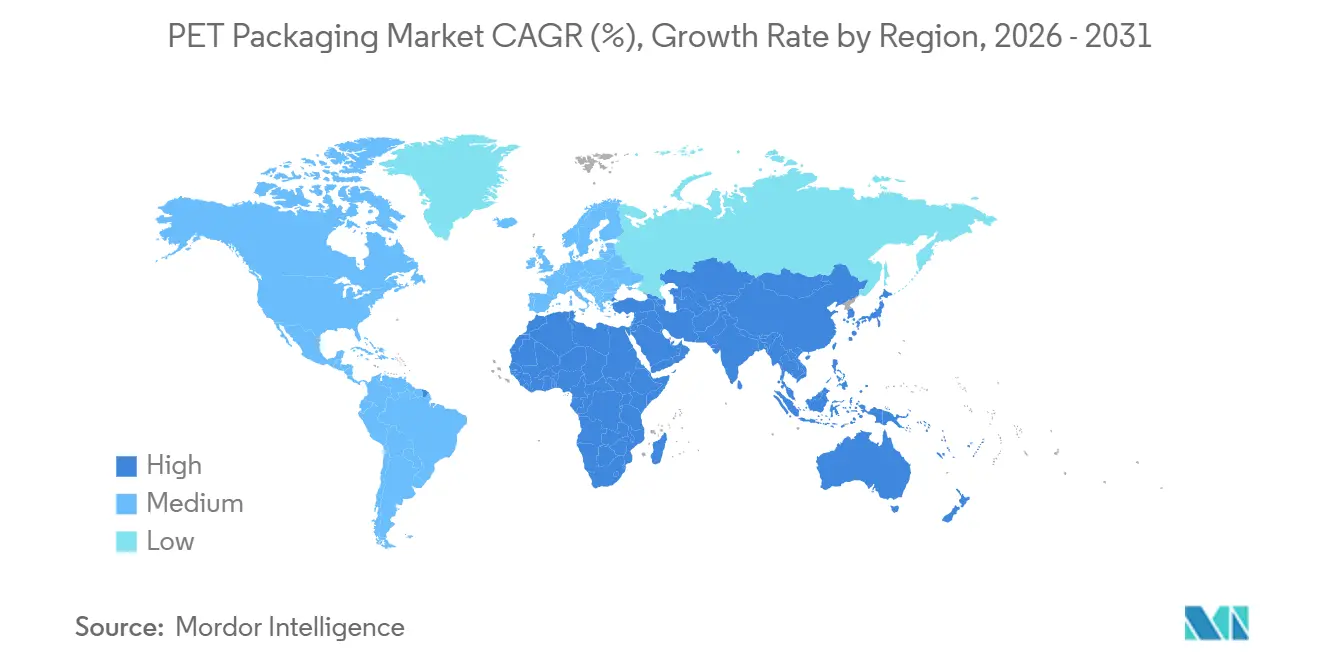
- By geography, the Asia-Pacific held a 47.38% share in 2025 and is forecasted to grow at 6.42% CAGR through 2031.
Note: Market size and forecast figures in this report are generated using Mordor Intelligence’s proprietary estimation framework, updated with the latest available data and insights as of 2026.
Global PET Packaging Market Trends and Insights
Drivers Impact Analysis*
| Driver | (~) % Impact on CAGR Forecast | Geographic Relevance | Impact Timeline |
|---|---|---|---|
| High Recyclability and Light-Weighting Advantage | +1.5% | Global | Long term (≥ 4 years) |
| Food-Grade Recycled PET Mandates in Europe and the United States | +1.2% | Europe, North America, spillover to Asia-Pacific | Medium term (2-4 years) |
| Expansion of Chemical Recycling Infrastructure | +0.9% | Europe, Asia-Pacific, North America | Long term (≥ 4 years) |
| E-Commerce Demand for Impact-Resistant Lightweight Packaging | +0.8% | Global, strongest in Asia-Pacific and North America | Medium term (2-4 years) |
| Integration of Digital Watermarking for Automated Sorting | +0.4% | Europe, early adoption in North America | Long term (≥ 4 years) |
| Adoption of Mono-Material PET Caps and Closures Enabling Bottle-to-Bottle Recycling | +0.3% | Europe, North America | Long term (≥ 4 years) |
| Source: Mordor Intelligence | |||
High Recyclability And Light-Weighting Advantage
The PET packaging market continues to gain from the way light-weighting and recyclability reinforce each other rather than compete with each other. Lower resin use reduces material cost and transport load, while the same package still fits into an established recycling stream in many end uses. This matters because commercial filling lines have already spent years optimizing PET bottle performance, especially in beverages where scale and line speed remain decisive. The regulatory position of food-contact recycling also favors PET because post-consumer mechanical PET recycling remains the only currently authorized route for recycled plastic materials intended for food contact under the relevant EU framework.[1]European Commission, “Regulation (EU) 2022/1616 of the European Parliament and of the Council on Recycled Plastic Materials and Articles Intended to Come into Contact With Food,” European Commission, eur-lex.europa.eu Procurement teams are therefore treating weight reduction less as a narrow cost exercise and more as a circular packaging requirement tied to contract renewal, portfolio compliance, and long-run supply stability. The PET packaging market is likely to keep benefiting from this dual advantage because few alternative substrates can match both material efficiency and closed-loop acceptance at a commercial scale.
Food-Grade Recycled PET Mandates In Europe And The United States
The PET packaging market is being pushed forward by rules that have already moved beyond policy intent and into enforceable timelines. In Europe, the Single-Use Plastics Directive required 25% recycled content in PET beverage bottles from January 2025, and the Packaging and Packaging Waste Regulation is expected to take recycled-content requirements further for contact-sensitive packaging by 2030 and 2040. In the United States, California AB 793 required 25% recycled content in beverage bottles from 2025 and set a 50% threshold for 2030.[2]California Legislature, “Assembly Bill 793, Solid Waste, Plastic Beverage Containers, Recycled Content,” California Legislature, legislature.ca.gov These staggered rules are forcing brand owners to sign longer offtake agreements earlier than they would under normal market conditions because waiting for spot supply is becoming a riskier strategy. That is shifting capital decisions across the PET packaging market toward recyclers, processors, and converters that can secure compliant food-grade rPET ahead of enforcement deadlines. The PET packaging market is also seeing spillover into Asia because suppliers that can meet Western food-contact standards are becoming more attractive export partners for global consumer brands.
Expansion Of Chemical Recycling Infrastructure
The PET packaging market is also being shaped by chemical recycling because mechanical recycling alone is unlikely to cover future mandate-driven demand for compliant rPET. Revalyu Resources commissioned a chemical PET recycling plant in Nashik, India, with a capacity of 280 tonnes per day and a stated investment of USD 100 million. The company also stated that the process delivers a 91% energy reduction versus conventional virgin PET production, which strengthens the case for sustainability-led sourcing when brand owners evaluate resin pathways. Chemical recycling matters most where colored, multilayer, and contaminated PET streams remain outside the practical reach of conventional recycling systems. That gives the PET packaging market a second supply route for virgin-equivalent material, which is important as recycled-content thresholds continue to rise. The PET packaging market is therefore likely to reward producers that can combine mechanical recovery, chemical processing, and reliable food-contact output rather than relying on a single recycling route.
E-Commerce Demand For Impact-Resistant Lightweight Packaging
The PET packaging market is gaining from the way e-commerce changes packaging needs across both rigid and flexible applications. Direct-to-consumer fulfillment exposes packs to more handling events, which raises the value of impact resistance, dimensional stability, and lower freight weight. That gives PET an advantage over glass in personal care, condiments, and other categories where product appearance still matters but breakage costs are harder to absorb in parcel networks. China is an important case because estimates indicate that online grocery sales exceeded 25% of total FMCG sales by late 2025, which supports demand for transit-capable packaging formats in a large consumer market. The PET packaging market is also benefiting from the way brands now use QR codes and digital identifiers on packs, turning packaging into both a logistics asset and a consumer data touchpoint. As online distribution grows, the PET packaging market should continue to see stronger demand for premium yet durable specifications that can travel well without raising weight or damage rates.
Restraints Impact Analysis*
| Restraint | (~) % Impact on CAGR Forecast | Geographic Relevance | Impact Timeline |
|---|---|---|---|
| Volatility in Virgin PET Resin Prices | -0.9% | Global | Short term (≤ 2 years) |
| Emerging Bans on Single-Use Sachets in Developing Countries | -0.6% | Asia-Pacific, Africa, Middle East | Medium term (2-4 years) |
| Supply Gap in Bottle-Grade rPET | -0.5% | North America, Europe, Asia-Pacific (India) | Medium term (2-4 years) |
| Consumer Shift Toward Plastic-Free Packaging Alternatives | -0.4% | North America, Europe | Long term (≥ 4 years) |
| Source: Mordor Intelligence | |||
Volatility In Virgin PET Resin Prices
The PET packaging market remains exposed to feedstock volatility because virgin PET economics are closely tied to purified terephthalic acid and monoethylene glycol. These inputs still shape converter margins, especially where procurement contracts lag changes in upstream pricing. Margin stress is most visible among smaller converters that lack long-term supply cover or integrated sourcing positions. In those cases, resin swings can erase pricing gains and make customer negotiations more difficult during the contract period. The PET packaging market is therefore seeing stronger pressure toward consolidation because larger players can spread raw material risk across scale, geography, and contract structure. This restraint does not change the long-run demand case for PET, but it does make near-term profitability less stable and rewards converters that can lock in feedstock access earlier.
Emerging Bans On Single-Use Sachets In Developing Countries
The PET packaging market faces a clear restraint from legislation aimed at small single-use sachets in developing economies. India moved this issue forward in April 2026 when the Food Safety and Standards Authority of India proposed a ban on plastic sachets for pan masala and gutkha, including polyester and other synthetic polymer formats. Nigeria also brought PET bottles and sachet water packaging into the scope of its inter-ministerial committee on single-use plastic bans in November 2025. This creates a difficult balance for converters because pouches and sachets still serve low-income consumer demand in several fast-growing markets. The PET packaging market can still grow in flexible applications, but capacity plans tied too heavily to sachet volume now carry more regulatory uncertainty than they did even one year earlier. That pressure is likely to redirect investment toward recyclable rigid formats and toward flexible PET solutions that can better align with future policy expectations.
*Our forecasts treat driver/restraint impacts as directional, not additive. The impact forecasts reflect baseline growth, mix effects, and variable interactions.
Segment Analysis
By Packaging Format: Rigid Scale Supports Flexible Momentum
Rigid PET packaging held 64.78% of the PET packaging market share in 2025, which shows how firmly the category is anchored in high-volume filling systems. Bottled water, carbonated drinks, and edible oils still rely on PET bottles because line speed, barrier performance, and collection systems have been built around them for decades. That makes material switching expensive, even when brand owners are under pressure to improve sustainability metrics. The PET packaging industry also benefits from the fact that rigid PET is already embedded in recovery systems that support bottle-to-bottle recycling in the most regulated markets. This structural advantage means rigid formats are likely to remain the volume base of the PET packaging market throughout the forecast period.
Flexible PET packaging is projected to grow at a 5.98% CAGR through 2031, which is faster than rigid PET packaging and points to widening end-use relevance. Growth is being supported by mono-material designs that are replacing non-recyclable multi-layer laminates in selected food and personal care applications. This is important because it expands PET into categories that had previously favored barrier combinations that were harder to recycle at scale. The PET packaging market is therefore seeing growth in flexible and rigid applications at the same time, rather than a simple shift from one format to the other. That balance supports broader capacity investment because converters can serve stable bottle demand while also chasing higher-growth flexible use cases. The PET packaging market should continue to reward suppliers that can link flexible innovation to recyclability claims that customers can verify in procurement processes.


By Product Type: Bottle Economics Hold While Sachets Carry Faster Growth
Bottles and jars accounted for a 68.91% share of the PET packaging market size in 2025, making them the clear anchor of product-level value. Their lead reflects the global beverage sector's long investment cycle in bottle-specific collection, sorting, and recycling infrastructure. This installed base keeps replacement risk low because competing formats would need to match cost, scale, and downstream compatibility at the same time. Bottles and jars also remain central in food, household, and pharmaceutical applications where product visibility and container integrity shape buying decisions. As a result, the PET packaging market still draws much of its current value from categories where bottles and jars remain the commercial default.
Pouches and sachets are forecasted to grow at a 6.22% CAGR through 2031, which keeps them as the fastest-growing product type in the PET packaging market. Their appeal remains strongest in low-income consumer markets where single-serve price points matter and distribution networks favor lightweight packaging. Preforms are also becoming more important in parts of Africa and the Middle East, where local blow-molding can be more economical than importing finished bottles. At the same time, the outlook for sachets is no longer straightforward because legislation in India and Nigeria has introduced a real policy overhang for this sub-segment. This means the PET packaging market still has room for sachet-led growth in the near term, but capacity built around that format now carries more medium-term risk than bottle-focused assets. Converters that can serve both affordable pack sizes and more regulation-ready formats will be better placed as the PET packaging market adapts to uneven policy enforcement across regions.
By Resin Grade: Virgin PET Keeps Scale While rPET Gains Priority
Virgin PET held a 72.33% share of the PET packaging market size in 2025, which shows that compliant food-contact rPET supply still falls short of demand. This balance is being shaped more by supply limitations than by any broad return to brand preference for virgin material. NAPCOR reported that the average recycled content in US PET beverage bottles was only 15.9% in 2024, which remained below California's 25% requirement for 2025.[3] That gap highlights how difficult it is to align collection, processing, and food-contact output with mandated recycled-content thresholds. The PET packaging market, therefore, still depends heavily on virgin resin in the near term, even as the long-run direction is shifting toward higher recycled content.
Recycled PET is forecasted to grow at a 5.80% CAGR through 2031, making it the fastest-growing resin grade in the PET packaging market. Demand is being reinforced by regulation, corporate sustainability commitments, and multi-year sourcing agreements that give vertically integrated recyclers stronger pricing power. India is becoming more important in this shift because UFlex launched an FSSAI-certified single-pellet rPET solution in June 2025 and backed it with an investment of INR 317 crore (USD 34.7 million) in its Noida recycling network. Revalyu Resources also expanded the supply conversation by commissioning its large chemical PET recycling plant in Nashik, which broadens the potential rPET base beyond the historic concentration in Western Europe and China. The PET packaging industry is therefore moving toward a more diversified recycling map, which should gradually improve supply security for buyers that need food-contact-grade rPET in Asia. Over time, the PET packaging market is likely to favor suppliers that can offer volume, compliance, and traceability together rather than recycled content alone.
By End-User Industry: Beverage Volume Stays Central While Beauty Lifts Growth
Food and beverage accounted for a 59.74% share of the PET packaging market size in 2025, which keeps this end-user group at the center of overall demand. Bottled water, carbonated drinks, edible oil, and condiments continue to rely on PET because the material supports clarity, oxygen-barrier performance, and efficient filling at scale. These uses also benefit from infrastructure that has already been designed around PET bottles, from preform production through to collection and recycling. That installed system gives the PET packaging market a strong base of recurring volume that is difficult for other substrates to displace during the forecast period. Pharmaceutical applications remain smaller in absolute terms, but they add stability and better margins because quality requirements tend to narrow the field of qualified suppliers.
The personal care and cosmetics segment is projected to grow at a 6.51% CAGR through 2031, which makes it the fastest-growing end-user segment in the PET packaging market. Growth is being supported by premiumization in Southeast Asia and the Gulf, along with the shift away from glass in e-commerce-oriented skincare and beauty formats. South Korea illustrates this direction because the Ministry of Food and Drug Safety reported cosmetics exports of KRW 10.2 trillion (USD 7.3 billion) in 2024, which points to a large export base that increasingly favors lighter and more durable packaging choices.[4]Ministry of Food and Drug Safety, Republic of Korea, “Cosmetics Export Statistics 2024,” Ministry of Food and Drug Safety, Republic of Korea, mfds.go.kr Household and industrial uses continue to add steady demand, especially in cleaning products, agrochemicals, and automotive fluids. These categories do not change the basic balance of the PET packaging market, but they widen the order base for converters across both mature and emerging economies. The PET packaging industry is therefore seeing value growth in beauty and personal care while beverage applications keep supporting the bulk of overall volume.
Geography Analysis
Asia-Pacific held 47.38% of the PET packaging market share in 2025, which kept it well ahead of every other region. The region is projected to grow at a 6.42% CAGR through 2031, which makes it the fastest-growing geography in the PET packaging market. China and India remain the main anchors because one combines a very large resin and packaging scale, while the other is expanding quickly across food processing and personal care manufacturing. India has become more important for recycled content planning because its FSSAI rule requires 30% recycled content in Category-1 rigid plastic packaging from FY2026. This is drawing more investment into domestic rPET capacity and strengthening the case for India as a future regional supply hub. Japan and South Korea continue to matter for higher-specification bottle development, especially in premium beverages and nutraceutical formats where barrier performance and design precision carry more weight.
Europe remains the most tightly regulated region in the PET packaging market, and this continues to shape demand, investment timing, and sourcing behavior. The EU Single-Use Plastics Directive already required 25% recycled content in PET beverage bottles from January 2025, while the Packaging and Packaging Waste Regulation began its application phase on August 12, 2026, and is expected to tighten recycled-content expectations further over time. The UK is adding separate cost pressure because its Plastic Packaging Tax rose to GBP 228.82 (USD 307.75) per tonne in 2026 for packs with less than 30% recycled content.[5]UK HM Revenue and Customs, “Plastic Packaging Tax, Rates, Reliefs, and Accounting,” HM Revenue and Customs, gov.uk These rules are increasing the demand for food-contact-grade rPET faster than the existing supply can comfortably support. North America is facing a related pattern because California AB 793 is pushing recycled-content compliance while converters also manage tighter sourcing conditions for domestic supply. The PET packaging market in these regions is therefore moving toward earlier contracting, more vertical integration, and stronger interest in traceable recycled supply.
Africa is anticipated to witness robust growth due to various factors like urbanization, retail formalization, and the move toward individually packaged consumer goods, which continue to support demand across the region. At the same time, policy action against some single-use formats is changing investment priorities, with Nigeria's regulatory process signaling more pressure on sachets and a stronger case for recoverable rigid PET formats. South America is expected to deliver moderate but steady expansion in bottled water, carbonated beverages, and edible oil, while the Middle East is balancing feedstock risk with local manufacturing investment that should reduce import dependence over time.

Competitive Landscape
The PET packaging market has a moderately concentrated top tier, but the wider field remains fragmented across many regional converters. Amcor, ALPLA Werke Alwin Lehner GmbH and Co KG, Silgan Holdings, and other multi-regional players hold scale advantages in procurement, customer reach, and technical execution. Even so, the PET packaging market still leaves room for many mid-sized and local manufacturers, especially in India, Turkey, Africa, and parts of South America, where regional demand and lower transport costs support localized production. This mix keeps competition active because global scale matters in strategic accounts, while regional flexibility still matters in day-to-day supply. Silgan's FY2025 annual report showed how attractive value-added packaging formats can be, with its dispensing and closures segment generating 55% of group EBITDA against total net sales of USD 6.5 billion.
Strategic differentiation in the PET packaging market is moving away from pure unit cost and toward capabilities that customers can tie to compliance and supply security. Amcor reported Q3 FY2026 net sales of USD 5,914 million and stated that the Berry Global integration supported a major increase in scale, while management reaffirmed targeted synergies of USD 650 million through FY2028. That matters because larger integrated platforms can negotiate resin, invest in recycling partnerships, and standardize sustainability claims across more customer contracts. UFlex also took a meaningful step in June 2025 when it launched an FSSAI-certified single-pellet rPET solution and backed it with an investment of INR 317 crore (USD 34.7 million) in its Noida recycling network. Digimarc Recycle added a different type of strategic move when commercial deployment was validated after HolyGrail 2.0 trials, showing that sortation technology is becoming part of the competitive equation for PET packaging rather than a separate downstream issue.
The PET packaging market is also opening space for players that can combine traceability, recycled feedstock access, and compliant output without relying only on packaging conversion margins. This is why recyclers, watermarking technology providers, and resin specialists are becoming more important in competitive positioning across the PET packaging market. Regional challengers still have room to win business through cost and customer intimacy, but they face a tougher path when large buyers want guaranteed recycled content, documented food-contact suitability, and long-term delivery commitments. Overall, the PET packaging market remains competitive and investable, but the strongest positions increasingly belong to firms that can connect packaging design, recycling access, and regulatory readiness inside one commercial offer.
PET Packaging Industry Leaders
Amcor plc
Resilux NV
ALPLA Werke Alwin Lehner GmbH and Co KG
Silgan Holdings Inc.
Graham Packaging Company LP
- *Disclaimer: Major Players sorted in no particular order

Recent Industry Developments
- January 2026: Gerolsteiner Brunnen launched a 1-liter reusable PET bottle with 50% rPET, extending refill cycles to 25 and saving 1,900 tonnes of CO₂ annually.
- January 2026: ALPLA reported EUR 5.2 billion (USD 5.88 billion) turnover for fiscal 2025 and committed EUR 15 million (USD 16.95 million) annually from 2026 to lift recycling capacity to 700,000 tonnes.
- December 2025: CARBIOS and Wankai New Materials finalized a shareholders’ agreement for a EUR 115 million (USD 129.95 million) 50,000-tonne PET biorecycling plant in Haining, China, slated for Q1 2027.
- September 2025: Eastman and Doloop unveiled a 100% rPET bottle at Drinktec 2025, produced from chemically recycled Eastar Renew EN031 resin.
- June 2025: UFlex launched its FSSAI-certified single-pellet rPET solution for food-contact applications, supported by an INR 317 crore (USD 34.7 million) investment in its Noida recycling plant network to scale domestic rPET supply capacity in India.


Global PET Packaging Market Report Scope
The PET packaging market refers to the industry focused on the production and commercialization of polyethylene terephthalate (PET)-based packaging solutions designed for lightweight, durable, and recyclable packaging applications across consumer and industrial sectors.
The PET Packaging Market Report is segmented by Packaging Format (Rigid PET Packaging and Flexible PET Packaging), Product Type (Bottles and Jars, Pouches and Sachets, Trays and Clamshells, Lids, Caps and Closures, and Preforms and Other Product Types), Resin Grade (Virgin PET and Recycled PET), End-User Industry (Food and Beverage, Pharmaceuticals, Personal Care and Cosmetics, Household, Industrial Goods, and Other End-User Industries), and Geography (North America [United States, Canada, and Mexico], South America [Brazil, Argentina, and the Rest of South America], Europe [United Kingdom, Germany, France, Italy, and the Rest of Europe], Asia-Pacific [China, Japan, India, South Korea, and the Rest of Asia-Pacific], and Middle East and Africa [Middle East (United Arab Emirates, Saudi Arabia, and the Rest of the Middle East) and Africa (South Africa, Egypt, and the Rest of Africa)]). Market forecasts are provided in terms of value (USD).
| Rigid PET Packaging |
| Flexible PET Packaging |
| Bottles and Jars |
| Pouches and Sachets |
| Trays and Clamshells |
| Lids-Caps and Closures |
| Preforms and Other Product Types |
| Virgin PET |
| Recycled PET |
| Food and Beverage |
| Pharmaceuticals |
| Personal Care and Cosmetics |
| Household |
| Industrial Goods |
| Other End-User Industries |
| North America | United States | |
| Canada | ||
| Mexico | ||
| South America | Brazil | |
| Argentina | ||
| Rest of South America | ||
| Europe | United Kingdom | |
| Germany | ||
| France | ||
| Italy | ||
| Rest of Europe | ||
| Asia-Pacific | China | |
| Japan | ||
| India | ||
| South Korea | ||
| Rest of Asia-Pacific | ||
| Middle East and Africa | Middle East | United Arab Emirates |
| Saudi Arabia | ||
| Rest of the Middle East | ||
| Africa | South Africa | |
| Egypt | ||
| Rest of Africa | ||
| By Packaging Format | Rigid PET Packaging | ||
| Flexible PET Packaging | |||
| By Product Type | Bottles and Jars | ||
| Pouches and Sachets | |||
| Trays and Clamshells | |||
| Lids-Caps and Closures | |||
| Preforms and Other Product Types | |||
| By Resin Grade | Virgin PET | ||
| Recycled PET | |||
| By End-User Industry | Food and Beverage | ||
| Pharmaceuticals | |||
| Personal Care and Cosmetics | |||
| Household | |||
| Industrial Goods | |||
| Other End-User Industries | |||
| By Geography | North America | United States | |
| Canada | |||
| Mexico | |||
| South America | Brazil | ||
| Argentina | |||
| Rest of South America | |||
| Europe | United Kingdom | ||
| Germany | |||
| France | |||
| Italy | |||
| Rest of Europe | |||
| Asia-Pacific | China | ||
| Japan | |||
| India | |||
| South Korea | |||
| Rest of Asia-Pacific | |||
| Middle East and Africa | Middle East | United Arab Emirates | |
| Saudi Arabia | |||
| Rest of the Middle East | |||
| Africa | South Africa | ||
| Egypt | |||
| Rest of Africa | |||


Key Questions Answered in the Report
What is the current size and forecast outlook for the PET packaging market?
The PET packaging market was valued at USD 74.41 billion in 2025 and is forecasted to reach USD 102.25 billion by 2031 at a 5.44% CAGR during 2026-2031.
Which region leads PET packaging demand worldwide?
Asia-Pacific led with a 47.38% revenue share in 2025, supported by large beverage, food, and personal care manufacturing bases across China and India.
Which resin grade is growing the fastest through 2031?
Recycled PET is the fastest-growing resin grade, with a projected 5.80% CAGR, supported by recycled-content mandates and growing recycling investment.
Why does food and beverage remain the largest end-user segment for PET packaging?
Food and beverage held 59.74% of 2025 revenue because PET remains well suited to bottled water, carbonated drinks, edible oil, and condiments that require scale, clarity, and filling efficiency.
Which product format is expanding the fastest in this space?
Pouches and sachets are projected to grow at 6.22% CAGR through 2031, although their outlook is now tempered by tighter regulation in some developing countries.
What is shaping competition among PET packaging companies?
Competition is increasingly centered on rPET supply access, light-weighting, traceability, and the ability to meet regulatory compliance rather than on price alone.
Page last updated on:


