Pet Care E-commerce Market Size and Share
Market Overview
| Study Period | 2019 - 2030 |
|---|---|
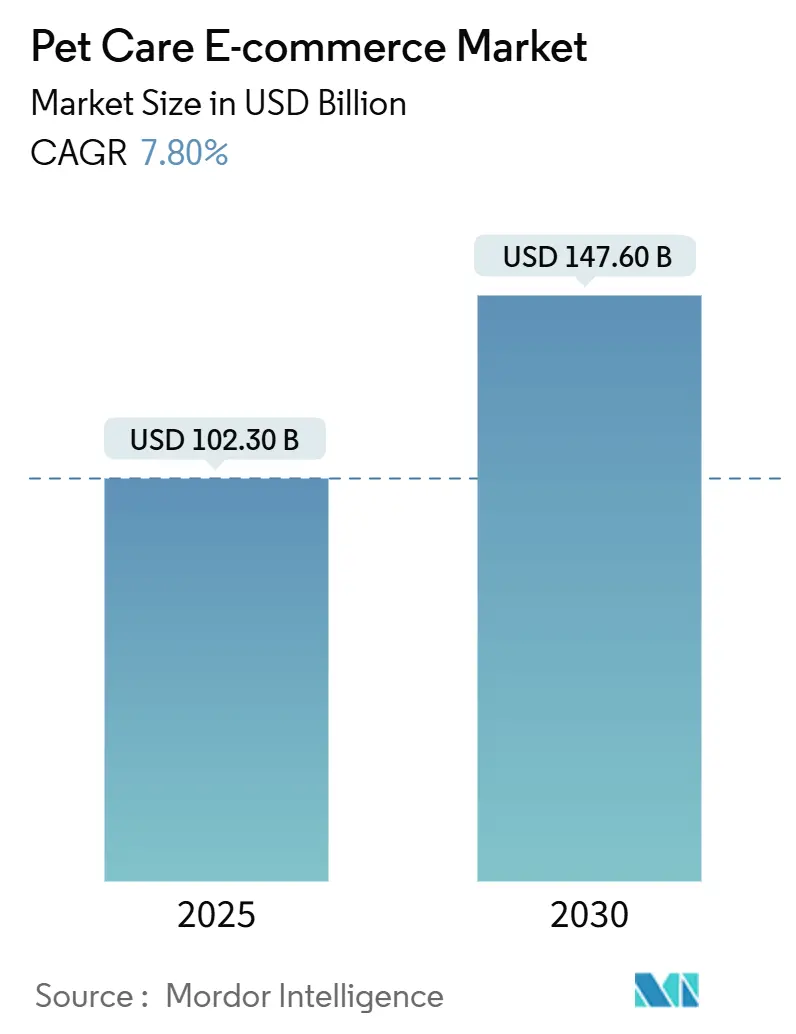
| Market Size (2025) | USD 102.30 Billion |
| Market Size (2030) | USD 147.60 Billion |
| Growth Rate (2025 - 2030) | 7.80% CAGR |
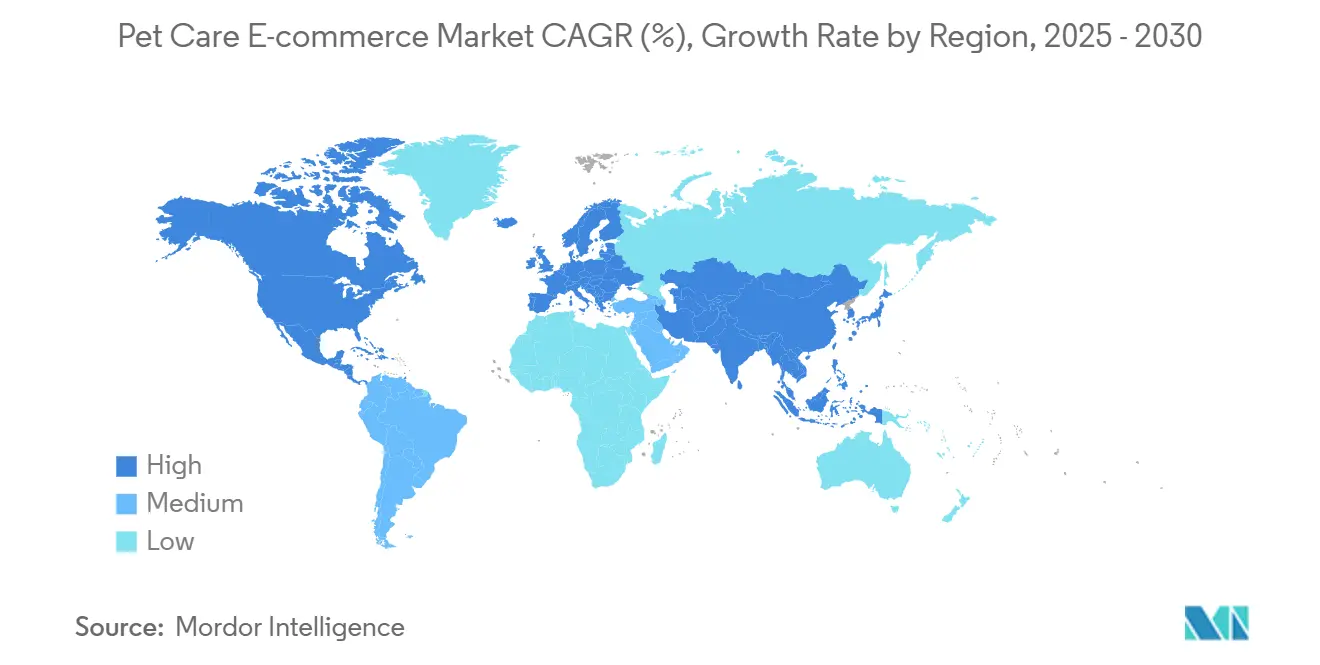
| Fastest Growing Market | Asia Pacific |
| Largest Market | North America |
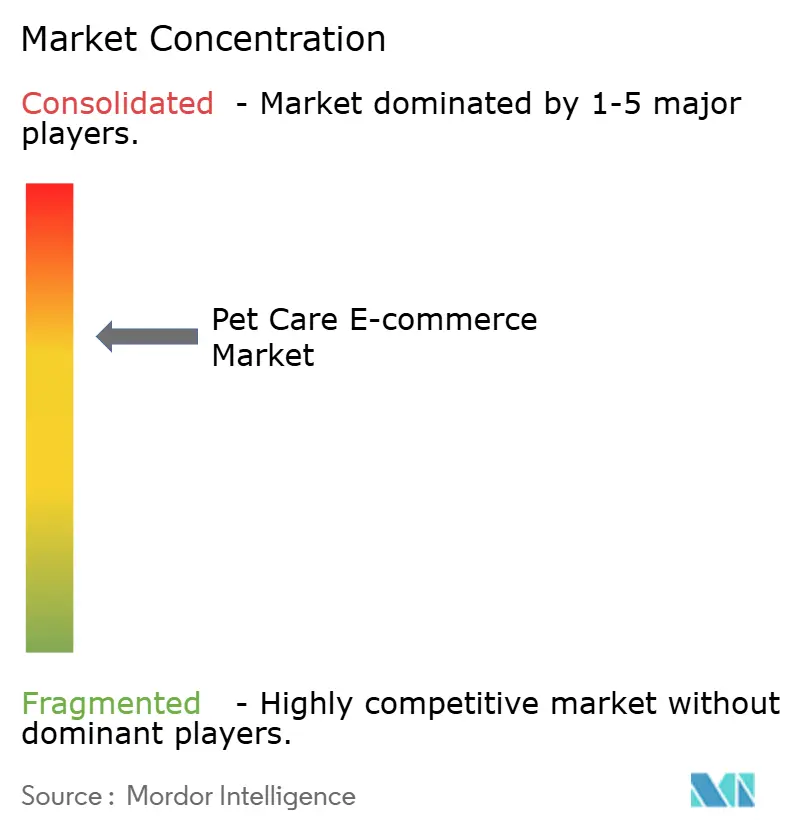
| Market Concentration | Medium |
Major Players *Disclaimer: Major Players sorted in no particular order Image © Mordor Intelligence. Reuse requires attribution under CC BY 4.0. | |
Pet Care E-commerce Market Analysis by Mordor Intelligence
The pet care e-commerce market size stood at USD 102.3 billion in 2025 and is forecast to reach USD 147.6 billion in 2030, advancing at a 7.8% CAGR over the period. Strong digital adoption, the resilience of premium pet spending, and rapid subscription uptake underpin this growth. Consumers continue to regard pets as family, keeping discretionary pet budgets intact even during macroeconomic headwinds, as reflected by 80% of Chinese owners who maintained or lifted spending after the pandemic. North America currently generates the highest revenues, while Asia Pacific accelerates fastest, owing to rising urban pet populations and smartphone penetration. Competitive intensity intensifies as legacy retailers push omnichannel veterinary services and pure-play specialists deepen autoship programs. Structural opportunities emerge in telehealth, AI-guided nutrition, and recyclable packaging, partly offsetting pressures from last-mile logistics and marketplace price wars.
Key Report Takeaways
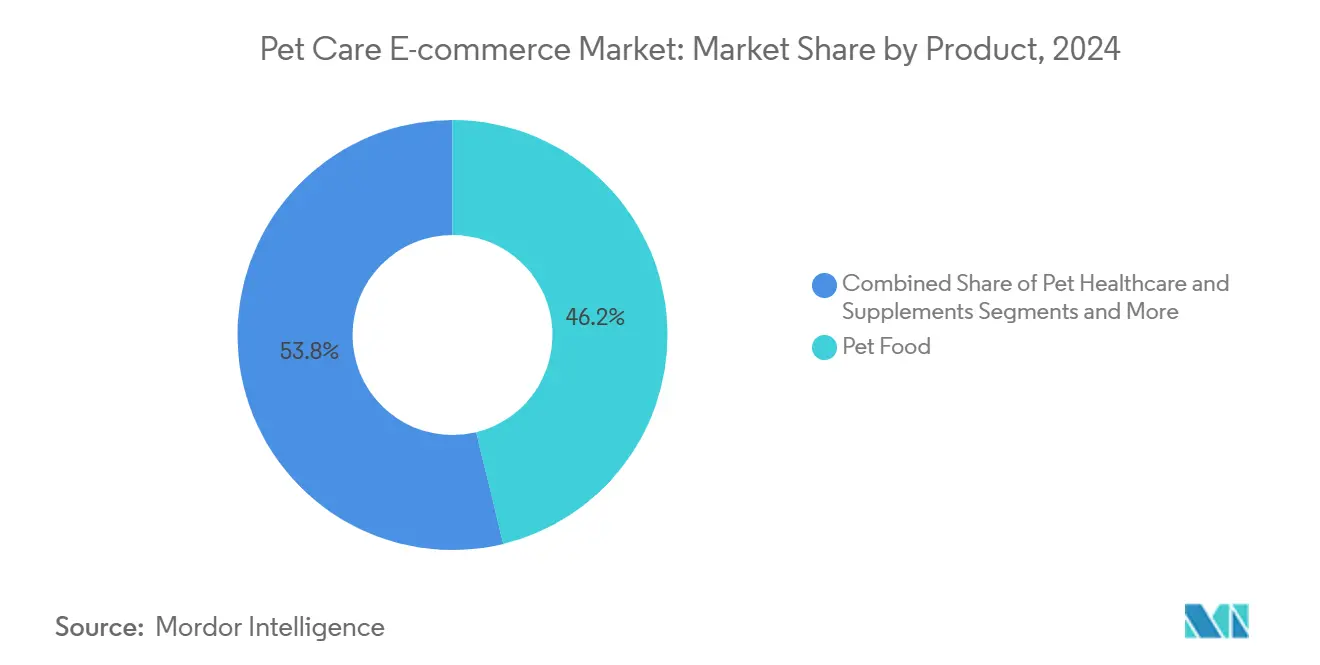
- By product type, pet food accounted for 46.2% of the pet care e-commerce market share in 2024 while healthcare & supplements recorded the highest 12.8% CAGR through 2030.
- By pet type, dogs held 56.5% of the pet care e-commerce market size in 2024, whereas cats are projected to expand at a 9.4% CAGR to 2030.
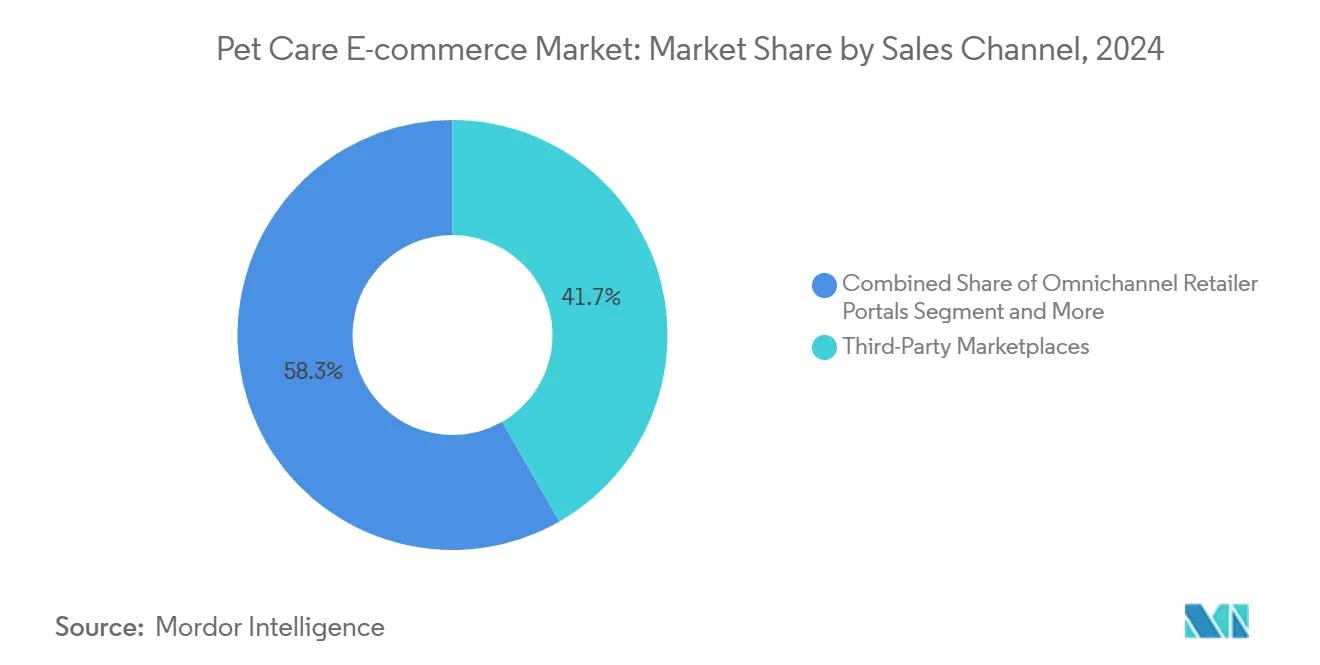
- By sales channel, third-party marketplaces led with 41.7% revenue share in 2024, while subscription box services posted the fastest 14.9% CAGR through 2030.
- By geography, North America contributed 38.2% of 2024 sales, yet Asia Pacific is advancing at a 10.8% CAGR to 2030.
Global Pet Care E-commerce Market Trends and Insights
Drivers Impact Analysis*
| Driver | (~) % Impact on CAGR Forecast | Geographic Relevance | Impact Timeline |
|---|---|---|---|
| Rising Pet-Humanization Boosting Online Spend | +2.10% | Global, strongest in North America & Asia Pacific | Long term (≥ 4 years) |
| Smartphone & Broadband Proliferation | +1.80% | Asia Pacific core, spill-over to Latin America | Medium term (2-4 years) |
| Subscription / Autoship Convenience | +1.40% | North America & Europe, expanding to APAC | Short term (≤ 2 years) |
| AI-Driven Personalized Nutrition Upsell | +0.90% | North America & China, early adoption markets | Medium term (2-4 years) |
| Omnichannel Expansion By Retailers | +0.70% | North America & Europe, mature retail markets | Medium term (2-4 years) |
| Vet-Linked Telehealth Commerce Bundles | +0.60% | North America lead, Europe following | Long term (≥ 4 years) |
| Source: Mordor Intelligence | |||
Rising Pet-Humanization Boosting Online Spend
Consumers increasingly treat pets as family members, elevating demand for premium products and digital convenience. Millennials and Gen Z constitute nearly half of Chinese owners and favor fresh formats that saw 86% dogfood and 54% cat-food growth since 2021. Healthcare spending is set to reach USD 1,445 per U.S. household by 2026, reinforcing durable wallet share. European markets echo with this pattern through wellness supplements and recyclable packaging priorities. These behaviors remain resilient in downturns, cementing a long-run growth floor for the pet care e-commerce market.
Smartphone & Broadband Proliferation
Mobile connectivity unlocks underserved demographics, especially in Asia Pacific, where many households leapfrog store-based retail. China exemplifies this evolution with e-commerce as the dominant purchase route among millennials. Cross-border platforms streamline import complexity, while IoT collars integrate automated re-ordering. In Latin America, MercadoLibre spans 18 countries and 650 million consumers, offering ready logistics rail for pet brands. Fintech tie-ins widen premium access among the underbanked.
Subscription / Autoship Convenience
Autoship models convert periodic purchases into predictable flows. Chewy generated 80% of Q4 2024 sales from subscription customers, with USD 2.62 billion contribution. The Farmer’s Dog surpassed USD 1 billion annualized revenue using tailored meal plans shipped direct. Subscription users cut in-store trips by 53%, cementing digital loyalty. The model also penetrates rural zones that lack specialty outlets.
AI-Driven Personalized Nutrition Upsell
Artificial intelligence transforms one-size-fits-all feeding into data-led wellness. Mars Petcare earmarked USD 1 billion over three years for AI that refines nutrition algorithms. Ollie’s DIG Labs acquisition embeds diagnostics that recommend bespoke diets, while predictive analytics flag early health issues and cross-sell supplements. Premium pricing and longer customer lifetimes follow, enhancing the pet care e-commerce market’s margin outlook.
Restraints Impact Analysis*
| Restraint | (~) % Impact on CAGR Forecast | Geographic Relevance | Impact Timeline |
|---|---|---|---|
| High last-mile logistics cost for bulky items | -1.20% | Global, acute rural North America & Europe | Short term (≤ 2 years) |
| Margin squeeze from marketplace price wars | -0.80% | North America & Europe, emerging APAC | Medium term (2-4 years) |
| Tightening cross-border pet-food regulations | -0.50% | Global, China-US corridors | Medium term (2-4 years) |
| Sustainability scrutiny of shipment packaging | -0.30% | Europe lead, others following | Long term (≥ 4 years) |
| Source: Mordor Intelligence | |||
High Last-Mile Logistics Cost For Bulky Items
Heavy kibble and litter intensify delivery costs as driver shortages and infrastructure gaps raise fulfillment expenses.[1]Pet Food Processing Staff, “Transportation challenges causing a ripple effect in the pet food supply chain,” Pet Food Processing, petfoodprocessing.net Minimum-order thresholds and regional distribution hubs offer relief, but capital intensity favors large players. Dependence on imported micronutrients adds volatility, amplifying cost unpredictability.
Margin Squeeze From Marketplace Price Wars
Algorithm-driven marketplaces reward lowest price, compressing brand margins. Amazon’s USD 325 billion third-party platform enforces radical transparency. Commission fees and paid search further erode profitability, evidenced by Petco’s share decline despite revenue efforts. Premium vendors counter with exclusive formulations and service bundles to maintain value perception.
*Our forecasts treat driver/restraint impacts as directional, not additive. The impact forecasts reflect baseline growth, mix effects, and variable interactions.
Segment Analysis
By Product Type: Healthcare Supplements Drive Premium Shift
Pet food retained 46.2% of 2024 revenue, anchoring the pet care e-commerce market. The healthcare & supplement segment, however, is set to grow at 12.8% CAGR, fueled by owners who see nutrition as preventive medicine.[2]Lisa Cleaver, “Report: E-Commerce pet food sales projected to surpass US$21 billion in 2024,” Pet Food Industry, petfoodindustry.com Within the pet care e-commerce market size, fresh dog diets rose 86% and fresh cat diets 54% since 2021, validating premium appetite. Treats and chews enjoy steady demand, while grooming solutions gain from professional-service tie-ins.
The healthcare surge aligns with veterinary outlays becoming the second-largest spend category. Functional natural products, single-ingredient treats, and emerging plant-based recipes meet transparency and sustainability preferences. As this mix shifts, the pet care e-commerce market share of supplements is likely to widen, supported by algorithms that target condition-specific upsells.


By Pet Type: Cat Economy Accelerates Urban Growth
Dogs contributed 56.5% of 2024 sales, but cats will post 9.4% CAGR to 2030 amid apartment living and lower walk requirements. Cat-centric innovation now ranges from urinary-health kibble to odor-reducing litter, expanding the pet care e-commerce market size for felines. Birds, fish, small mammals, and reptiles form niche segments with high per-unit pricing despite lower volume.
China’s “cat economy” captures media attention as owners prioritize premium fresh formats. Subscription clubs for exotic pets also emerge, offering curated diets that deepen engagement. These dynamics suggest the pet care e-commerce market share of cats will continue to climb, diversifying category revenue streams.
By Sales Channel: Subscription Services Reshape Shopping Patterns
Third-party marketplaces delivered 41.7% of 2024 turnover thanks to vast reach and integrated fulfillment. Subscription boxes, however, are advancing at 14.9% CAGR and are expected to lift their slice of the pet care e-commerce market considerably. Autoship programs capture repeat spend and lock in data that fuels personalization.
Pure-play specialists like Chewy leverage best-in-class service to widen loyalty, while direct-to-consumer brands use rich storytelling and AI guidance. Omnichannel retailers chase parity by integrating store pickup, telehealth, and loyalty perks. Despite rising ad costs, the subscription format drives stable cash flows that strengthen valuations across the pet care e-commerce industry.
Geography Analysis
North America generated 38.2% of global revenue in 2024, supported by high per-household spend and mature logistics. Autoship penetration tops global averages, and companies expand veterinary clinics to tap the USD 40 billion healthcare pool. Yet market maturity slows topline expansion and intensifies promotions.
Asia Pacific is the fastest mover with 10.8% CAGR to 2030. China’s pet economy surpassed 300 billion yuan in 2024 and benefits from cross-border e-commerce frameworks, while India’s online segment shows 17.1% CAGR potential. Digital natives, urban density, and regulatory modernization, such as China’s 2024 import rules, breathe momentum into the regional pet care e-commerce market.
Europe advances steadily on premium and sustainability themes, with EUR 29.1 billion pet-food turnover and 5.1% annual growth. Eco-friendly packaging resonates, endorsed by 95% of owners. Latin America trails but demonstrates upside, evidenced by Brazil’s 5.6% volume growth, while Middle East and Africa remain nascent yet promising as digital infrastructure scales.

Competitive Landscape
The pet care e-commerce market exhibits moderate fragmentation. Chewy’s USD 11.86 billion 2024 revenue underscores specialist dominance, yet Amazon’s scale exerts pricing pressure. Legacy retailers such as Walmart deploy vet clinics and telehealth to defend their share. Technology investment defines advantage; Mars Petcare’s USD 1 billion AI plan illustrates capital barriers to entry.
Direct-to-consumer disruptors like The Farmer’s Dog have surpassed USD 1 billion in sales by narrowing their focus on fresh meals. Consolidation accelerates as General Mills acquires Whitebridge for USD 1.45 billion to deepen premium cat nutrition.[3]Pet Food Processing Staff, “General Mills scoops up Whitebridge Pet Brands for $1.45 billion,” Pet Food Processing, petfoodprocessing.net Telehealth tie-ups, such as PetMed Express partnering with Dutch, extend value beyond product to holistic care.
Pet Care E-commerce Industry Leaders
Amazon.com, Inc.
Chewy, Inc.
Petco Health & Wellness Co., Inc.
PetSmart, Inc.
Zooplus SE
- *Disclaimer: Major Players sorted in no particular order

Recent Industry Developments
- October 2024: Walmart opened five veterinary and grooming centers in Arizona and Georgia and added telehealth for Walmart+ members, aligning with yearly household pet-spend estimates of USD 1,445.
- October 2024: Mars Petcare earmarked USD 1 billion over three years for AI and digital projects, allocating 70% to technology and talent that support personalized nutrition tools.
- January 2024: General Mills bought Whitebridge Pet Brands for USD 1.45 billion, adding premium labels Tiki Pets and Cloud Star.


Global Pet Care E-commerce Market Report Scope
| Pet Food |
| Pet Treats & Chews |
| Pet Healthcare & Supplements |
| Grooming Products |
| Toys & Accessories |
| Dogs |
| Cats |
| Birds |
| Fish & Aquatics |
| Small Mammals |
| Reptiles & Amphibians |
| Third-Party Marketplaces |
| Pure-play E-tailers |
| Omnichannel Retailer Portals |
| Direct-to-Consumer Brand Sites |
| Subscription Box Services |
| North America | United States |
| Canada | |
| Mexico | |
| Europe | Germany |
| United Kingdom | |
| France | |
| Italy | |
| Spain | |
| Rest of Europe | |
| Asia Pacific | China |
| Japan | |
| India | |
| South Korea | |
| Australia | |
| Rest of Asia Pacific | |
| Middle East & Africa | GCC |
| South Africa | |
| Rest of Middle East & Africa | |
| South America | Brazil |
| Argentina | |
| Rest of South America |
| By Product Type | Pet Food | |
| Pet Treats & Chews | ||
| Pet Healthcare & Supplements | ||
| Grooming Products | ||
| Toys & Accessories | ||
| By Pet Type | Dogs | |
| Cats | ||
| Birds | ||
| Fish & Aquatics | ||
| Small Mammals | ||
| Reptiles & Amphibians | ||
| By Sales Channel | Third-Party Marketplaces | |
| Pure-play E-tailers | ||
| Omnichannel Retailer Portals | ||
| Direct-to-Consumer Brand Sites | ||
| Subscription Box Services | ||
| By Geography | North America | United States |
| Canada | ||
| Mexico | ||
| Europe | Germany | |
| United Kingdom | ||
| France | ||
| Italy | ||
| Spain | ||
| Rest of Europe | ||
| Asia Pacific | China | |
| Japan | ||
| India | ||
| South Korea | ||
| Australia | ||
| Rest of Asia Pacific | ||
| Middle East & Africa | GCC | |
| South Africa | ||
| Rest of Middle East & Africa | ||
| South America | Brazil | |
| Argentina | ||
| Rest of South America | ||


Key Questions Answered in the Report
How fast is online pet spending expected to grow through 2030?
Sales are projected to rise from USD 102.3 billion in 2025 to USD 147.6 billion in 2030 at a 7.8% CAGR.
Which region shows the strongest growth momentum?
Asia Pacific leads with a forecast 10.8% CAGR as urban pet ownership and smartphone commerce expand quickly.
Why are subscription models critical for pet retailers?
Autoship customers account for up to 80% of sales at leading platforms, improving retention and lowering acquisition costs.
What product segment is gaining share fastest?
Healthcare and supplements are set to grow at 12.8% CAGR as owners adopt preventive wellness routines.
What logistics barrier challenges online pet retailers most?
High last-mile delivery costs for heavy items such as kibble and litter continue to squeeze margins, especially in rural zones.
Page last updated on:


