Pet Tech Market Size and Share
Pet Tech Market Analysis by Mordor Intelligence
Note: Market size and forecast figures in this report are generated using Mordor Intelligence’s proprietary estimation framework, updated with the latest available data and insights as of January 2026.
Global Pet Tech Market Trends and Insights
Drivers Impact Analysis*
| Driver | (~) % Impact on CAGR Forecast | Geographic Relevance | Impact Timeline |
|---|---|---|---|
| Rising pet-humanization & willingness to spend on connected devices | +3.2% | Global, strongest in North America & Europe | Long term (≥ 4 years) |
| IoT & AI integration across wearables and smart-home ecosystems | +2.8% | North America & APAC core, spill-over to Europe | Medium term (2-4 years) |
| Growth in pet insurance & tele-vet services generating data demand | +2.1% | North America & EU, expanding to APAC | Medium term (2-4 years) |
| Smart-home interoperability standards (Matter, UWB) boosting device uptake | +1.9% | Global, led by North America tech adoption | Short term (≤ 2 years) |
| Subscription-based predictive-analytics wellness platforms | +1.7% | North America & Europe, emerging in APAC | Long term (≥ 4 years) |
| Mandated micro-chipping & traceability rules in emerging markets | +1.4% | Europe & APAC, selective enforcement in Americas | Medium term (2-4 years) |
| Source: Mordor Intelligence | |||
Rising Pet-Humanization & Willingness to Spend on Connected Devices
Households increasingly view pets as family members, and that emotional bond raises willingness to pay for smart collars, litter systems, and tele-vet subscriptions. During the pandemic many first-time owners entered the Pet Tech market and retained connected products even after restrictions eased. Across Asia, pet ownership rates exceed 70% in major urban centers, and disposable-income growth supports premium device demand. Owners prioritize early illness detection over episodic clinic visits, allowing brands to position AI-enabled health insights at higher margins. In China more than 120 million pets drive spending on advanced nutrition and health monitoring. This mindset shift underpins sustained long-term growth, thereby driving the pet tech market.
IoT & AI Integration Across Wearables and Smart-Home Ecosystems
Modern smart collars process up to 150 motion readings per second and compare outputs against anonymized databases to flag anomalies. Fi’s Series 3+ collar now detects scratching, licking, and hydration patterns, illustrating how machine learning converts raw accelerometer data into actionable health alerts. As Matter and UWB deliver seamless connectivity, collars, feeders, and litter boxes communicate with thermostats and voice assistants to tailor feeding schedules or temperature settings. Clinical validation is growing; one peer-reviewed study reported 87.5% concordance between AI predictions and veterinarian assessments.[1]Seon-Chil Kim and Sanghyun Kim, “Development of a Dog Health Score Using an AI Disease Prediction Algorithm Based on Multifaceted Data,” Animals, doi.org These ecosystem effects strengthen platform lock-in and raise switching costs, deepening customer engagement within the Pet Tech market.
Growth in Pet Insurance & Tele-Vet Services Generating Data Demand
Insurers and tele-health operators increasingly offer discounts for owners who share wearable data. PetMed Express teamed with Dutch to provide 24/7 virtual consultation across 34 states, creating new demand for continuous monitoring streams.[2]PetMed Express, “PetMed Express and Dutch Announce Partnership,” PetMed Express, investors.petmeds.com Forty percent of U.S. owners now use tele-vet portals at least once per year, and those interactions rely on precise behavioral and vitals data. Synchrony’s integration of CareCredit with Pets Best simplifies reimbursement while channeling transaction records into underwriting models. Data-sharing loops improve risk scoring and claim validation, reinforcing adoption among cost-conscious owners.
Smart-Home Interoperability Standards (Matter, UWB) Boosting Device Uptake
Multi-vendor compatibility has long hampered the Pet Tech market, but Matter eliminates redundant hubs by letting Apple, Google, and Samsung devices interoperate. U-tech’s UWB-enabled door lock demonstrates centimeter-level tracking for indoor pets, reducing battery drain relative to GPS beacons. Matter 1.4 further simplifies multi-admin configurations, ensuring every household member receives device alerts. Lower technical barriers encourage first-time buyers and let manufacturers redirect R&D budgets toward differentiated analytics rather than proprietary signal stacks.
Restraints Impact Analysis*
| Restraint | (~) % Impact on CAGR Forecast | Geographic Relevance | Impact Timeline |
|---|---|---|---|
| High upfront cost & unclear ROI for average pet owners | -2.1% | Global, most pronounced in price-sensitive markets | Short term (≤ 2 years) |
| Battery-life & durability limitations of wearables | -1.8% | Global, affecting all device categories | Medium term (2-4 years) |
| Data-privacy concerns around cloud-hosted pet biometrics | -1.3% | Europe & North America, emerging in APAC | Long term (≥ 4 years) |
| Fragmented wireless standards hurting device interoperability | -1.1% | Global, diminishing with Matter adoption | Short term (≤ 2 years) |
| Source: Mordor Intelligence | |||
High Upfront Cost & Unclear ROI for Average Pet Owners
Advanced collars retail between USD 99 and USD 399, and cellular subscriptions add recurring charges. Owners of healthy pets often struggle to quantify preventive benefits within typical budgeting cycles, and spending sensitivity is highest in emerging economies where pet budgets compete with household healthcare. Financing packages and insurance rebates mitigate sticker shock but cannot fully erase affordability barriers. The challenge intensifies as households consider multiple devices—litter robots, feeders, cameras—each promising distinct benefits yet vying for limited discretionary funds.
Battery-Life & Durability Limitations of Wearables
Active GPS collars last as little as five days before recharge, an inconvenience that erodes daily compliance. AI processing increases energy draw, forcing compromises between tracking accuracy and battery life. Pets subject devices to water, dirt, and impact far beyond smartphone conditions, prompting higher return rates for broken hardware. Temperature swings in cold climates degrade lithium-ion capacity, further shortening cycles and frustrating owners who expect reliable safety tools.
*Our forecasts treat driver/restraint impacts as directional, not additive. The impact forecasts reflect baseline growth, mix effects, and variable interactions.
Segment Analysis
By Product: Health Diagnostics Deepens the Value of Connected Pet Devices
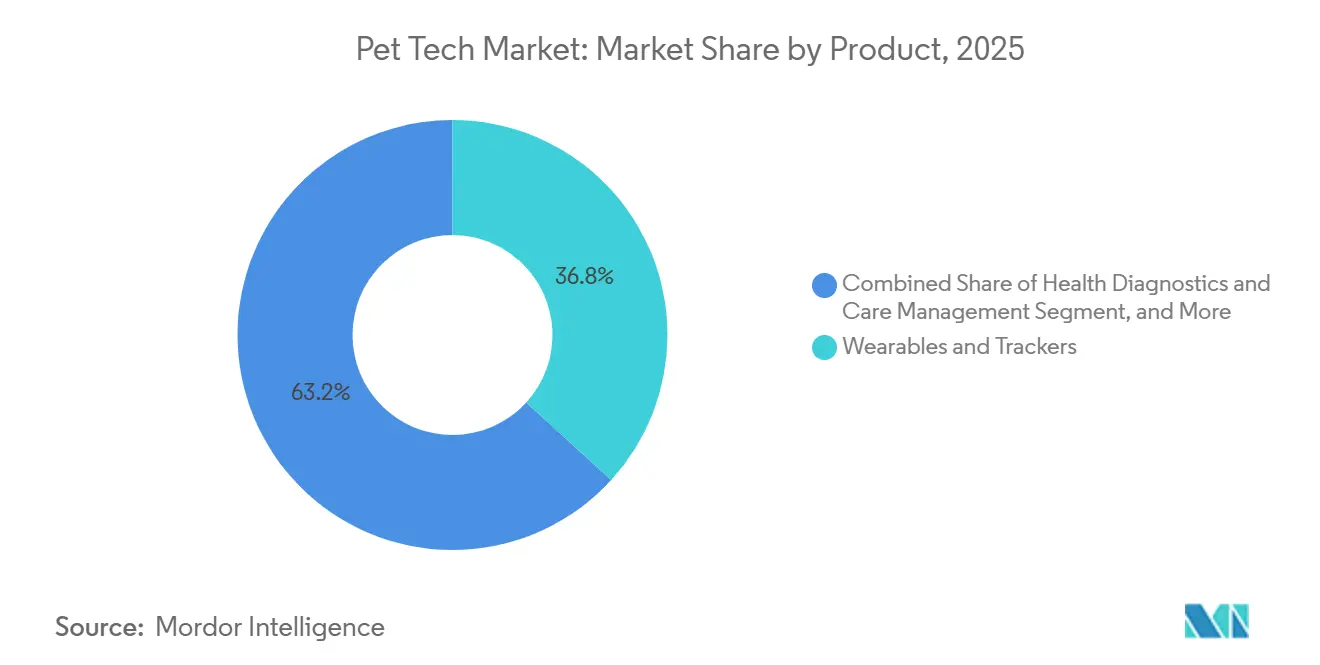
Wearables & trackers held 36.78% of revenue in 2025, giving them the largest product position in the pet tech market and confirming that tracking and activity monitoring still serve as the main entry point for many buyers. Health diagnostics & care management is forecast to grow at a 14.58% CAGR through 2031, which shows that value is shifting from simple location utility toward preventive and clinical use cases. In the pet tech market, that shift changes how products are judged, because buyers and care providers now expect devices to contribute information that can support action rather than only display status. PetPace’s V3.0 collar, launched in September 2025, added 24/7 global telehealth, epilepsy episode monitoring, and AI pain scoring, which illustrates how product positioning is moving closer to medical relevance. This direction is important for the pet tech industry because it expands the value pool from hardware sales into data services, care coordination, and longer-term subscription revenue.
The rest of the product mix shows how broad the pet tech market has become as households look for tools that fit into daily routines instead of solving only one problem. Monitoring, cameras & interaction devices remain important where owners want visibility during time away from home, especially in households concerned about separation behavior and general supervision. Feeding, hydration & nutrition automation is also becoming more sophisticated, and Petlibro expanded its AI-powered Luma Smart Litter Box into nearly 400 PetSmart stores in March 2026, showing stronger retail support for automated and data-aware care products. Safety, access & containment systems and other workflow-oriented tools are also building relevance as the pet tech market links home care, health management, and clinic communication into a more connected product stack.
Note: Segment shares of all individual segments available upon report purchase
By Animal Type: Cats Move from Secondary Focus to Core Growth Engine
Dogs accounted for 65.12% of revenue in 2025, which kept them in the lead in the pet tech market because product development has long centered on collars, containment, and tracking behavior that fit canine use cases. Cats, however, are forecast to grow at a 15.19% CAGR through 2031, making them the fastest-growing species segment and a more important commercial target over the forecast period. The American Pet Products Association reported that US cat ownership rose 23% in 2024 to 49 million households, which gives the category a stronger base for device adoption than it had only a few years ago. In product terms, that change matters because feline households are larger, accessory spending is rising, and long-standing design gaps are starting to close. The pet tech market size tied to cat-focused devices is therefore set to widen as more products are designed around feline behavior, smaller form factors, and indoor outdoor movement patterns.
This opportunity has become more visible as vendors launch products built specifically for cats rather than lightly modified dog devices. Tractive’s CAT 6 Mini, introduced in April 2026, added vital-sign monitoring and territory mapping in a lighter collar-integrated design made for feline anatomy. That launch addresses a long-standing issue in the pet tech market, because cats were often harder to serve with heavier hardware and use cases built around outdoor dog activity. Other companion animals remain much smaller in commercial terms, but the wider push toward environmental monitoring and species-specific care tools suggests that product specialization will continue to expand beyond the two largest pet groups.
By Technology: Connectivity Gains Importance as Devices Become Always-On Services
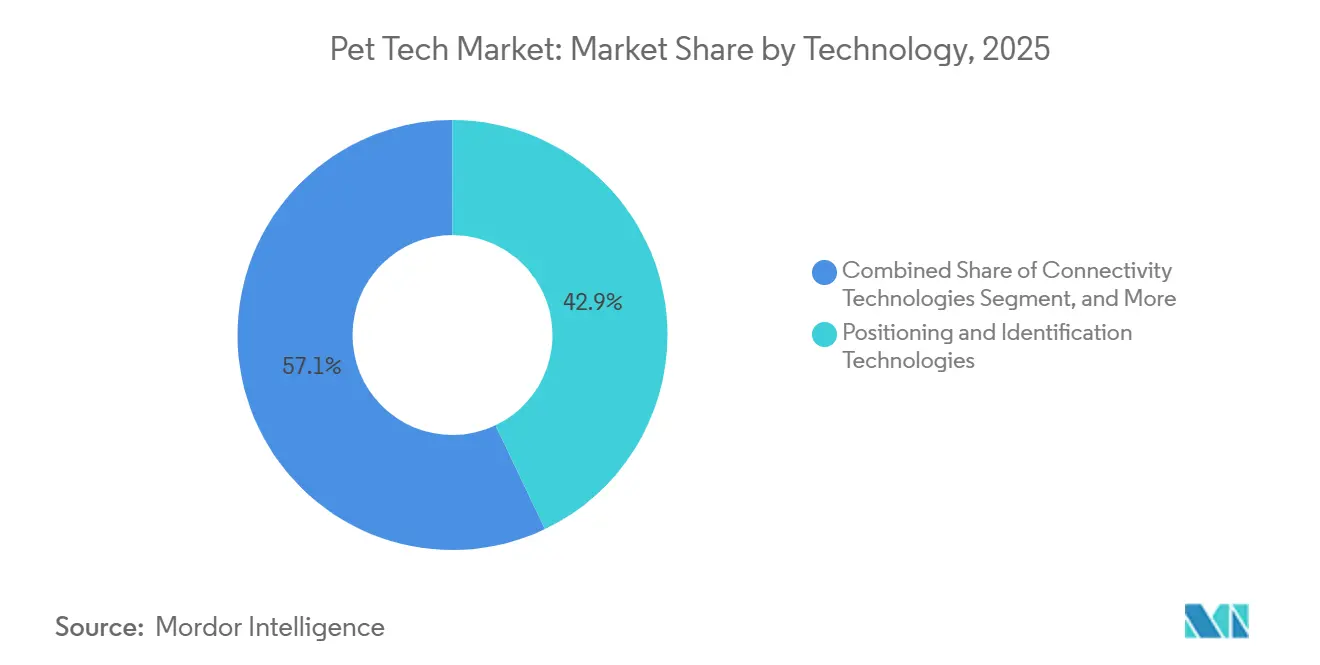
Positioning & identification technologies held 42.92% of revenue in 2025, giving them the largest technology share in the pet tech market and confirming that tracking remains the technical base of the category. Connectivity Technologies are forecast to grow at a 13.23% CAGR through 2031, which reflects the move from standalone devices toward systems that stay linked to apps, alerts, and cloud-supported services. This matters because the pet tech market no longer relies only on finding a pet or logging steps, but increasingly on maintaining a live data relationship between the device, the owner, and, in some cases, the care provider. Cellular links, Wi-Fi, and lower-power wide-area options make that model more practical, especially where vendors want to balance responsiveness with battery performance. The result is that technology value is migrating away from single-sensor hardware and toward the reliability of the whole connected stack.
Sensing technologies remain central even when they are less visible to end users, because they determine the depth and usefulness of the data each product can produce. SATELLAI unveiled Petsense AI and the SATELLAI Collar Go at CES 2026 with Qualcomm and AWS as partners, underscoring the move toward multimodal sensing that combines behavioral, environmental, and physiological inputs in one device experience. Other technologies, especially AI and software intelligence, are becoming more commercially important as the pet tech market needs tools that can translate raw data into usable recommendations and alerts. Over time, the strongest products are likely to be the ones that combine precise sensing, efficient connectivity, and interpretation layers that owners and clinics can actually act on.
Note: Segment shares of all individual segments available upon report purchase
By Application: Health Monitoring Becomes the Main Reason to Upgrade
Identification & tracking accounted for 38.17% of 2025 revenue, so it remained the leading application in the pet tech market and the most common first purchase for many owners. Health & wellness monitoring is forecast to grow at a 13.23% CAGR through 2031, which indicates that clinical and preventive use cases are starting to carry more commercial weight than basic location tracking alone. That change is significant because it recasts devices from convenience accessories into products that can support earlier intervention, regular observation, and ongoing care planning. Tractive’s insurance-linked partnerships in the United States and Germany show how health-oriented device data can gain importance when insurers see a practical use for continuous monitoring. In the pet tech market, the pet tech market share of health-focused applications should rise as owners see more value in daily health visibility than in periodic location checks alone.
Remote viewing & engagement remain relevant as households continue to spend time away from home while still expecting real-time visibility and interaction. Feeding & Nutrition management is also broadening, because connected systems are moving from timed dispensing toward more personalized portions and routine support. Training, Behavior Management, Litter, Waste & Hygiene Management, and other applications round out the pet tech market by solving practical care tasks that fit daily routines rather than one-off events. As device capability grows, application boundaries are becoming less rigid, and the same product can increasingly support monitoring, alerts, routine management, and care coordination inside a single customer relationship.
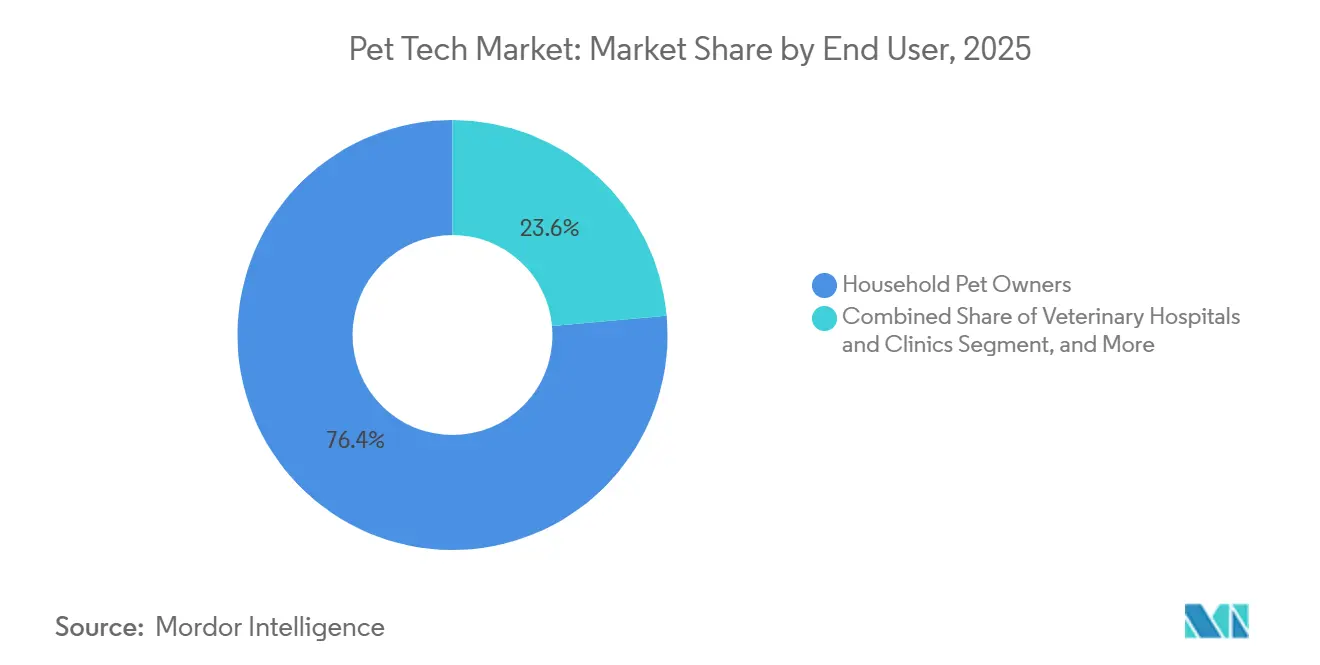
By End User: Veterinary Adoption Adds a Higher-Value Commercial Route
Household pet owners generated 76.42% of revenue in 2025, which shows that the pet tech market still rests mainly on consumer purchasing and home-based use. Veterinary clinics & hospitals are forecast to grow at a 13.68% CAGR through 2031, making them the fastest-growing end-user group as connected monitoring becomes more relevant to practice workflows. Chewy’s April 2026 agreement to acquire Modern Animal added 29 clinics, 24/7 virtual care, and more than 100,000 member families, highlighting how clinic access, virtual care, and commerce can be tied together in a broader care platform. This move matters in the pet tech industry because clinics can anchor recurring data use, medicine fulfillment, follow-up care, and device recommendations inside one system. It also raises the importance of products that fit into records, alerts, and patient management rather than only consumer apps.
The veterinary channel is becoming more influential because it can shape both trust and distribution in the pet tech market. When a clinic recommends a device, the purchase is more likely to be tied to a clear care outcome, which makes higher-priced products easier to justify. That structure also creates longer-lived customer relationships, since the device can keep feeding information into the care cycle after the initial sale. Other end users, such as shelters, pet hotels, and boarding operators, remain smaller, but they add another route for device deployment where monitoring, identification, and workflow efficiency matter at scale.
Note: Segment shares of all individual segments available upon report purchase
Geography Analysis
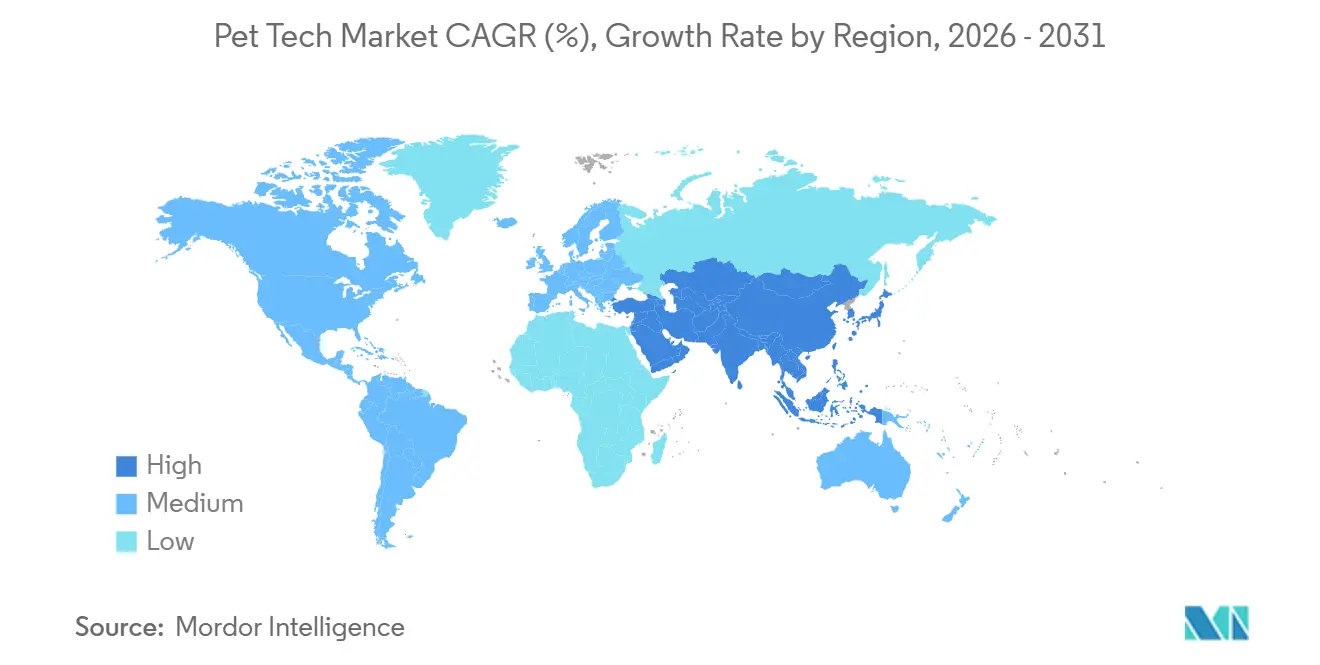
North America held 38.88% of revenue in 2025, which kept it as the largest regional block in the pet tech market and reflected high spending power, strong device adoption, and deeper digital care infrastructure. The American Pet Products Association reported that the US pet industry reached USD 158 billion in 2025, and this scale gives the region a larger spending base from which connected products can grow. The same association also found that 97% of dog and cat owners considered pets family members, reinforcing the demand backdrop for products tied to safety, health, and daily convenience. Europe is becoming more structurally important to the pet tech market because regulation is starting to create baseline demand rather than relying only on discretionary spending. The European Parliament approved the first EU-wide standards on dog and cat welfare in April 2026, including mandatory microchipping and registration in interoperable national databases, which should support longer-term demand for traceability-linked hardware and data systems.
Asia-Pacific is forecast to grow at a 13.95% CAGR through 2031, making it the fastest-growing geography in the pet tech market and the main source of future regional share gains. Growth in the region is being supported by urban pet ownership, rising middle-income spending, and a manufacturing base that can move new products to market quickly. The region is also seeing stronger product ecosystem activity, and Samsung reported a notable rise in SmartThings Pet Care users, showing that connected pet features are gaining traction inside wider home platforms. Bangkok’s mandatory pet microchipping and registration law took effect on January 10, 2026, adding a clear regulatory support point for device and identification demand in Southeast Asia. As the pet tech market expands in Asia-Pacific, the region’s mix of policy support, electronics capability, and urban consumer demand should continue to narrow the gap with North America and Europe.
Middle East & Africa and South America remain earlier-stage parts of the pet tech market, but they are gaining structure as identification and public management programs become more organized. India’s Delhi government is committed to microchipping 1 million stray dogs over 2 years with UNDP support, which signals real procurement demand for RFID-linked systems and scanners. Within the GCC, premium pet spending and urban lifestyles are helping higher-value connected devices find a customer base, even though the regional market is still smaller than the leading geographies. Across these developing regions, the pet tech market should benefit first from identification and compliance demand, and only later from broader subscription-led health and convenience adoption.
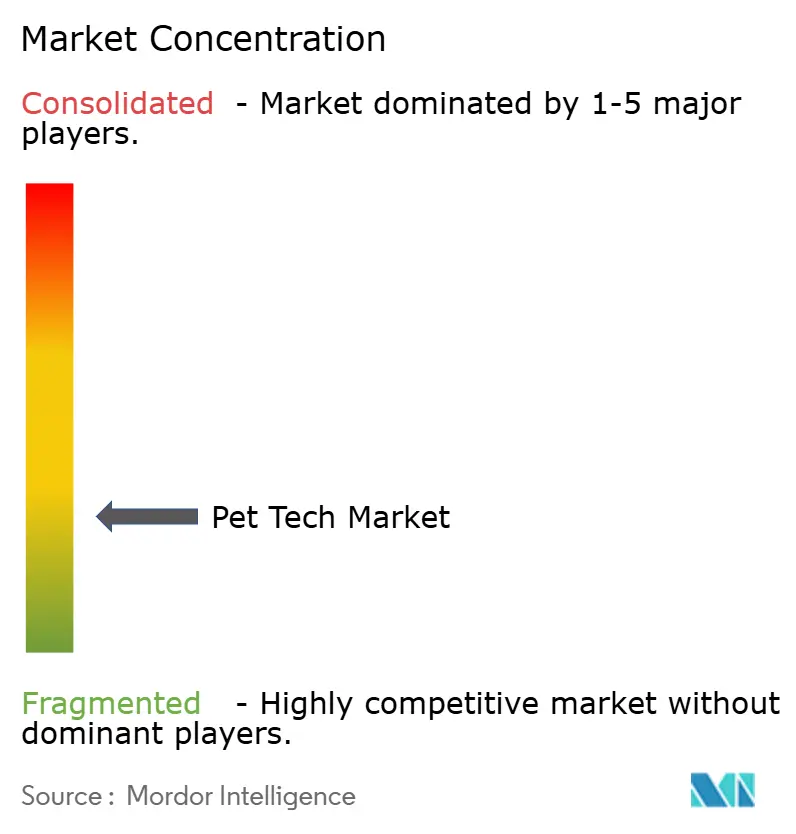
Competitive Landscape
The pet tech market is fragmented, and rivalry is spreading across pure-play device makers, broader care platforms, and electronics companies that treat pet functions as part of the connected home. No single company holds a dominant position across all product, technology, and application layers, so the advantage is moving toward firms that control the customer relationship after the initial hardware sale. Chewy’s agreement to acquire Modern Animal in April 2026 is one of the clearest examples of this shift, because it links clinics, virtual care, pharmacy activity, and commerce in a way that can deepen customer retention over time. Tractive’s March 2026 acquisition agreement with Bending Spoons points in the same direction, as the deal centered on scaling innovation and AI-backed product development rather than only expanding hardware distribution. In the pet tech market, these moves show that data, software capability, and service attachment are becoming more important than device ownership alone.
Product strategy is also becoming more specialized as companies try to defend space in the pet tech market with clearer use cases and stronger category fit. Tractive’s April 2026 launch of the DOG 6 XL and CAT 6 Mini added health summaries, history timelines, and species-specific form factors, which shows a push toward both hardware refinement and richer in-app value. Fi’s March 2026 expansion into the UK and several EU markets shows that regional scale is becoming a competitive lever, especially for brands that want to spread R&D costs across larger user bases. PetPace, meanwhile, moved deeper into health credibility with telehealth integration, epilepsy monitoring, and AI pain scoring, reinforcing the view that medical relevance can justify premium pricing in the pet tech market. Garmin remains an important competitive reference point because its 2025 annual report showed outdoor segment revenue of USD 2.05 billion, underscoring the scale available to companies with strong positioning, training, and navigation expertise that can extend into pet-related categories.
Barriers are rising because compliance, software quality, and data ownership now matter as much as hardware design in the pet tech market. Patent depth reinforces that point, with Tractive reporting more than 200 patents and Garmin operating with a much wider corporate intellectual property base across its portfolio. The new EU welfare rules will also favor vendors that can support traceability and interoperable registration requirements rather than offering disconnected devices alone. Overall, the pet tech market remains open enough for innovation, but the winners are likely to be the companies that connect hardware, recurring services, and regulatory readiness into a single commercial model.
Pet Tech Industry Leaders
Garmin Ltd.
Tractive GmbH
Petcube Inc.
Fi
FitBark Inc.
- *Disclaimer: Major Players sorted in no particular order


Recent Industry Developments
- April 2026: Chewy entered a definitive agreement to acquire Modern Animal, a technology-forward veterinary platform with 29 clinics, 24/7 virtual care, and over 100,000 member families. The deal is expected to add more than USD 125 million in annualised run-rate revenue and expand Chewy Vet Care from 18 to 47 locations nationwide, creating a fully integrated pet healthcare ecosystem.
- April 2026: Tractive launched the DOG 6 XL and CAT 6 Mini trackers alongside AI-Powered Health Summaries and a History Timeline in its app, marking its first collar-integrated GPS and health monitor built specifically for cats with vital-sign monitoring. The company holds over 200 patents and serves millions of active users across 175 countries.
- March 2026: Petlibro expanded its AI-powered Luma Smart Litter Box, priced at USD 599.99, to nearly 400 PetSmart stores and online, significantly scaling retail reach for its health-monitoring litter system that tracks up to 10 cats.
- March 2026: Fi announced international expansion into the UK, Germany, France, Ireland, the Netherlands, Belgium, Austria, and other EU markets, bringing its AI-powered Series 3+ dog collar with up to 3-month battery life and behavior tracking to European consumers.


Global Pet Tech Market Report Scope
The pet tech market consists of digital products, software, and connected devices designed to monitor, entertain, feed, and ensure the health, safety, and well-being of companion animals. It blends consumer electronics (IoT) with pet care, encompassing wearables, smart feeders, and GPS trackers.
The Pet Tech Market is segmented by product, animal type, technology, application, end user, and geography. By product, the market includes wearables and trackers, monitoring cameras and interaction devices, feeding, hydration, and nutrition automation systems, safety access and containment solutions, health diagnostics and care management products, and other pet technology products. Based on animal type, the market is categorized into dogs, cats, and other companion animals. By technology, the market comprises positioning and identification technologies, connectivity solutions, sensing technologies, and other technologies. In terms of application, the market covers identification and tracking, health and wellness monitoring, remote viewing and engagement, feeding and nutrition management, training and behavior management, litter waste and hygiene management, and other applications. By end user, the market is segmented into household pet owners, veterinary clinics and hospitals, and other end users. Geographically, the market is analyzed across North America, Europe, Asia-Pacific, the Middle East & Africa, and South America. The market forecasts are provided in terms of value (USD).
| Wearables & Trackers |
| Monitoring, Cameras & Interaction Devices |
| Feeding, Hydration & Nutrition Automation |
| Safety, Access & Containment Systems |
| Health Diagnostics & Care Management |
| Other Product (Digital Health, Tele-vet & Workflow Platforms, among others) |
| Dogs |
| Cats |
| Other Companion Animals |
| Positioning & Identification Technologies | GPS/GNSS |
| RFID/NFC | |
| Bluetooth Low Energy and UWB | |
| Connectivity Technologies | Wi-Fi |
| Cellular LTE-M and NB-IoT | |
| Sensing Technologies | |
| Other Technologies (Intelligence & Software Layers, among others) |
| Identification & Tracking |
| Health & Wellness Monitoring |
| Remote Viewing & Engagement |
| Feeding & Nutrition Management |
| Training & Behavior Management |
| Litter, Waste & Hygiene Management |
| Other Application (Telehealth & Care Coordination, Safety & Containment, among others) |
| Household Pet Owners |
| Veterinary Clinics & Hospitals |
| Other End Users |
| North America | United States |
| Canada | |
| Mexico | |
| Europe | Germany |
| United Kingdom | |
| France | |
| Italy | |
| Spain | |
| Rest of Europe | |
| Asia-Pacific | China |
| Japan | |
| India | |
| Australia | |
| South Korea | |
| Rest of Asia-Pacific | |
| Middle East & Africa | GCC |
| South Africa | |
| Rest of Middle East & Africa | |
| South America | Brazil |
| Argentina | |
| Rest of South America |
| By Product Type | Wearables & Trackers | |
| Monitoring, Cameras & Interaction Devices | ||
| Feeding, Hydration & Nutrition Automation | ||
| Safety, Access & Containment Systems | ||
| Health Diagnostics & Care Management | ||
| Other Product (Digital Health, Tele-vet & Workflow Platforms, among others) | ||
| By Animal Type | Dogs | |
| Cats | ||
| Other Companion Animals | ||
| By Technology | Positioning & Identification Technologies | GPS/GNSS |
| RFID/NFC | ||
| Bluetooth Low Energy and UWB | ||
| Connectivity Technologies | Wi-Fi | |
| Cellular LTE-M and NB-IoT | ||
| Sensing Technologies | ||
| Other Technologies (Intelligence & Software Layers, among others) | ||
| By Application | Identification & Tracking | |
| Health & Wellness Monitoring | ||
| Remote Viewing & Engagement | ||
| Feeding & Nutrition Management | ||
| Training & Behavior Management | ||
| Litter, Waste & Hygiene Management | ||
| Other Application (Telehealth & Care Coordination, Safety & Containment, among others) | ||
| By End User | Household Pet Owners | |
| Veterinary Clinics & Hospitals | ||
| Other End Users | ||
| By Geography | North America | United States |
| Canada | ||
| Mexico | ||
| Europe | Germany | |
| United Kingdom | ||
| France | ||
| Italy | ||
| Spain | ||
| Rest of Europe | ||
| Asia-Pacific | China | |
| Japan | ||
| India | ||
| Australia | ||
| South Korea | ||
| Rest of Asia-Pacific | ||
| Middle East & Africa | GCC | |
| South Africa | ||
| Rest of Middle East & Africa | ||
| South America | Brazil | |
| Argentina | ||
| Rest of South America | ||


Key Questions Answered in the Report
What is driving pet tech demand the most through 2031?
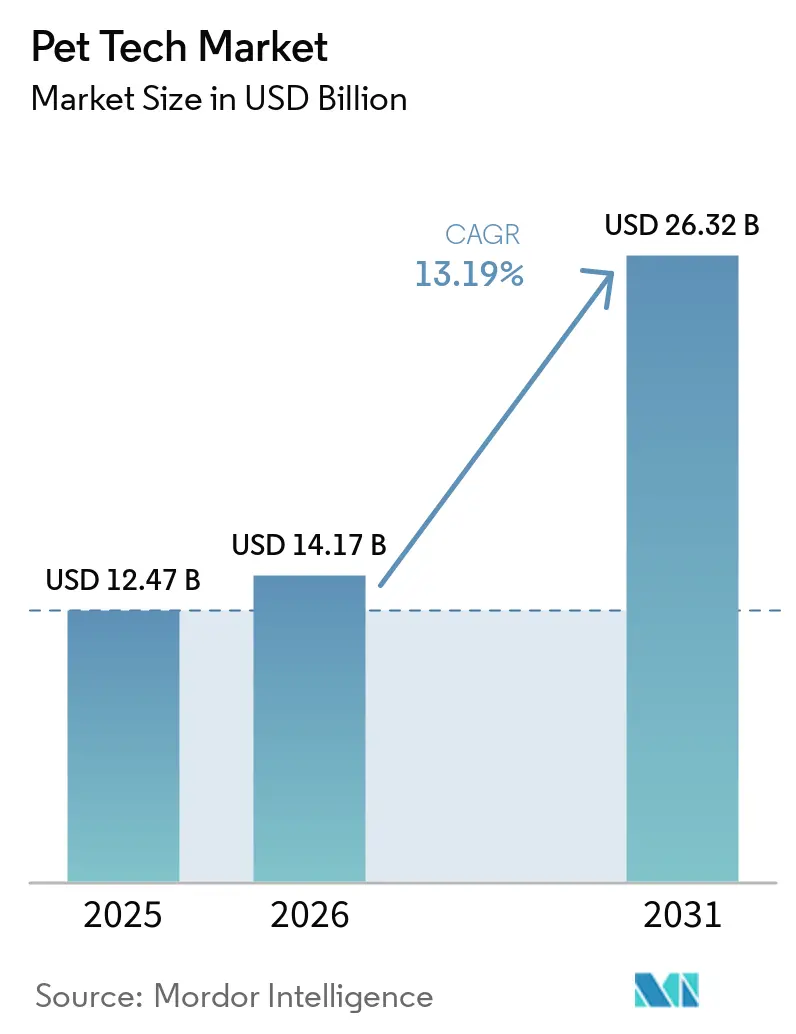
The strongest drivers are pet humanization, wider use of connected care, and growing interest in health monitoring. The pet tech market is projected to reach USD 26.32 billion by 2031 at a 13.19% CAGR.
Which product category leads sales today?
Wearables & trackers led the pet tech market with 36.78% of 2025 revenue, showing that tracking and activity monitoring still bring many users into the category first.
Which product area is growing the fastest?
Health diagnostics & care management is the fastest-growing product group, with a 14.58% CAGR through 2031, as buyers place more value on preventive and clinical monitoring.
Why are cats becoming more important for vendors?
Cats are the fastest-growing animal segment at a 15.19% CAGR through 2031, and US cat ownership rose to 49 million households after a 23% increase in 2024, which is pushing companies to design more feline-specific products.
Page last updated on:


