
Market Overview
| Study Period | 2021 - 2031 |
|---|---|
| Forecast Data Period | 2026 - 2031 |
| Base Year Market Size (2025) | 8.98 gigawatt |
| Market Volume (2026) | 10.39 gigawatt |
| Market Volume (2031) | 21.56 gigawatt |
| Growth Rate (2026 - 2031) | 15.72 % |
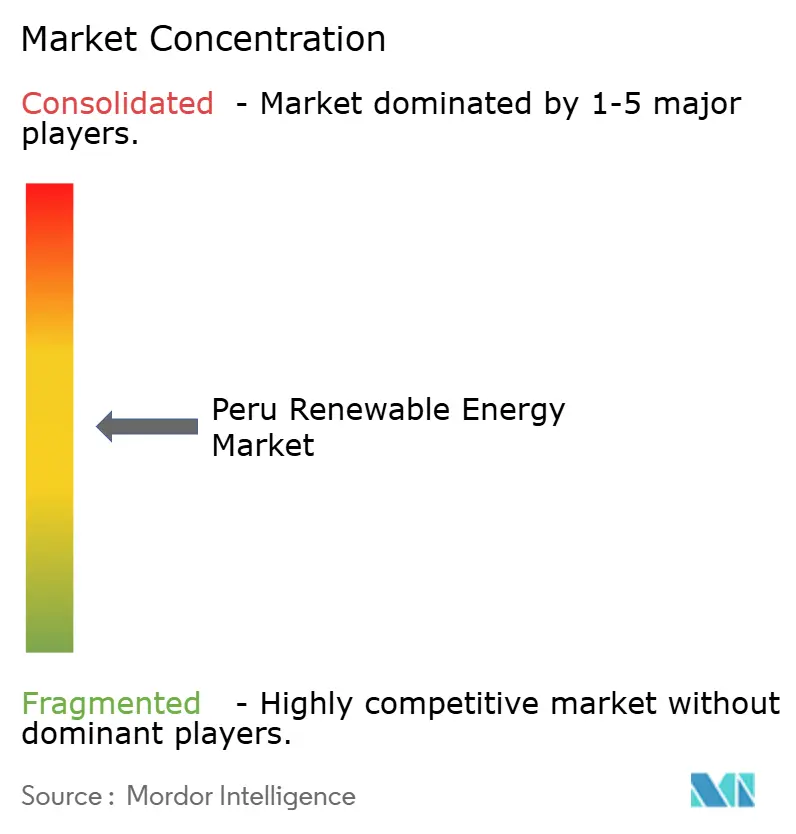
| Market Concentration | Medium |
Major Players *Disclaimer: Major Players sorted in no particular order Image © Mordor Intelligence. Reuse requires attribution under CC BY 4.0. | |
Peru Renewable Energy Market Analysis by Mordor Intelligence
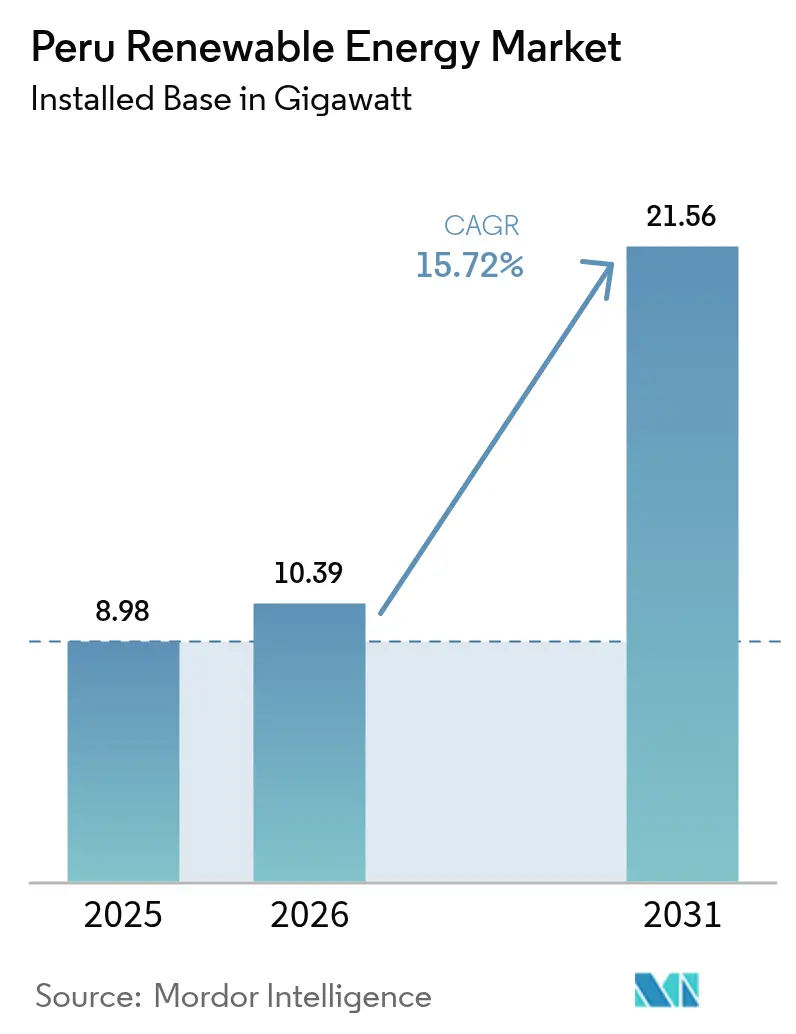
The Peru Renewable Energy Market size was valued at 8.98 gigawatt in 2025 and estimated to grow from 10.39 gigawatt in 2026 to reach 21.56 gigawatt by 2031, at a CAGR of 15.72% during the forecast period (2026-2031).
This expansion comes at a moment when long-standing hydro dominance is giving way to a solar-centric build-out, thanks to solar levelized costs dipping below USD 30/MWh in the high-irradiance southern corridor. Wind assets still anchor installed capacity, but mining-sector corporate PPAs, an impending 500 kV Peru–Ecuador intertie, and a new green-hydrogen law together broaden demand sources, unlock export optionality, and open fresh investment avenues. The shift also draws in new capital: European incumbents are offloading mature portfolios to Chinese SOEs, while infrastructure funds such as Actis line up multi-gigawatt development pipelines. Short-term headwinds, namely the risk of an auction hiatus beyond 2027 and localized grid congestion, temper near-term growth; yet, policy signals such as annual technology-neutral tenders and World Bank-backed adaptation finance reinforce longer-term visibility.
Key Report Takeaways
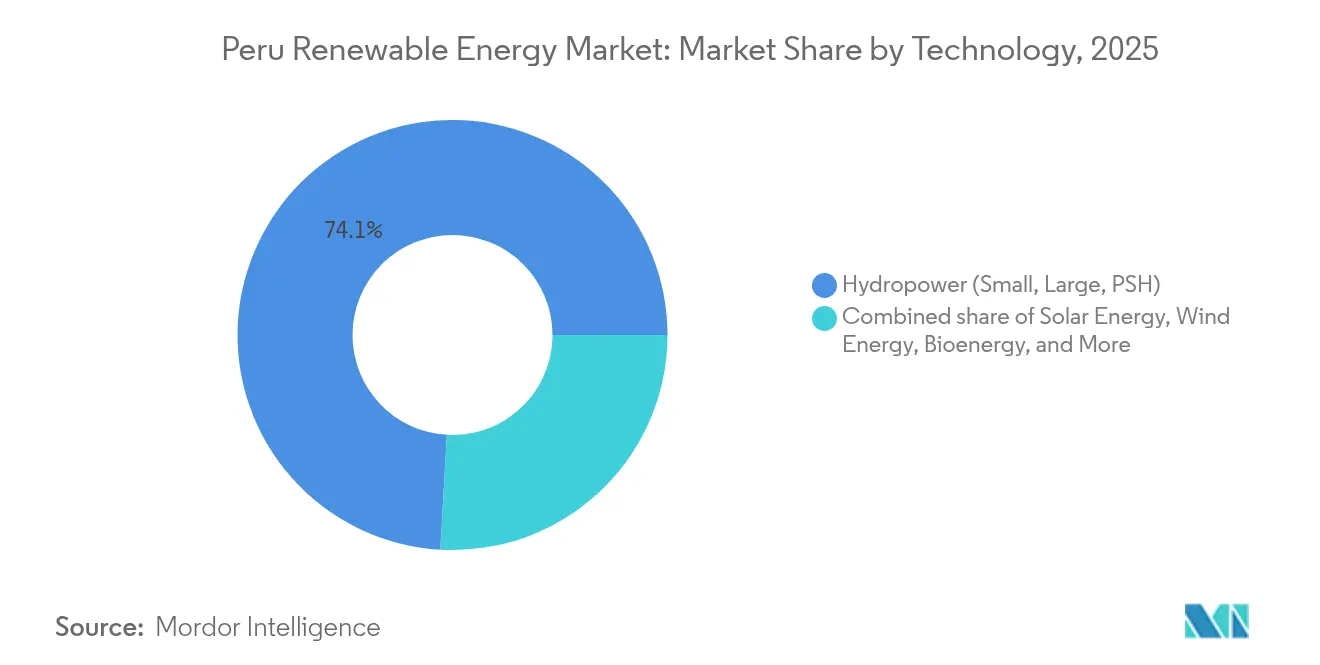
- By technology, hydropower held 74.10% of the Peruvian renewable energy market share in 2025, whereas solar is forecast to post the fastest 32.35% CAGR through 2031.
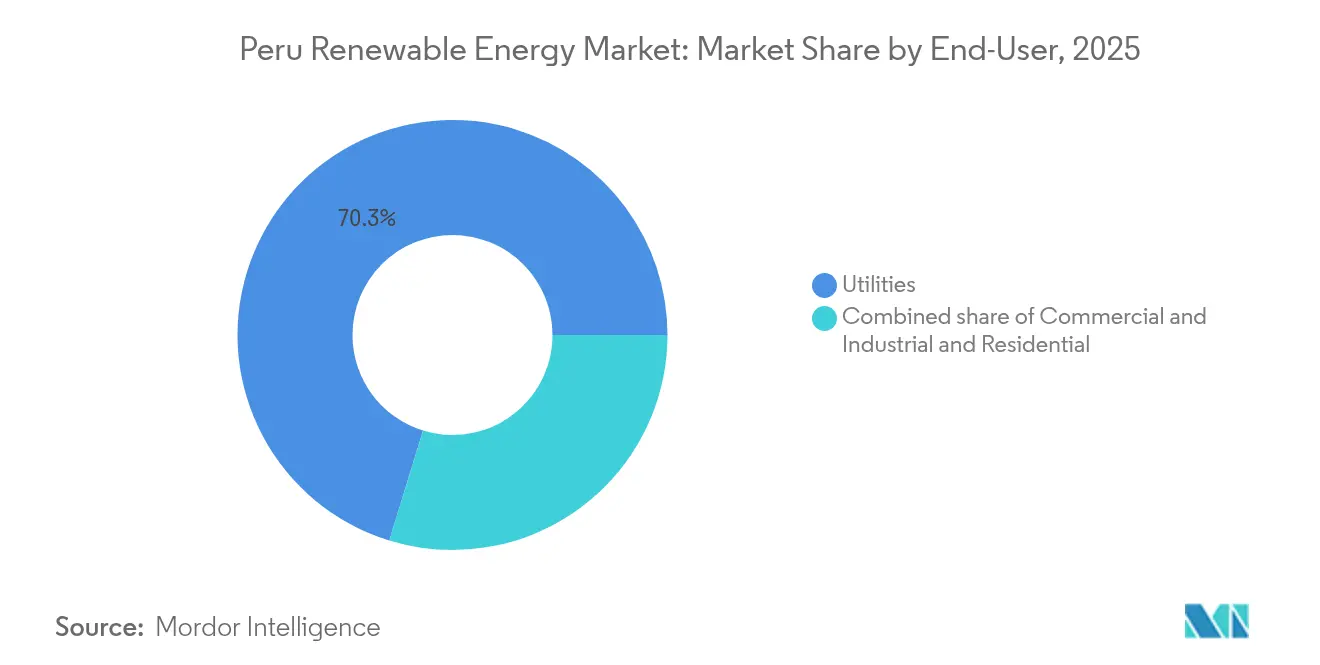
- By end-user, utilities controlled 70.25% of installed capacity in 2025, while the commercial and industrial segment, led by mining PPAs, is advancing at a 19.45% CAGR to 2031.
- By geography, the southern corridor (Arequipa-Moquegua-Tacna) captured 65.45% of the Peruvian renewable energy market size in 2025, and is expected to expand at a 17.65% CAGR through 2031
Note: Market size and forecast figures in this report are generated using Mordor Intelligence’s proprietary estimation framework, updated with the latest available data and insights as of 2026.
Peru Renewable Energy Market Trends and Insights
Drivers Impact Analysis*
| Driver | (~) % Impact on CAGR Forecast | Geographic Relevance | Impact Timeline |
|---|---|---|---|
| RER auctions restart in 2025 | +4.20% | National with focus in Arequipa, Moquegua, Tacna | Medium term (2-4 years) |
| Solar-PV LCOE below USD 30/MWh | +3.80% | Southern Peru | Short term (≤ 2 years) |
| 500 kV Peru–Ecuador intertie | +2.10% | Northern Peru border | Long term (≥ 4 years) |
| Mining-sector corporate PPAs | +3.50% | Southern mining corridor | Medium term (2-4 years) |
| Green-hydrogen law | +1.70% | Southern coastal ports | Long term (≥ 4 years) |
| Rural micro-grid program | +0.70% | Amazon basin | Medium term (2-4 years) |
| Source: Mordor Intelligence | |||
Government-Backed RER Auctions Restart in 2025
The 2024 tender allocated 1,016 MW at an average solar price of USD 27.36/MWh, proving that auction reform, which separates capacity and energy payments, can unlock large-scale investment.[1]Supervisory Agency for Investment in Energy and Mining, “Resolución 28832-2024,” osinergmin.gob.pe Winning bids from Statkraft, Engie, Kallpa, and Luz del Sur secured 20-year PPAs; however, the absence of a multi-year calendar clouds revenue visibility for projects targeting post-2027 operations. Developers with stronger balance sheets can weather this uncertainty better than smaller independent power producers, raising barriers to entry. Unless MINEM publishes a predictable schedule, project finance costs could rise, diluting price competitiveness against gas. The 2025 auction announcement, therefore, remains a critical gating event for the Peru renewable energy market.
Sharp Solar-PV LCOE Decline Below USD 30/MWh in Moquegua & Arequipa
Irradiation exceeding 2,400 kWh/m² and tariff-free module imports pushed solar LCOE to USD 27–30/MWh in 2024. Acciona’s 225 MW La Joya project and Yinson’s 97 MW Matarani plant illustrate how bifacial modules and single-axis trackers lift capacity factors above 30%. Mining operators are locking in long-dated PPAs at these tariffs to hedge against thermal volatility, underscoring the demand elasticity that occurs when prices breach the USD 30/MWh psychological threshold. Yet curtailed grid access in the southern corridor forces developers to price interconnection risk into bids, which could erode the headline cost advantage if transmission upgrades lag capacity growth.
Mining-Sector Corporate PPAs Accelerating Demand for Renewables
Mining accounted for 8,000 GWh of electricity use in 2024 and now prioritizes Scope 2 decarbonization. Atlas Renewable Energy’s 180 MW Javelin and 165 MW Huayca plants supply Antamina and Cerro Verde, respectively, while Glencore targets 100% renewables by 2030. Hybrid solar-plus-storage contracts add USD 15–20/MWh, yet still achieve 15–25% life-cycle savings compared to diesel hybrids.[2]World Bank, “Latin America and the Caribbean Energy Transition Report 2025,” worldbank.org Developers proficient in storage integration, therefore, enjoy a first-mover edge. The model is expanding beyond copper to gold and zinc operators, increasing the commercial and industrial share of the Peruvian renewable energy market.
Green-Hydrogen Law Catalyzing Electrolyser Projects at Southern Ports
Law 31992, enacted in 2024, assigns MINEM oversight, providing developers with the regulatory clarity needed to advance USD 11.2 billion in projects, such as Horizonte de Verano. Early environmental approval for the 3.6 GW complex validates permitting pathways. Southern ports offer deep-water berths and proximity to solar resources, enabling 240,000 tpa of hydrogen exports at USD 3.3–4.5/kg LCO. However, USD 500 million-plus port and desalination upgrades hinge on offtake contracts with Asian and European buyers willing to pay a certified premium, making policy support for guarantees or carbon-border adjustments pivotal.
Restraints Impact Analysis*
| Restraint | (~) % Impact on CAGR Forecast | Geographic Relevance | Impact Timeline |
|---|---|---|---|
| Auction hiatus & regulatory uncertainty post-2027 | -2.30% | National | Short term (≤ 2 years) |
| Cheap Camisea gas remains cost-competitive | -1.80% | National, especially Lima | Medium term (2-4 years) |
| Southern-corridor grid congestion | -2.10% | Moquegua, Arequipa, Tacna | Medium term (2-4 years) |
| Local opposition to coastal wind farms | -0.60% | Piura, Lambayeque, Ica | Long term (≥ 4 years) |
| Source: Mordor Intelligence | |||
Auction Hiatus & Regulatory Uncertainty Beyond 2027
The 2016-2024 procurement gap forced developers onto merchant or corporate power purchase agreement (PPA) paths, dampening investment diversity. Although December 2024 reforms separated capacity and energy payments, no binding calendar exists for 2026-2030 tenders, escalating revenue-certainty risk. Political turnover, five presidents since 2018, adds another layer of unpredictability. Lenders now demand higher equity cushions, which inflates the cost of capital and jeopardizes the 15.98% CAGR trajectory of the Peruvian renewable energy market.
Grid Congestion in Southern Corridor Delays Project COD
COES has logged 20 GW of pre-operational solar and wind proposals versus an 8 GW peak demand base, a mismatch that triggers curtailment and interconnection delays. The 220 kV Chilca-Independencia line, completed in 2025, eases coastal constraints but bypasses the desert bottleneck. Developers face a Catch-22: without confirmed grid access, off-takers hesitate to sign PPAs, while COES withholds approval pending demand proof. The 500 kV Peru–Ecuador intertie will relieve pressure only after 2029, prolonging scheduling risk and potentially deferring up to 3 GW of previously announced projects.
*Our forecasts treat driver/restraint impacts as directional, not additive. The impact forecasts reflect baseline growth, mix effects, and variable interactions.
Segment Analysis
By Technology: Solar Surge Reshapes Generation Mix
Solar additions accelerated after the 2024 auction, and utility-scale awards totaling 1,005 MW have lifted the segment to the forefront of the Peru renewable energy market. Statkraft’s 336 MW Illpa complex, Engie’s 172 MW Intipampa project, and Kallpa’s 204 MW Sunny plant are slated for commissioning by 2027, jointly adding 712 MW of nameplate capacity. COES cleared 1,677 MW of new solar studies in Q1 2025, bringing the active pipeline above 3 GW, while LCOE parity with gas in peak hours cements solar’s position as the cost leader. Hydropower still commands 74.10% of installed capacity, yet incremental growth is limited to 664 MW of run-of-river projects through 2027. Wind stands at 1,021 MW but faces siting and avian-impact challenges that elongate permitting timelines relative to solar.
Developers are banking on hybrid systems to offset intermittency, with Kallpa’s La Joya project integrating a 4-hour battery to meet the needs of the mining sector. The Peru renewable energy market size for solar is forecast to expand at a 32.35% CAGR, outpacing all other technologies. Although wind projects such as Kallpa’s 1,111 MW portfolio can achieve 25–30% capacity factors, curtailment risk remains elevated near congested coastal corridors, tempering near-term build-out. Bioenergy and geothermal remain niche due to feedstock constraints and drilling costs, while ocean energy remains commercially unviable under current tariff structures.



By End-User: Mining PPAs Drive C&I Acceleration
Utilities supplied 70.25% of the installed capacity in 2025 through long-term regulated contracts; however, their dominance is waning as miners execute direct PPAs. The commercial and industrial segment’s 19.45% CAGR reflects rising Scope 2 compliance pressures and the cost stability offered by sub-USD 30/MWh solar tariffs. Javelin and Huayca collectively deliver 345 MW to Antamina and Cerro Verde, while Glencore’s 300–400 MW incremental requirement underscores untapped demand. The Peru renewable energy market share captured by utilities is therefore projected to decline below 60% by 2031 as new commercial and industrial (C&I) contracts close.
Residential demand benefits from rural mini-grids financed under the IDB credit line; however, low retail tariffs and the absence of net metering keep rooftop solar penetration below 1%. Government electrification programs lifted the rural coefficient to 86.2% in 2024, but the bulk of capacity additions remains utility-scale or large C&I. Storage-backed PPAs are emerging as the new standard, positioning integrators that can bundle batteries with generation at an advantage. The Peru renewable energy industry thus pivots from a single-buyer model toward a diversified offtake landscape that favors technologically agile developers.
Geography Analysis
The southern corridor, comprising Arequipa, Moquegua, and Tacna, accounted for 65.45% of Peru's renewable energy market size in 2025, leveraging solar irradiation above 2,400 kWh/m². Statkraft's Illpa, Acciona's La Joya, and Kallpa's Pampa Salinas anchor this dominance; yet, the transmission designed for 3-4 GW now confronts a 20 GW queue. Delays compel developers to stagger commercial operation dates or absorb curtailment during low-demand hours.
Northern coastal regions, including Piura, Lambayeque, and Cajamarca, host emerging wind hubs, such as Zeus Energía's 300 MW Huascar project, which benefits from average wind speeds of 7-9 m/s and future export access via the Peru-Ecuador intertie. The 500 kV link, scheduled for completion in 2029, will increase cross-border capacity to 680 MW, enabling surplus dispatch and diversifying revenue streams. Lima and the central coast remain demand centers with limited utility-scale potential due to land scarcity and lower irradiation, but hold promise for small-scale distributed resources once the net-metering policy matures.
In the Amazon basin, electrification remains an energy-access rather than capacity-growth narrative. The IDB-financed mini-grids illustrate how hybrid solar can displace diesel in off-grid villages where grid extension costs exceed USD 50,000/km. Lessons learned from these pilots could inform the development of future stand-alone systems for remote mining camps and forestry operations. Geography, therefore, shapes transmission priorities: southern bottlenecks require bulk-power lines, northern corridors need export interface, and the Amazon favors localized solutions.
Regulatory Landscape
Peru’s renewable power build-out is governed by MINEM as policy lead, COES as system operator for the SEIN, and OSINERGMIN as the supervisory and tariff regulator. The December 2024 reform of renewable procurement (separating capacity and energy payments) and the subsequent push to modernize the electricity framework under Law 28832 have been central to restoring large-scale investment confidence after the long procurement gap between 2016 and 2024.
In 2026, the regulatory agenda broadened from procurement toward system flexibility and grid stability. MINEM issued a draft regulation under Ministerial Resolution No. 171-2026-MINEM/DM to open a market-based complementary services framework, explicitly creating a pathway for batteries and other technologies to compete for frequency and voltage support. In parallel, OSINERGMIN implemented new procedures in 2026 for classifying essential loads in the SEIN, tightening operational criteria to strengthen reliability, an increasingly important consideration as variable solar and wind penetration rises.
Competitive Landscape
Kallpa Generación holds 23% of the national generation and a 1,111 MW wind pipeline, positioning it as the largest single investor in upcoming renewables.[5]Kallpa Generación, “Investor Presentation Q1 2025,” kallpa.com European incumbents, including Orygen (formerly Enel), Acciona, Engie, and Statkraft, leverage their low cost of capital to dominate RER auctions, with Statkraft’s 336 MW Illpa award making it Peru’s largest solar operator. Auction projects reward balance-sheet strength, whereas C&I PPAs favor developers like Atlas Renewable Energy and Grenergy that bring storage integration and mining relationships.
Law 31992 opens a nascent green-hydrogen arena. Horizonte de Verano’s USD 11.2 billion approval and Phelan Green Energy’s 1.8 GW concession signal early-stage jostling for port access and export contracts. Offshore wind and large-scale battery storage remain white-space opportunities contingent on regulatory frameworks for maritime leasing and capacity remuneration.
Strategic moves in 2024-2025 underline rising competition. Kallpa’s EPC award to Acciona for La Joya, ISA REP’s transmission investment, and Glencore’s renewable commitments exemplify corporate alignment around decarbonization. The competitive landscape of the Peruvian renewable energy market is bifurcating, with utility-scale auctions consolidating among the top five players, while the merchant and hybrid niches invite specialized entrants.
Peru Renewable Energy Industry Leaders
Acciona SA
Cobra Instalaciones y Servicios SA
Enel Green Power Perú SAC
Engie Energía Perú SA
Statkraft Perú SA
- *Disclaimer: Major Players sorted in no particular order

Market Opportunities and Future Outlook
Hybridization and grid-services monetization are the clearest white-space areas as Peru moves to formalize complementary services and strengthen stability requirements for variable renewables. MINEM’s April 2026 draft complementary-services regulation provides a concrete entry point for battery energy storage systems to compete for frequency and voltage control, shifting storage from a capex add-on into a revenue-enabled capability for IPPs and C&I-focused developers.
Utility-scale solar continues to concentrate in the southern corridor where irradiation supports sub-USD 30/MWh economics, and the active pipeline supports near-term project volume for EPC, O&M, and grid-connection services. Execution evidence includes Zelestra starting work on the 242 MW Babilonia solar PV plant in Arequipa (February 2026), Orygen securing a definitive concession for the 323 MW Ruta del Sol solar project in Moquegua (March 2026), and MINEM granting a definitive concession for the 245 MW Yuramayo solar project in Arequipa (June 2026). Alongside generation, regulated transmission expansion remains a parallel opportunity set, as congestion in the south and cross-border integration plans raise the value of substations and transmission lines for unlocking queued renewable capacity.
Recent Industry Developments
- July 2026: ENGIE was awarded four power transmission projects in Peru through a ProInversion tender, covering more than 400 km of new lines, six new substations, and expansions of ten existing substations with investment above USD 230 million. The package strengthens the grid backbone needed to evacuate new solar and wind output, and it positions ENGIE deeper in regulated infrastructure alongside its generation portfolio.
- June 2026: ENGIE Energia Peru began construction of the 140.8 MW Hanaqpampa solar plant in Moquegua with investment exceeding USD 127 million, targeting commercial operation in Q1 2028. The project adds utility-scale solar volume in the southern corridor and expands the pool of bankable projects that can anchor long-term offtake contracting, including corporate PPAs from energy-intensive industries.
- November 2024: Acciona announced construction of a 225 MWp photovoltaic plant for Kallpa Generacion in La Joya, Arequipa, using 371,040 bifacial panels. The EPC-led build signaled continued scale-up of auction-linked and utility-scale solar development in the southern corridor, where grid access and delivery capability are central differentiators.


Research Methodology Framework and Report Scope
Market Definition and Coverage
For this study, the Peru renewable energy market is defined as the country's renewable power installed capacity in gigawatts, counted across operating assets and tracked by technology in the national generation mix.
Scope exclusions: We exclude conventional thermal generation, transmission and distribution infrastructure, and general power retail revenues from this market sizing.
Segmentation Overview
- By Technology
- Solar Energy (PV and CSP)
- Wind Energy (Onshore and Offshore)
- Hydropower (Small, Large, PSH)
- Bioenergy
- Geothermal
- Ocean Energy (Tidal and Wave)
- By End-User
- Utilities
- Commercial and Industrial
- Residential
Data Sources, Market Sizing, and Validation
Desk Research
Desk work started with building a clean view of Peru's renewable capacity pipeline and operating base, where we tracked commissioning timelines, retirements, and announced projects. To keep it grounded, we leaned on public datasets and official releases such as Peru's energy and mining ministry publications, the national statistics institute releases, OSINERGMIN market bulletins, IEA and IRENA country data, and renewable auction and permitting notices.
Next, we used company annual reports, investor presentations, and reputable press coverage to cross-check project status and timing, because small shifts in announcements can move a yearly capacity number. In a few cases, paid subscriptions for company financials and intelligence, patent databases, and shipment-level import-export data were used to validate equipment flow signals and project activity when public detail was thin. These desk research sources are illustrative, and many other public documents were also reviewed for data capture, validation, and clarification.
Primary Interviews and Surveys
We consult experts in Peru's power generation, project development, regulation, utilities, engineering, and energy procurement fields. Their input helps test commissioning schedules, capacity utilization, project delays, capital cost assumptions, and the treatment of distributed generation. It also helps close gaps in secondary records and triangulate the final model using operating and project-level evidence from Peru.
Distribution of primary research fieldwork respondents
| Company type | Respondent position |
|---|---|
| Top tier: 30% | CXOs: 15% |
| Mid tier: 50% | Functional/Unit leaders: 35% |
| Smaller Players: 20% | Managers: 50% |
Market-Sizing & Forecasting
The core model was built using a top-down capacity reconstruction, where official installed capacity and additions by technology were aligned to project start dates and grid connection timing, and then rolled forward year by year. To corroborate totals, we then used selective bottom-up approximations such as sampled project roll ups, channel checks on equipment deliveries, and typical MW additions per project type, which helped us adjust for slippage and partial-year commissioning.
Inputs were chosen to match how renewables actually scale in Peru, including annual capacity additions by technology, auction award volumes and bid-to-commission conversion, permitting and interconnection progress, average build timelines for solar and wind, hydrology sensitivity for hydro availability (as a signal for replacement additions), and announced grid constraints that can delay COD. For forecasting, scenario analysis was used around project execution and policy signals, and assumptions were refined through primary feedback so the pace of additions stays realistic rather than purely trend driven.
Data Validation & Update Cycle
Checks were run in several steps, starting with making sure each yearly capacity number ties back to at least one independent public indicator, and then reviewing any jump that looked out of line with auction awards or known COD timing. When mismatches showed up, we rechecked unit consistency, commissioning dates, and technology classification, and then re-contacted relevant experts if a change could materially move the total.
Before sign-off, the model outputs go through an analyst review for variance and logic, followed by a final pass to ensure the latest public updates are reflected. The report is refreshed annually, and interim updates are made when there is a material policy shift, a major auction result, or a large project moves its commissioning date.
Mordor Intelligence's Peru Renewable Energy Market Size Measured Against Other Published Estimates
Published market sizes for Peru renewables can differ a lot because some sources measure installed capacity while others report revenue, and the time cutoffs for what is counted as live can also vary. Differences in currency timing, the handling of partial-year commissioning, and whether delayed projects remain in the active pipeline are other common reasons the same market looks larger or smaller.
A refresh-led gap shows up most clearly when exchange rates, ASP assumptions, and commissioning updates are rolled forward on a consistent calendar. In this study, the model is kept aligned to the most recent commissioning status checks and a consistent year-end cutoff, and that refresh discipline is one reason the capacity-based number can sit away from revenue-based estimates used by Mordor Intelligence.
Benchmark comparison
| Source | Market Size | Gaps in Research Methodology |
|---|---|---|
| Mordor Intelligence | USD 8.98 B (2025) | |
| Global Consultancy A | USD 3.17 B (2023) | This figure is reported in USD value terms and is anchored to a different base year, so it is influenced by currency conversion timing and pricing assumptions, rather than a pure installed capacity count. |
| Industry Publisher B | USD 10.39 B (2026) | This estimate reflects a forecast-year point and can pull in projects expected to commission during the year, which can inflate the number versus a strict in-operation cutoff at a single date. |
The comparison points to two practical drivers of the spread, unit choice and timing. When sizing is tied to installed MW at a defined cutoff, the number tracks physical build-out, and when sizing is tied to USD, it moves with pricing and exchange rates. By keeping assumptions traceable to commissioning status, auction signals, and year-specific cutoffs, the methodology stays repeatable and easier to reconcile over time.


Key Questions Answered in the Report
How large is the Peru renewable energy market in 2025 and what is its growth outlook?
Installed capacity reached 8.98 GW in 2025 and is estimated at 10.39 GW in 2026 and forecast to climb to 21.56 GW by 2031, implying a 15.72% CAGR.
Which technology is expanding the fastest in Peru’s renewables mix?
Solar is projected to grow at a 32.35% CAGR during 2026-2031, driven by sub-USD 30/MWh LCOE in Moquegua and Arequipa.
Why are mining companies signing renewable PPAs in Peru?
Scope 2 emissions mandates and cost savings of 15-25% versus diesel hybrids are motivating miners to lock in long-term solar and wind contracts.
What infrastructure is critical for Peru’s next wave of renewable projects?
500 kV transmission upgrades in the southern corridor and the Peru-Ecuador intertie are essential for integrating up to 20 GW of queued projects.
How does Law 31992 affect green-hydrogen development?
The law creates a regulatory framework that has already enabled the USD 11.2 billion Horizonte de Verano project and other electrolyser proposals along southern ports.
Which companies lead Peru’s renewable project pipeline?
Kallpa Generación tops the list with a 1,111 MW wind pipeline, while Statkraft, Acciona, Engie, and Orygen dominate recent solar auction awards.
Page last updated on:




