
Permanent Magnet Motor Market Size and Share
Market Overview
| Study Period | 2020 - 2031 |
|---|---|
| Market Size (2026) | USD 57.94 Billion |
| Market Size (2031) | USD 89.47 Billion |
| Growth Rate (2026 - 2031) | 9.08 % |
| Fastest Growing Market | Asia-Pacific |
| Largest Market | Asia-Pacific |
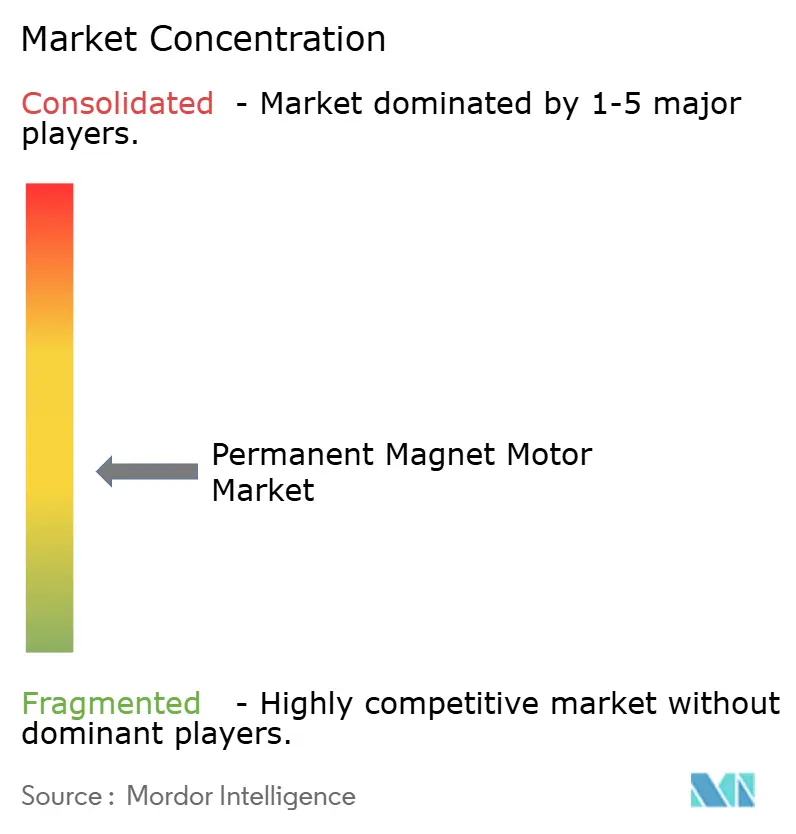
| Market Concentration | Medium |
Major Players *Disclaimer: Major Players sorted in no particular order Image © Mordor Intelligence. Reuse requires attribution under CC BY 4.0. | |

Permanent Magnet Motor Market Analysis by Mordor Intelligence
The permanent magnet motor market stood at USD 57.94 billion in 2026 and is forecast to reach USD 89.47 billion by 2031, translating to a 9.08% CAGR over the period. Continued electrification of transport and industry, rapid tightening of motor-efficiency regulations, and the quest for resilient rare-earth supply underpin demand growth. Brushless DC topologies are moving ahead of legacy designs as automakers embed them in traction inverters and collaborative-robot builders specify them for fast torque response. Magnet innovators are pushing nanocomposite neodymium-iron-boron chemistries that curb heavy rare-earth content without eroding coercivity, an advance that eases geopolitical supply-chain risk while preserving torque density. Asia-Pacific dominates installed base thanks to China’s vertically integrated value chain, yet North American and European reshoring initiatives are reshaping procurement patterns as domestic magnet production scales up. Competitive tactics revolve around bolt-on acquisitions that secure magnet capacity and additive-manufacturing know-how, giving leading suppliers deeper control over cost and speed-to-market.
Key Report Takeaways
- By motor type, permanent magnet AC motors led with 48.03% revenue share in 2025, while brushless DC is projected to expand at a 10.86% CAGR through 2031.
- By power rating, the 4-22 kW class captured 41.37% revenue share in 2025, whereas the 75 kW-and-above bracket is forecast to advance at a 10.70% CAGR through 2031.
- By end-user industry, automotive accounted for 37.24% of permanent magnet motor market share in 2025, while the energy sector is set to record the fastest 9.90% CAGR to 2031.
- By geography, Asia-Pacific commanded 43.50% revenue share in 2025 and is expected to deliver the quickest 9.58% CAGR through 2031.
Note: Market size and forecast figures in this report are generated using Mordor Intelligence’s proprietary estimation framework, updated with the latest available data and insights as of January 2026.
Global Permanent Magnet Motor Market Trends and Insights
Drivers Impact Analysis*
| Driver | (~) % Impact on CAGR Forecast | Geographic Relevance | Impact Timeline |
|---|---|---|---|
| Increased Motor Efficiency Due to Permanent Magnets | +1.80% | Global, with strongest adoption in Europe and North America | Medium term (2-4 years) |
| Rising Demand for Electric Vehicles | +2.30% | Asia-Pacific core, expanding to Europe and North America | Short term (≤2 years) |
| Stringent Energy-Efficiency Regulations | +1.50% | Europe and North America, cascading to Asia-Pacific | Medium term (2-4 years) |
| Expansion of Renewable Energy Generation Using PM Generators | +1.20% | Global, with offshore wind concentrated in Europe and Asia-Pacific | Long term (≥4 years) |
| Advances in Additive Manufacturing of Custom PM Rotors | +0.90% | North America and Europe, pilot deployments in Asia-Pacific | Long term (≥4 years) |
| Regionalization of Rare-Earth Magnet Supply Chains | +1.10% | North America, Europe, and Japan | Medium term (2-4 years) |
| Source: Mordor Intelligence | |||
Increased Motor Efficiency Due to Permanent Magnets
Permanent-magnet synchronous motors deliver 94-97% full-load efficiency in the 4-22 kW class, outpacing comparable induction designs by up to 5 percentage points, a delta that trims industrial payback periods below 18 months.[1]U.S. Department of Energy, “Industrial Technologies Program: Motor Systems,” energy.gov Variable-speed duty cycles amplify the savings because rotor copper losses disappear when magnet excitation replaces winding current, a fit with ISO 50001 programs that prize low part-load losses. The European Union’s Ecodesign Directive widened the scope of minimum efficiency rules in 2024, triggering retrofits in space-constrained refrigeration and ventilation equipment.[2]European Commission, “Ecodesign Regulation 2024,” ec.europa.eu Above 200 kW the cost-benefit narrows, yet niches such as regenerative cranes still justify magnet adoption where frequent cycling dominates lifecycle cost.
Rising Demand for Electric Vehicles
Global battery-electric output reached 14 million vehicles in 2025, and 78% used permanent-magnet traction motors for superior torque density and regeneration efficiency.[3]International Energy Agency, “Global EV Outlook 2025,” iea.org Chinese automakers now combine hairpin stators with segmented-magnet rotors to slash eddy losses, enabling continuous ratings above 150 kW without liquid cooling. Tesla’s reluctance-assisted design trimmed neodymium content by 20%, prompting rivals to accelerate dysprosium-free chemistries. Commercial fleets amplify demand: Daimler Truck and Volvo Group plan more than 50,000 electric heavy vehicles each year by 2027, absorbing over 1,200 metric tons of NdFeB magnets annually.
Stringent Energy-Efficiency Regulations
The U.S. Department of Energy finalized IE4-level motor requirements in March 2024 for 1-500 horsepower machines, effective January 2027, effectively pushing variable-torque designs above 50 hp toward permanent-magnet or synchronous-reluctance architectures. Manufacturers face USD 15-25 million retooling bills per plant, fuelling consolidation and creating openings for suppliers already scaled in magnet motors. Japan’s 2025 Top Runner update extended high-efficiency rules to hermetic compressors, a category that consumes 18% of residential electricity; permanent-magnet variants can cut household use by up to 280 kWh per year. Retrofit incentives in Germany and France accelerate uptake by allowing accelerated depreciation on qualifying motors.
Expansion of Renewable Energy Generation Using PM Generators
Offshore wind projects commissioned in 2025 favour direct-drive permanent-magnet generators rated 12-15 MW, eliminating gearboxes and pushing turbine availability above 97%. Vestas and GE Vernova locked in multi-year supply deals covering up to 4,000 metric tons of NdFeB per year through 2028. Hydropower upgrades that replace salient-pole alternators with permanent-magnet synchronous units add 4-6 percentage points of part-load efficiency, boosting generation by up to 20 GWh annually at 100 MW stations. Carbon-credit monetization of reduced curtailment further sweetens project economics in OECD power markets.
Restraints Impact Analysis*
| Restraint | (~) % Impact on CAGR Forecast | Geographic Relevance | Impact Timeline |
|---|---|---|---|
| Diminishing Availability of Rare-Earth Metals | -1.40% | Global, acute in North America and Europe | Short term (≤2 years) |
| High Initial Cost of PM Motors | -1.00% | Emerging markets in South America, Middle East, and Africa | Medium term (2-4 years) |
| Demagnetization Risk at Elevated Operating Temperatures | -0.70% | Middle East, Africa, and tropical Asia-Pacific | Medium term (2-4 years) |
| Geopolitical Supply-Chain Concentration Risk | -0.90% | North America, Europe, and Japan | Short term (≤2 years) |
| Source: Mordor Intelligence | |||
Diminishing Availability of Rare-Earth Metals
Neodymium oxide supply totalled 38,000 metric tons in 2025 against demand poised to pass 45,000 metric tons in 2028, elevating spot prices from USD 68 /kg in early 2024 to USD 92 /kg by December 2025. Dysprosium remains tighter, with China controlling 94% of separation capacity and adjusting export quotas by up to 25% year-over-year. Manufacturers mitigate exposure through flux-concentrating rotors and grain-boundary diffusion that slash heavy rare-earth content by up to 40%, but the capital cost of new magnet lines ranges from USD 8-12 million. Recycling plants, while promising, still supply under 3% of global magnet demand.
High Initial Cost of PM Motors
List prices for 4-22 kW permanent-magnet units sit 35-50% above induction counterparts, stretching payback beyond 3 years in duty cycles under 4,000 hours per year. The gap is sharper in hermetic compressors, where magnet insertion and rotor balancing add USD 18-25 per unit, a 12-15% uplift that appliance makers struggle to pass on in price-sensitive markets. Financing hurdles in emerging economies limit access to green-loan programs common in OECD regions, though rising energy prices are nudging municipal utilities and mines to adopt total-cost-of-ownership models that favour efficient motors over time.
*Our forecasts treat driver/restraint impacts as directional, not additive. The impact forecasts reflect baseline growth, mix effects, and variable interactions.
Segment Analysis
By Motor Type: Brushless Designs Extend Reach
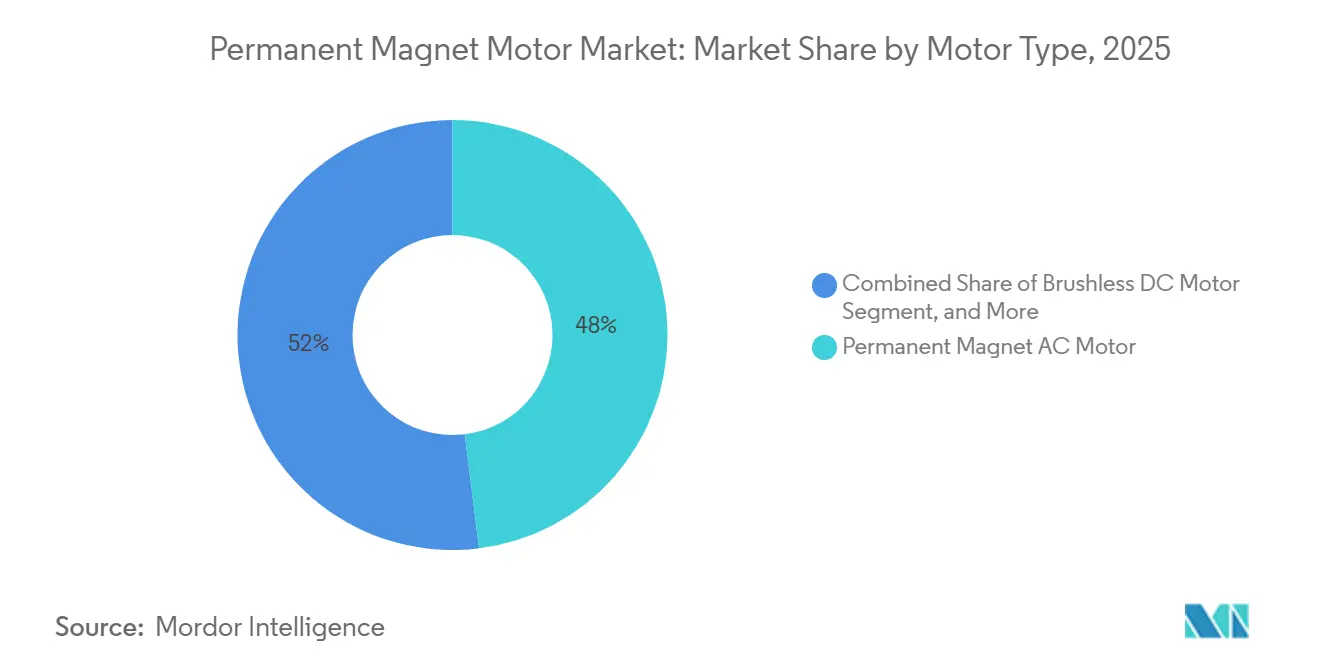
Permanent magnet AC machines generated 48.03% of revenue in 2025, reflecting their entrenched role in factory automation and HVAC installations where three-phase grids and mature inverter ecosystems simplify deployment. The permanent magnet motor market is witnessing double-digit expansion of brushless DC alternatives that pair naturally with 48-volt subsystems in electric vehicles and collaborative robots. Manufacturers like Continental have demonstrated trapezoidal back-EMF profiles that reduce semiconductor switching losses by up to 12%, a performance gain that shortens controller cost recovery cycles. Legacy permanent magnet DC designs linger in small electronics, yet their share contracts as lithium-ion packs standardize around voltages that reward sensorless brushless topologies with longer lifespans. Hermetic motors sit at the intersection of the refrigeration boom and heat-pump retrofits, drawing interest because sealed stators eliminate refrigerant leakage paths during repeated thermal cycling.
Brushless architectures also reshape maintenance economics. Absence of brushes removes sparking and dust, extending overhaul intervals in food-grade conveyors and medical ventilators where cleanliness is paramount. The permanent magnet motor market size for brushless platforms in auxiliary vehicle systems is expected to maintain momentum because onboard electronics already support field-oriented control. Conversely, permanent magnet AC remains favoured in grid-tied equipment that demands smooth sinusoidal torque and accepts slightly larger frames to simplify compliance with electromagnetic compatibility norms. The net effect is parallel growth corridors rather than outright substitution, with design engineers selecting form factors according to duty cycle and inverter sophistication rather than magnet cost alone.



By Magnetic Material Type: Nanocomposites Gain Traction
Neodymium-iron-boron retained 52.40% share in 2025, thanks to energy products above 35 MGOe that let designers trim rotor diameters and still hit torque targets. Yet the permanent magnet motor market now tracks a rapid 10.04% CAGR for nanocomposite NdFeB, a chemistry that deposits terbium or dysprosium at grain boundaries, raising coercivity by up to 30% while cutting heavy rare-earth loadings nearly in half. These alloys shield OEMs from dysprosium price spikes that exceeded 60% in 2024-2025, and they allow operation beyond 180 °C in high-speed spindles without demagnetization. Aerospace and defense users still specify samarium-cobalt for thermal stability above 200 °C despite material costs roughly triple those of NdFeB. Ferrite, though lower in energy density, draws appliance and irrigation-pump producers that compete in regions where electricity tariffs sit under USD 0.08 /kWh, extending ROI thresholds beyond premium magnet economics.
Nanocomposite diffusion lines require tighter process controls and capital outlays upward of USD 10 million, but early movers lock in intellectual property barriers that deter fast-follower entry. The permanent magnet motor market share for ferrite will likely stabilize rather than collapse, helped by hybrid reluctance-assisted topologies that allow magnet mass reductions of 40-60%. Ultimately magnet mix bifurcates along performance and cost curves, matching technologically demanding automotive and industrial segments with nanocomposites, while volume-driven appliance makers optimize around ferrite.
By Power Rating: High-Power Adoption Accelerates
Motors in the 4-22 kW band contributed 41.37% of 2025 revenue, supported by widespread deployment in industrial pumps, fans, and conveyors where standardized frames ease drop-in swaps. However, the 75 kW and above class is the fastest mover, climbing at 10.70% CAGR as mining haul trucks, drilling mud pumps, and offshore compressors chase efficiency savings. The permanent magnet motor market size for high-power units grows because diesel replacement yields fuel cuts of up to 150 liters per 10-hour shift, and operators report maintenance interval extensions from 500 to 1,200 hours. Offshore platforms retrofit seawater injection systems with 150-300 kW permanent-magnet drives that shave 1.8 MWh per day per pump, translating to six-figure annual savings when crude prices remain above USD 80 per barrel.
In contrast, the up-to-4 kW segment caters to consumer electronics and medical devices where brushless DC dominates for low voltage and compact mass. The 22-75 kW range grows more slowly because plant managers often pair induction machines with variable-frequency drives to meet part-load flexibility at lower capital expense. When annual operating hours exceed 5,000 or regenerative service is essential, permanent magnets win the business case; otherwise, induction hardware holds ground.
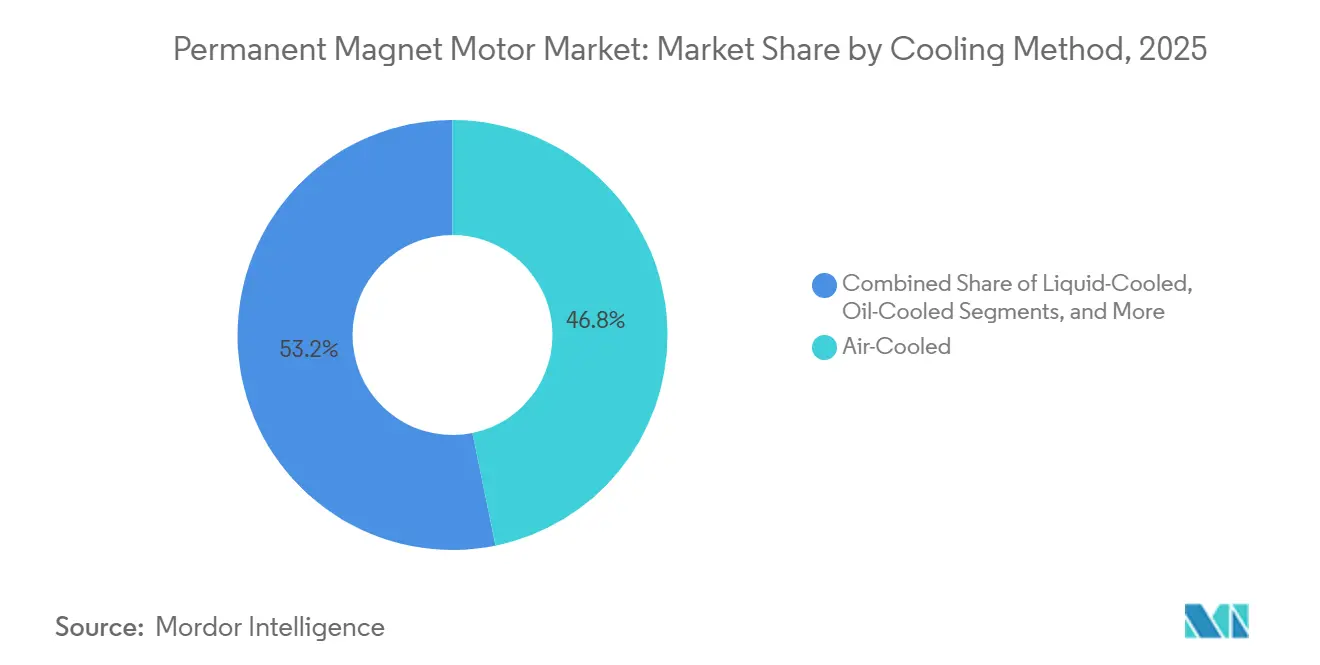
By Cooling Method: Liquid Systems Break Through
Air-cooled designs still represent 46.80% of installations, well-suited to continuous duty loads below 4 kW per liter. Yet liquid cooling gains a 9.67% CAGR as 800-volt vehicle platforms push current densities to 30 A/mm². The permanent magnet motor market, therefore, supports direct oil-jet or glycol-jacket stators that dissipate more than 150 W/cm² heat flux, unlocking 15-20% higher continuous power within unchanged envelopes. Oil-cooled variants penetrate high-speed machine-tool spindles, where speeds above 20,000 rpm would otherwise mandate bulky air coolers. Hybrid systems mix jackets and air channels to hold winding temperature within ±5 °C, stabilizing flux and encoder accuracy in precision servos.
Liquid cooling introduces new bill-of-materials items, such as thermal interface pads and manifolds, that add 8-12% to unit cost. Nevertheless, vehicle integrators absorb the premium because it delays derating and keeps performance consistent across broad ambient ranges. For stationary industrial settings, the trade-off depends on piping complexity and coolant maintenance protocols, yet demand rises in petrochemical plants where ambient temperatures exceed 50 °C and air cooling proves inadequate.
By End-User Industry: Energy Projects Surge
Automotive remained the largest user at 37.24% of 2025 demand, anchored by global light-vehicle electrification that hit 22% that year. Still, utilities are the fastest movers, with renewable-energy and hydro operators pursuing 9.90% CAGR as direct-drive generators eliminate gearboxes responsible for 15-20% of wind downtime. Industrial automation increasingly embeds servo motors with sub-millisecond torque response, empowering lights-out factories and human-robot collaboration. Mining, oil and gas follow, where energy savings of 4-7 percentage points per 100 kW motor justify premium capital amid high electricity or diesel costs.
Water and wastewater plants, aerospace and defense, consumer electronics, and healthcare round out the application landscape, with MRI-ready surgical robots and portable ventilators valuing low electromagnetic emissions and compact mass.
Geography Analysis
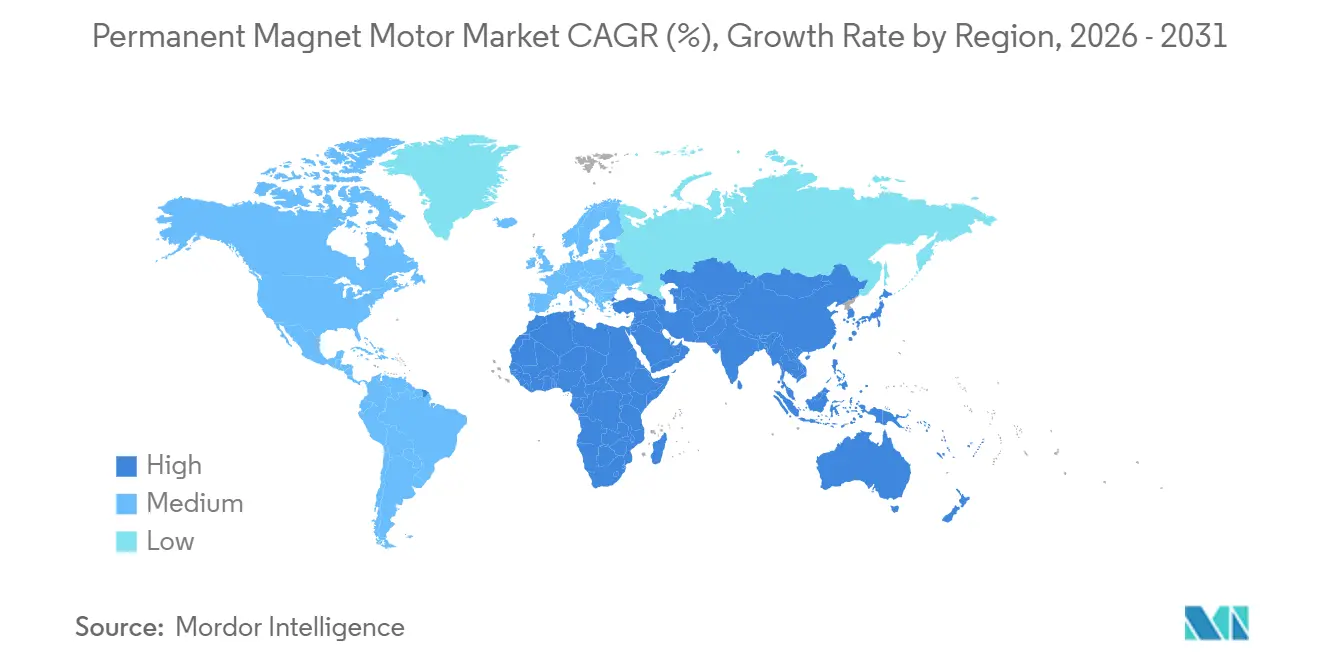
Asia-Pacific generated 43.50% of 2025 revenue and continues at a 9.58% CAGR as China’s vertically integrated chain shrinks lead times to under eight weeks. Japan leverages samarium-cobalt prowess for aerospace contracts insulated from Chinese competition, while South Korea channels KRW 1.8 trillion (USD 1.35 billion) into hairpin winding and segmented rotor capacity for Hyundai and LG projects. India, buoyed by production-linked incentives, speeds adoption of 1-5 kW brushless hub motors in two-wheelers and auto-rickshaws that meet cost targets by substituting ferrite magnets.
North America and Europe invest heavily in supply-chain regionalization. The U.S. Department of Defense awarded USD 285 million for domestic separation and magnet facilities aiming to cut import reliance below 50% by 2030. The European Union’s Critical Raw Materials Act requires 15% local rare-earth sourcing by 2028, spurring projects from Sweden’s Norra Kärr mine to German recycling plants. Inflation Reduction Act incentives push automakers toward U.S. magnet content despite a 12-18% procurement premium, since vehicles qualify for USD 7,500 consumer tax credits. Offshore wind ambitions of 60 GW by 2030 require vast permanent-magnet generator volumes, and long-term supply agreements already lock in price and availability.
Middle East and Africa plus South America show selective adoption. Gulf desalination plants retrofit high-pressure pumps with permanent magnet drives that cut energy use by up to 25%. Chilean and Peruvian copper mines trial conveyor and ventilation conversions that save over 1.2 GWh per site per year. Sub-Saharan markets remain price-sensitive but install solar-powered brushless DC irrigation pumps that avoid inverter costs, expanding crop yields where grid service is unreliable.

Regulatory Landscape
Energy-efficiency regulation continues to tighten around the motor classes where permanent magnet designs compete most directly with induction alternatives. In the United States, the Department of Energy finalized IE4-level requirements for 1-500 horsepower motors in March 2024, with an effective date in January 2027. In February 2026, it initiated an additional standards process for small electric motors (Federal Register 2026-02936), extending compliance attention further into fractional and small-horsepower applications where brushless designs are common.
In Europe, Regulation (EU) 2024/1781 (Ecodesign for Sustainable Products) adopted on June 13, 2024 expands the policy toolkit beyond energy-in-use toward broader product sustainability requirements. The EU Critical Raw Materials Act also adds permanent-magnet-related labeling obligations, with an implementing act due by November 24, 2026. In China, GB 30253-2024 sets minimum allowable energy-efficiency values and grades for permanent magnet synchronous motors, with implementation beginning October 1, 2025, reinforcing a parallel push toward higher efficiency grades across major manufacturing geographies.
Value Chain Analysis
The permanent magnet motor value chain starts with rare-earth mining and chemical processing (notably NdPr and heavy rare earths such as Dy/Tb), then moves through alloying and strip casting, powder processing, magnet fabrication and coating, and finally motor component manufacturing (stators, rotors, windings, shafts, bearings) and assembly with drives and controls. Downstream channels include direct OEM supply into automotive traction and auxiliaries, industrial automation (servos, pumps, compressors), and energy applications (direct-drive wind generators and hydro upgrades). Aftermarket activity is largely centered on retrofit programs and replacement of legacy motors to meet tightening efficiency rules.
Key bottlenecks and risk points sit upstream in separation capacity for Dy/Tb and in magnet manufacturing concentration. This was highlighted by China export controls introduced in April 2025 that required licenses and sharply reduced exports in the following months, and by cost shocks such as a 25% duty on imported NdFeB magnets taking effect in January 2026. The chain is responding with more emphasis on recycling and reduced-heavy-rare-earth designs, exemplified by Nidec's magnet-recycling joint venture in November 2025 (reclaiming 85% rare-earth content from scrap motors) and by product moves such as Compage Automation Systems announcing heavy-rare-earth-free PMSM platforms (90-300 kW) in November 2025 for trials with a construction and mining equipment OEM.
Competitive Landscape
The top five suppliers ABB, Siemens, Nidec, Rockwell Automation, and Mitsubishi Electric controlled roughly 40% of global revenue in 2025, yet none surpassed 12%, underscoring a moderately concentrated field. Leaders acquire magnet recyclers and additive-manufacturing firms to secure feedstock and deliver custom rotors within four-week windows. ABB’s September 2024 purchase of a European recycler covers 15-20% of its neodymium needs, while Nidec plans 4 million traction motors annually by 2028 through Chinese, Mexican, and Serbian expansions.
Patent filings in flux-weakening control and thermal materials climbed 32% year-over-year, with Siemens and Hitachi each lodging more than 40 applications in 2024-2025. Regional players such as Wolong Electric and WEG capture cost-sensitive pump and fan orders by undercutting multinational prices up to 30% yet still meeting IE3 norms.
White-space opportunities surface in ultra-high-speed motors above 30,000 rpm for electric aircraft and hydrogen compression. Only a handful of suppliers master soft-magnetic composites required to slash eddy losses at such speeds, positioning them for premium margins. The competitive map thus bifurcates between high-volume platforms that reward automation and niche segments that prize bespoke designs and rapid prototyping.
Permanent Magnet Motor Industry Leaders
ABB Limited
Rockwell Automation
Siemens AG
Franklin Electric Company Inc.
Allied Motion Technologies Inc.
- *Disclaimer: Major Players sorted in no particular order

Market Opportunities and Future Outlook
A near-term opportunity is centered on compliance-driven upgrades and line replacements as efficiency standards tighten and OEMs narrow their approved motor lists, particularly in the 1-500 hp industrial range around the U.S. DOE January 2027 effective date and in markets aligning to newer China and EU sustainability requirements. Suppliers that pair high-efficiency permanent magnet motors with compact thermal management and integrated drives have openings in space- and energy-constrained environments. This is supported by recent commercial launches, including ABB's April 2026 water-jacket cooled permanent magnet motor series for marine propulsion and onboard hybrid applications.
Supply-chain and materials risk is also creating whitespace for vertical integration and alternatives to heavy rare earths, including recycling-linked sourcing, heavy-rare-earth-free PMSM designs, and rare-earth-free magnet pathways. Evidence of capital moving into higher-power and higher-volume capacity includes Inovance Technology breaking ground in April 2026 on a new high-voltage permanent magnet motor facility in Dalian (about RMB 2 billion) and Innomotics commencing production in June 2026 at a new Tianjin factory with 2,500 MW annual capacity. Both developments align with demand from heavy industry electrification and net-zero retrofit programs. At the same time, magnet supply-security initiatives such as POSCO International's April 2026 plan to expand rare earth production capacity to 4,500 tons annually, and R&D signals like Vimag Labs' July 2026 magnet-free motor patent announcement, point to an active shift toward diversified magnet and motor architectures alongside traditional NdFeB-optimized designs.
Recent Industry Developments
- July 2026: Niron Magnetics signed a supply agreement with ASPINA to develop rare-earth-free motor solutions based on Niron's iron nitride permanent magnet technology. The collaboration targets automotive, industrial, and robotics end markets, supporting motor OEM efforts to reduce reliance on NdFeB supply chains during periods of export controls and price volatility.
- April 2026: ABB launched a new series of water-jacket cooled permanent magnet motors designed for marine applications, citing up to 98% efficiency and up to 60% reduction in mounting volume. The release expands addressable applications where power density and thermal control are critical, including thrusters and hybrid ship propulsion packages.
- September 2024: ABB acquired a European magnet recycler to cover a portion of its neodymium requirements. The move strengthened feedstock resilience and created a pathway to reduce exposure to rare-earth price swings and supply disruptions for high-efficiency motor platforms.


Research Methodology Framework and Report Scope
Market Definition and Coverage
This market covers the revenue earned from permanent magnet motors sold for use in equipment and systems across industrial and commercial end uses, counted at the point of motor supply and captured in USD terms across major regions.
Scope exclusions: We exclude related drive electronics (inverters and motor controllers), gearboxes, and downstream service revenue unless it is bundled with the motor sale.
Segmentation Overview
- By Motor Type
- Permanent Magnet AC Motor
- Permanent Magnet DC Motor
- Brushless DC Motor
- Hermetic Motor
- By Magnetic Material Type
- Neodymium Iron Boron
- Samarium Cobalt
- Ferrite
- Nanocomposite NdFeB
- By Power Rating
- Up to 4 kW
- 4-22 kW
- 22-75 kW
- 75 kW and Above
- By Cooling Method
- Air-Cooled
- Liquid-Cooled
- Oil-Cooled
- Hybrid Cooling
- By End-User Industry
- Automotive
- Industrial Automation
- Energy (Wind and Hydro)
- Water and Wastewater Management
- Mining, Oil and Gas
- Aerospace and Defense
- Consumer Electronics
- Healthcare Equipment
- By Geography
- North America
- United States
- Canada
- Mexico
- Europe
- United Kingdom
- Germany
- France
- Italy
- Rest of Europe
- Asia-Pacific
- China
- Japan
- India
- South Korea
- Rest of Asia
- Middle East
- Israel
- Saudi Arabia
- United Arab Emirates
- Turkey
- Rest of Middle East
- Africa
- South Africa
- Egypt
- Rest of Africa
- South America
- Brazil
- Argentina
- Rest of South America
- North America
Data Sources, Market Sizing, and Validation
Desk Research
Desk research was used to build the fact base for demand signals and supply constraints that affect permanent magnet motor shipments and pricing. We relied on public sources such as the International Energy Agency (IEA), the International Trade Centre (ITC) trade statistics, the United States Geological Survey (USGS) for rare earth magnet supply indicators, and standards and efficiency references from bodies such as the IEC and NEMA.
Along with these, we reviewed company annual reports, investor presentations, product catalogs, and reputable press coverage to understand product positioning and how application adoption typically happens. For consistency checks, we also used paid subscriptions for company financial intelligence, news and financials screening, and patent databases to track motor and magnet design activity. The desk sources listed here are illustrative, and we used additional public references for collection, validation, and clarification.
Primary Interviews and Surveys
Primary work focused on interviews and structured surveys with motor manufacturers, magnet and component ecosystem participants, distributors, and large end users that specify motors for equipment builds. Coverage was kept global so adoption differences in manufacturing-heavy APAC, regulated efficiency markets in EMEA, and replacement-led demand in the Americas could be checked, then used to validate assumptions coming from desk research.
Distribution of primary research fieldwork respondents
| Company type | Respondent position | Region |
|---|---|---|
| Top tier: 29% | CXOs: 16% | APAC: 43% |
| Mid tier: 50% | Functional/Unit leaders: 25% | EMEA: 37% |
| Smaller Players: 21% | Managers: 59% | Americas: 20% |
Market-Sizing & Forecasting
Sizing was built using a combined top-down and bottom-up logic so the market number stays tied to real activity and is explainable. On the top-down side, we reconstructed the demand pool by linking motor consumption to sector output and equipment build activity across key end uses, then translating that demand into value using observed price bands and mix shifts.
Those totals were corroborated with selective bottom-up approximations such as sampled supplier revenue splits, channel checks on unit volumes, and ASP times volume cross-checks for common power-rating ranges. Inputs that mattered most in the model included manufacturing output trends, efficiency regulation and retrofit cycles, the relative penetration of permanent magnet designs versus other motor types in selected applications, rare earth magnet price direction as a cost proxy, and cooling method and power-rating mix that affects typical pricing. Where bottom-up signals were incomplete in smaller countries or niche end uses, we filled gaps using ratio-based benchmarks from similar markets, and we reviewed those assumptions again during primary calls.
For forecasting, scenario analysis was used so adoption and pricing drivers could be flexed without over-fitting the history. The forward view was anchored on expected industrial production, electrification and automation investment pace, and a practical ASP progression that reflects cost pass-through and product mix upgrades rather than a single uniform price curve.
Data Validation & Update Cycle
Validation was done through multiple checks so the final market value does not rely on one data series. Analysts compared outputs with independent signals such as trade flows for motor categories, rare earth supply indicators, and observed ordering patterns discussed by industry participants, then investigated outliers before sign-off.
If a variance was too large by region, end use, or price band, we rechecked the assumptions and, when needed, re-contacted sources to clarify what was actually being counted as a permanent magnet motor sale. Reports are refreshed annually, and interim updates are triggered when material events shift magnet supply, pricing, or the demand outlook. Before delivery, a final analyst pass is completed so clients receive an updated view that matches the latest available public releases.
Mordor Intelligence's Permanent Magnet Motor Market Size Compared With Other Published Estimates
It is common to see different market sizes for permanent magnet motors because studies do not always count the same product boundaries, year definitions, or pricing assumptions. Differences also show up when one estimate leans more on shipment growth narratives, while another ties value more tightly to what end users actually buy by application mix.
Key gap drivers in this market usually come from whether adjacent items like drives and controls are included, how the study treats motors used in EV traction versus general industrial motors, and the way ASPs are moved forward when magnet costs change quickly. By tracking efficiency-standard adoption, application-level penetration, and ASP mix by power rating, Mordor Intelligence keeps the total focused on motor revenue only, then stress-tests it through interview-based checks across regions.
Benchmark comparison
| Source | Market Size | Gaps in Research Methodology |
|---|---|---|
| Mordor Intelligence | USD 57.94 B (2026) | |
| Global Consultancy A | USD 58.68 B (2025) | Uses a different base year and may blend end-use boundaries in a way that lifts value, especially if bundled drive components or broader electronics scope are partially counted in pricing. |
| Industry Research Group B | USD 53.63 B (2024) | Starts earlier in the cycle and can lean on a more conservative value build, where price bands and mix upgrades by power rating and cooling method are not adjusted as frequently. |
The spread between estimates is mostly explained by base-year choice, what is treated as in-scope motor revenue, and how fast prices are updated when magnet input costs shift. Using clearly stated boundaries and repeatable checks on demand indicators and pricing mix helps keep the value traceable and usable for planning.


Key Questions Answered in the Report
How large is the permanent magnet motor market today?
The market reached USD 57.94 billion in 2026 and is projected at USD 89.47 billion by 2031, reflecting a 9.08% CAGR.
Which end-user segment is expanding fastest?
Renewable-energy operators, notably offshore wind and modernized hydropower plants, are growing at 9.90% CAGR as they adopt direct-drive permanent-magnet generators.
Why are liquid-cooled motors gaining popularity?
800-volt electric-vehicle platforms and high-speed industrial spindles push current densities that air cooling cannot manage, so liquid jackets unlock 15-20% higher continuous power within the same footprint.
How are suppliers mitigating rare-earth price volatility?
Manufacturers pursue grain-boundary diffusion to cut heavy rare-earth usage and invest in recycling ventures that reclaim up to 85% of magnet material from end-of-life motors.
Which regions are investing in local rare-earth supply?
The United States and European Union are funding separation plants and recycling facilities aimed at reducing import dependence to below 50% and sourcing 15% locally, respectively.
What role do regulations play in adoption?
Upcoming IE4 and IE5 efficiency mandates in the United States, Europe, and Japan effectively steer new and replacement motors toward permanent-magnet or synchronous-reluctance designs that meet higher efficiency thresholds.
Page last updated on:


 Your data is secure and never sold or shared.


