
Cold Chain Logistics Market Size and Share
Market Overview
| Study Period | 2020 - 2031 |
|---|---|
| Market Size (2026) | USD 384.85 Billion |
| Market Size (2031) | USD 518.08 Billion |
| Growth Rate (2026 - 2031) | 6.13 % |
| Fastest Growing Market | Asia-Pacific |
| Largest Market | Asia Pacific |
| Market Concentration | Low |
Major Players *Disclaimer: Major Players sorted in no particular order Image © Mordor Intelligence. Reuse requires attribution under CC BY 4.0. | |
Cold Chain Logistics Market Analysis by Mordor Intelligence
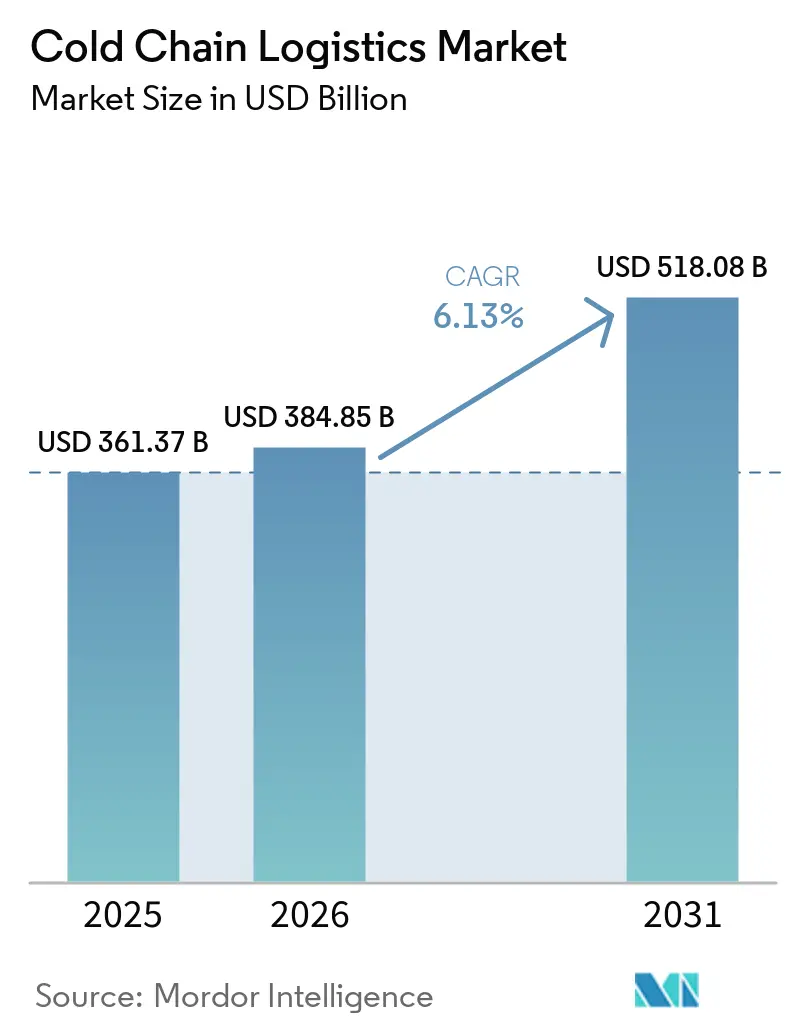
The cold chain logistics market size was valued at USD 361.37 billion in 2025, and is estimated to grow from USD 384.85 billion in 2026 to reach USD 518.08 billion by 2031, at a CAGR of 6.13% during the forecast period (2026-2031).
The market is being shaped by demand for reliable handling of vaccines, biologics, fresh food, and protein shipments. Quick-commerce platforms are also placing more refrigerated inventory closer to dense urban populations. Shippers now place greater weight on real-time temperature records, energy use, and compliance across storage and transport. These requirements favor operators that can link warehouses, transport fleets, and data systems without breaking the temperature chain. The United States FDA extended the FSMA 204 traceability compliance deadline by 30 months to July 2028, giving cold-chain operators an engineering window; the core requirement is electronic records for key data elements at critical tracking events retrievable within 24 hours. The competitive response combines automation, acquisitions, and more specialized fulfillment services.
Key Report Takeaways
- By service type, temperature-controlled storage held 52.37% of the cold chain logistics market share in 2025, while value-added services are forecast to register at a 7.73% CAGR through 2031.
- By temperature type, chilled and refrigerated handling accounted for 48.85% of the cold chain logistics market size in 2025, while deep-frozen or ultra-low-temperature handling is forecast to register at an 8.11% CAGR through 2031.
- By application, meat and poultry held 22.17% of the cold chain logistics market share in 2025, while vaccines and clinical trial materials are forecast to register at an 8.94% CAGR through 2031.
- By geography, Asia-Pacific held 40.14% of the cold chain logistics market share in 2025 and is forecast to register at a 7.45% CAGR through 2031.
Note: Market size and forecast figures in this report are generated using Mordor Intelligence’s proprietary estimation framework, updated with the latest available data and insights as of 2026.
Market Trends and Insights
Drivers Impact Analysis of Cold Chain Logistics Market*
| Driver | (~) % Impact on CAGR Forecast | Geographic Relevance | Impact Timeline |
|---|---|---|---|
| Ultra-Low-Temperature mRNA Vaccine Distribution | +1.4% | Global, concentrated in North America, Europe, and Asia-Pacific | Medium term (2-4 years) |
| Pharmaceutical Outsourcing to GDP-Compliant 3PLs | +1.3% | Global, concentrated in Europe, North America, and Northeast Asia | Medium term (2-4 years) |
| FSMA 204 Traceability and Real-Time IoT Temperature Monitoring | +1.1% | North America primarily, with Europe affected by parallel GDP mandates | Medium term (2-4 years) |
| Quick-Commerce Grocery and Same-Day Refrigerated Delivery | +1.0% | Asia-Pacific core, with spillover to North America and Europe | Short term (≤ 2 years) |
| China Ready-to-Cook Meal Growth and Tier-2 City Storage Leasing | +0.9% | China, with early gains in Changsha, Zhengzhou, Xi'an, and Chengdu | Short term (≤ 2 years) |
| Solar-Powered Cold Warehouses to Reduce Post-Harvest Losses | +0.8% | Sub-Saharan Africa, South Asia, and Southeast Asia | Medium term (2-4 years) |
| Source: Mordor Intelligence | |||
Ultra-Low-Temperature mRNA Vaccine Distribution
The cold chain logistics market is seeing a stronger need for deep-frozen capacity as mRNA products move through development and distribution. This keeps specialized refrigeration relevant for vaccine distribution, clinical trials, and advanced therapies. Better product stability can extend distribution reach and bring additional patients into vaccine programs. That broader reach can add temperature-controlled volumes rather than remove the need for cold-chain services. Cencora’s December 2025 acquisition of NextPharma Logistics added 5 GDP-compliant warehouses in Germany, Austria, and Switzerland, while CEVA Logistics extended its Polish distribution agreement with GSK for 5 years in July 2026, covering more than 9,830 m² of controlled-temperature space.
Pharmaceutical Outsourcing to GDP-Compliant 3PLs
The cold chain logistics market is gaining from manufacturers transferring temperature-sensitive distribution to GDP-compliant third-party logistics providers. European Medicines Agency guidance and the United States Drug Supply Chain Security Act have increased the importance of validated equipment, qualified staff, and continuous monitoring. This transfer of responsibility raises the capital and quality threshold for new service providers. Maersk reported in July 2026 that GDP-certified cold storage located near major ports is a factor that pharmaceutical companies use when selecting distribution partners. Multi-temperature and GDP-validated facilities can, therefore, command a service premium over sites that lack documented controls.
FSMA 204 Traceability and Real-Time IoT Temperature Monitoring
The cold chain logistics market is adapting to traceability rules that make digital records more central to food distribution. The United States Food and Drug Administration extended the FSMA 204 compliance date by 30 months to July 2028, while the underlying recordkeeping requirements remained in place.[1] Covered businesses need electronic records for key data elements at critical tracking events that can be retrieved within 24 hours. The extension provides operators more time to connect sensors, warehouse systems, and transport records. Those investments can improve regulatory readiness and daily service control at the same time. FDA requirements and the European Union’s GDP guidance remain important compliance frameworks for cold-chain data investment.
Quick-Commerce Grocery and Same-Day Refrigerated Delivery
The cold chain logistics market is also changing as grocery delivery networks shorten the time between order placement and fulfillment. China’s instant retail activity exceeded RMB 1.2 trillion (USD 171.39 million) in 2025 and delivered more than 600 billion orders, with orders rising 25% year-over-year. Refrigerated reliability has gained importance as delivery speed becomes easier for competitors to match. Amazon’s same-day grocery network reached more than 1,000 United States cities and planned to expand to more than 2,300 areas through refrigerated fulfillment rooms and insulated last-mile packaging in August 2025.[2]Americold shipped more than 1 million temperature-controlled direct-to-consumer packages during FY 2025, with double-digit growth and coverage of 99.5% of the United States population within 2 days. Micro-fulfillment centers ranging from 3,000 to 10,000 square feet are being used to hold frozen, chilled, and ambient inventory close to consumer clusters.
Restraints Impact Analysis of Cold Chain Logistics Market*
| Restraint | (~) % Impact on CAGR Forecast | Geographic Relevance | Impact Timeline |
|---|---|---|---|
| CDL-Certified Reefer Driver Shortage in the United States | -0.7% | North America, concentrated in the United States Sunbelt and rural reefer corridors | Short term (≤ 2 years) |
| Ammonia and CO₂ Cascade Retrofit Costs for EU F-Gas Compliance | -0.5% | Europe, particularly legacy sites in Germany, France, the Netherlands, and Spain | Medium term (2-4 years) |
| Electricity Instability in Sub-Saharan Africa | -0.4% | Sub-Saharan Africa, with elevated exposure in South Africa, Nigeria, Zambia, and Zimbabwe | Long term (≥ 4 years) |
| Fragmented Small-Scale Cold-Room Ownership in India | -0.3% | India, especially states outside Uttar Pradesh and West Bengal | Long term (≥ 4 years) |
| Source: Mordor Intelligence | |||
CDL-Certified Reefer Driver Shortage in the United States
The cold chain logistics market faces a labor constraint that is structural rather than cyclical. The American Trucking Associations estimated 60,000 unfilled CDL driver positions in 2026 and projected a shortage of 160,000 to 175,000 positions by 2028 as retirements increase. A March 2026 federal rule restricting CDL access for certain immigrant categories was estimated to affect 200,000 active CDL holders.[3] Texas reported a 31% decline in CDL renewals in April 2026 compared with the same month in 2025. Reefer freight is more exposed than dry-van freight because temperature monitoring and handling requirements limit the pool of qualified drivers.
Ammonia and CO₂ Cascade Retrofit Costs for EU F-Gas Compliance
The cold chain logistics market in Europe faces a period of equipment replacement and facility retrofits under the EU F-Gas framework. Regulation (EU) 2024/573 drives a phase-down of fluorinated greenhouse gases and supports the move away from legacy high-global-warming-potential refrigerants. Deep-frozen sites using older equipment face added spending on ammonia or CO₂-based systems.[4] The burden is higher in legacy facilities across Germany, France, the Netherlands, and Spain. Operators also need to manage construction periods without compromising customer inventory or service levels. These capital needs can slow expansion at individual sites even when demand for specialized refrigeration remains strong.
*Our forecasts treat driver/restraint impacts as directional, not additive. The impact forecasts reflect baseline growth, mix effects, and variable interactions.
Cold Chain Logistics Market Segment Analysis
By Service Type:
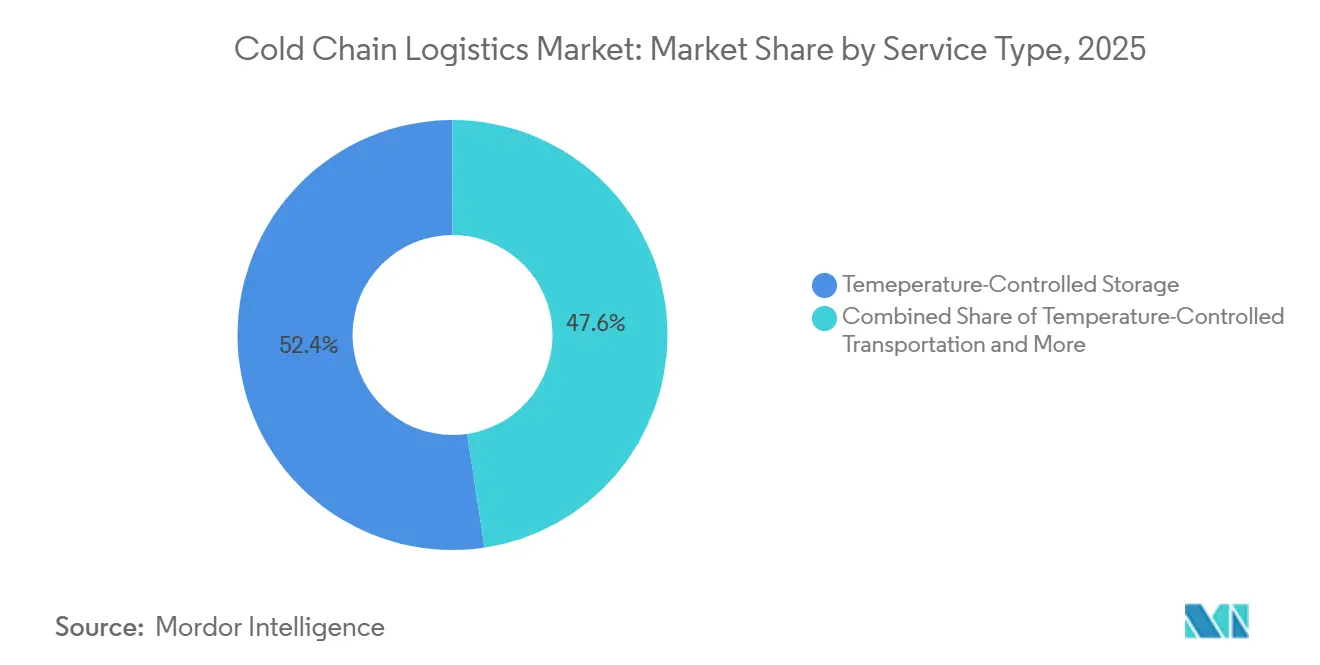
Value-Added Services Outpace Core Storage in GrowthTemperature-controlled storage held 52.37% of the cold chain logistics market share in 2025. It remains the operating base for port-adjacent hubs, inland logistics parks, and urban distribution centers. Storage is delivered through public and private warehousing models. Temperature-controlled transportation covers road, rail, sea, and air links. These modes carry refrigerated goods between production, storage, ports, and customers. The cold chain logistics market, therefore, continues to rely on storage capacity as the main physical anchor for service networks.
Value-added services are forecast to register at a 7.73% CAGR from 2026 to 2031, the fastest rate within this segmentation. Blast freezing, labeling, and inventory management are central to this service group. Fast freezing can protect shelf life in meat exports and support drug stability in biopharma operations. The Global Cold Chain Alliance reported that its top 25 global operators held 7.76 billion cubic feet of temperature-controlled space in 2026, 6.3% more than in 2025. Operators are adding fulfillment platforms, real-time inventory tools, and cold-pack capabilities to move beyond pallet-rate pricing. Americold’s direct-to-consumer activity shows how warehouse operators are extending into consumer fulfillment.

By Temperature Type:
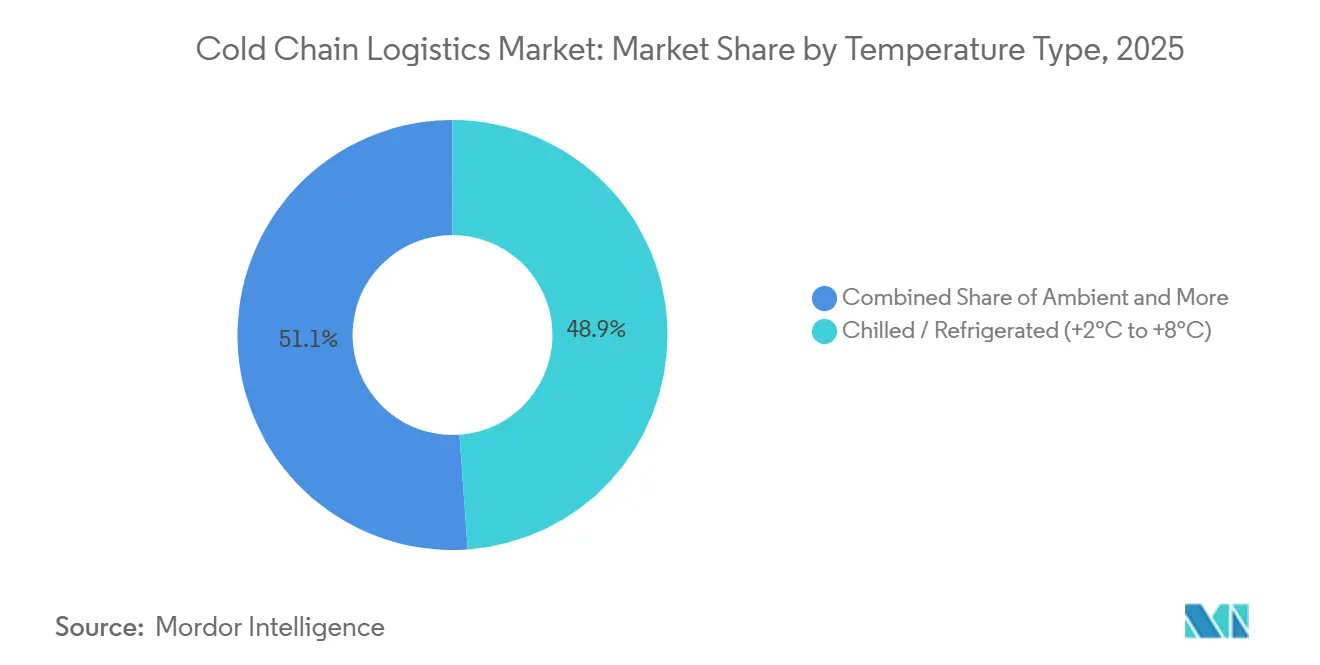
Deep-Frozen Demand Expands the Case for Ultra-Low InfrastructureChilled and refrigerated handling at +2 °C to +8 °C accounted for 48.85% of the cold chain logistics market size in 2025. This temperature range serves fresh produce, dairy, pharmaceuticals, and chilled ready-to-eat meals. It is particularly relevant to urban food distribution across East Asia. Frozen handling at -25 °C to -15 °C supports much of the meat, seafood, and ice cream trade. Controlled ambient handling at +15 °C to +25 °C serves products such as wine, confectionery, and selected pharmaceutical intermediates. Each category requires separate operating procedures and monitoring practices.
Deep-frozen and ultra-low-temperature handling below -40 °C are forecast to register at an 8.11% CAGR through 2031. The rate reflects demand for clinical trial materials, cell therapies, gene therapies, and mRNA products. Research on next-generation mRNA vaccines found that thermostable formulations remained in preclinical and early clinical stages in early 2026. Near-term reliance on -60 °C to -80 °C infrastructure, therefore, remains entrenched for many mRNA products. Regulation (EU) 2024/573 adds a second investment need because legacy systems using high-GWP refrigerants need replacement or retrofitting. This combination of pharmaceutical demand and refrigerant transition supports investment in specialized cold rooms.
By Application:
Biopharma Leads Growth, Protein Anchors VolumeMeat and poultry held 22.17% of the cold chain logistics market share in 2025. International protein trade, especially from the Americas to the Asia-Pacific, supports this position. These shipments need an unbroken frozen chain across ocean transport, ports, warehouses, and last-mile delivery. Fish and seafood, dairy and frozen desserts, fruits and vegetables, and bakery and confectionery form the remaining major food uses. Each product category has its own temperature profile and handling needs. Conventional food corridors continue to provide the base volume for refrigerated logistics networks.
Vaccines and clinical trial materials are forecast to register at an 8.94% CAGR through 2031. The expansion of clinical trials and the rollout of mRNA, viral-vector, and cell-based therapies support this demand. Pharmaceuticals and biologics, chemicals and specialty materials, and other applications add further requirements for controlled handling. DSCSA traceability requirements have raised the compliance threshold for pharmaceutical cold-chain operators. DSCSA operates with separate quality standards, audit cycles, and documentation from food logistics. Providers with validated systems and qualified personnel are better placed to serve this regulated application.
Geography Analysis
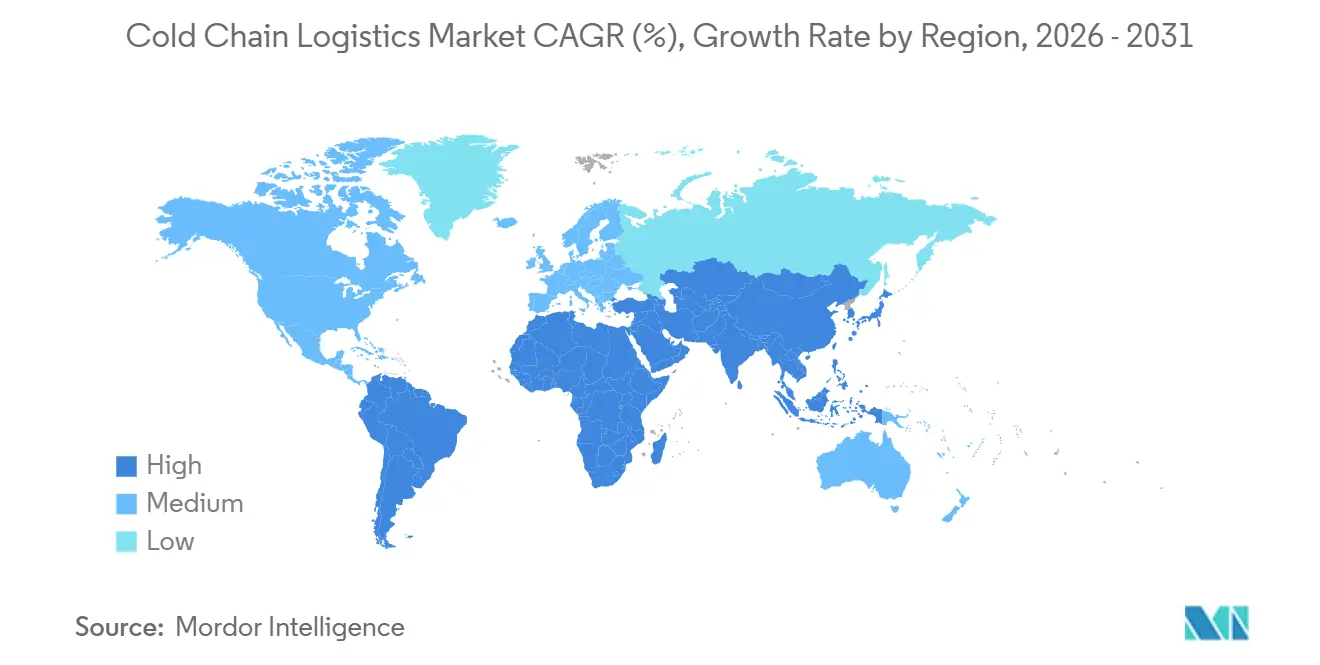
Asia-Pacific held 40.14% of global revenue in 2025, giving it the largest cold chain logistics market share, and is forecast to register at 7.45% CAGR through 2031. China supports this position with around 267 million cubic meters of cold-storage capacity and reported 105 national backbone logistics bases in 2025. Ready-to-cook meal demand is increasing storage leasing in interior tier-2 and tier-3 cities. India is growing rapidly in the region, supported by the PM Gati Shakti infrastructure plan and private investment. Pharmaceutical and food retail expansion is also drawing organized capacity into secondary cities in Vietnam, Indonesia, and Thailand.
The cold chain logistics market in North America has a mature network centered on the United States. According to the GCCA, the North American top 25 companies operate more than 5 billion cubic feet of refrigerated space. That amount represents more than four-fifths of North American capacity. Canada is becoming a stronger transit hub for protein exports. Americold’s Port Saint John hub combines cold storage, DP World maritime logistics, and CPKC rail services. Europe remains important for GDP, pharmaceutical logistics, frozen-food trade, and equipment investment tied to F-Gas compliance. The European regulatory path is changing capital allocation across Germany, France, the Netherlands, and the United Kingdom.
The cold chain logistics market in South America is experiencing consolidation, with Brazil and the Andean corridor seeing acquisitions and network restructuring. The Middle East and Africa have a divided operating environment. Saudi Arabia, the UAE, and Qatar are investing in modern infrastructure for imported food and pharmaceutical distribution. Sub-Saharan Africa faces more persistent electricity risks in South Africa, Nigeria, Zambia, and Zimbabwe. Solar-hybrid cold storage is expanding across East and West Africa as a practical response. The move from grid dependence to energy-resilient infrastructure will take several years and limits the speed of organized expansion in parts of the region.
Mordor Intelligence provides coverage of the cold chain logistics market across other key regional markets, including Africa and South America, each with their regulatory frameworks and demand patterns. Detailed country-level analysis extends to Mexico, Indonesia, Sweden, Netherlands, and Thailand incorporating local coverage and market participation, as required.
Competitive Landscape
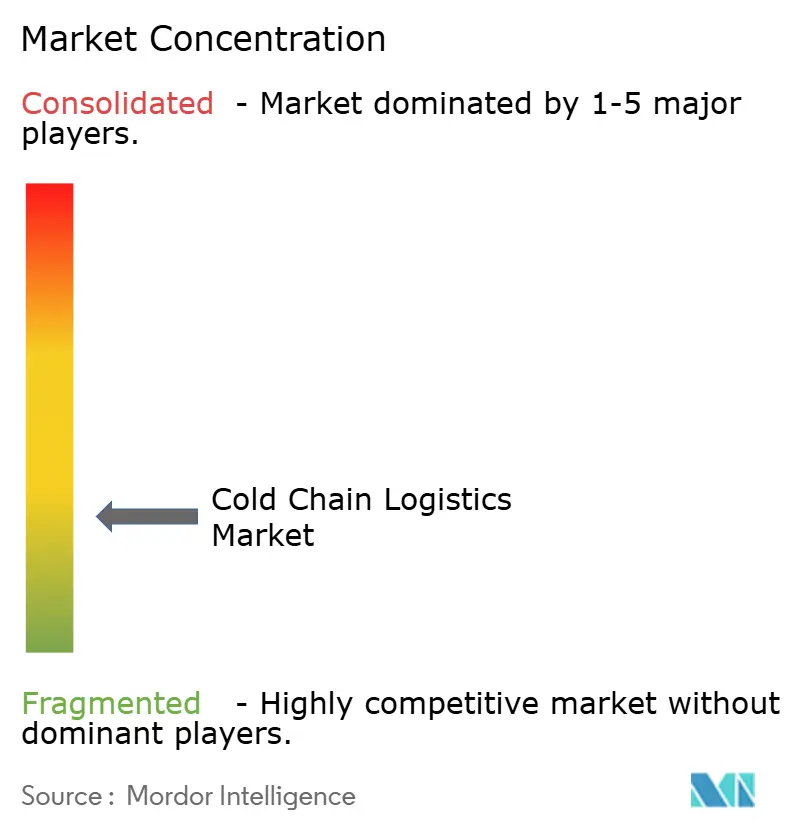
The cold chain logistics market is fragmented overall, although the largest operators are increasing their scale. Lineage, Americold, NewCold, United States Cold Storage, and Emergent Cold Latin America form the leading group. Regional operators retain meaningful roles in first-mile agricultural handling, pharmaceutical last-mile services, and secondary-city warehousing. Leading companies are raising pallet density through automated high-bay warehouses. They are also using acquisitions to enter areas where building permits take time. Service differentiation includes blast freezing, e-commerce fulfillment, real-time inventory visibility, and GDP-qualified handling.
Americold closed a joint venture with EQT in August 2026 that covered 12 facilities in the United States with USD 1.3 billion in gross asset value. As per the agreement, EQT holds 70%, while Americold holds 30% and retains operational management. The transaction gave Americold around USD 1.1 billion in net cash proceeds for debt repayment. Lineage deployed its LinOS warehouse execution technology at its Hazelton, Pennsylvania, greenfield site in 2025. The technology supports a model where software and operational integration matter alongside physical space. These moves show how capital recycling and proprietary systems are becoming part of competitive strategy.
GDP-compliant biopharma logistics in second-tier European and Southeast Asian cities remains less developed than major gateway locations. Urban micro-fulfillment that combines chilled and frozen pick-and-pack is another area where many cold chain logistics market models have not yet reached scale. Solar-hybrid storage in sub-Saharan Africa and South Asia is still at an early commercial stage, even where public programs have demonstrated its technical use. Constellation Cold Logistics has around 1.2 million pallet positions in 10 European countries and illustrates how sustained acquisitions can build cross-border scale. Smaller operators without network depth or proprietary technology face growing consolidation pressure.
Cold Chain Logistics Industry Leaders
-
Lineage Logistics
-
Americold Logistics
-
NewCold Advanced Cold Logistics
-
Nichirei Logistics Group Inc.
-
Constellation Cold Logistics
- *Disclaimer: Major Players sorted in no particular order
Cold Chain Logistics Market Companies Covered in this Report
- Lineage Logistics
- Americold Logistics
- NewCold Advanced Cold Logistics
- Nichirei Logistics Group Inc.
- Constellation Cold Logistics
- United States Cold Storage, Inc.
- Frigolanda Cold Logistics Group
- Emergent Cold Latin America
- Snowman Logistics Ltd.
- Conestoga Cold Storage
- Interstate Cold Storage, Inc.
- SuperFrio Logistica Frigorificada
- Vertical Cold Storage
- Magnavale Ltd.
- Cube Cold Europe
- Arcadia Cold Storage and Logistics
- Congebec Inc.
- Cold-Link Logistics
- Agile Cold Storage LLC
- Groupe Conhexa
Recent Industry Developments in Cold Chain Logistics Market
- September 2026: NewCold completed a USD 200 million expansion at its Truganina facility in Melbourne, Australia, adding 80,000 pallet positions and raising total site capacity to 180,000 pallet positions across frozen, chilled, and ambient storage, supported by its anchor relationship with McCain Foods.
- August 2026: Americold successfully closed its USD 1.3 billion joint venture with EQT's Active Core Infrastructure fund, covering 12 temperature-controlled warehouses in the United States. EQT holds 70%, and Americold retains 30% with operational management. Americold received USD 1.1 billion in net cash proceeds directed toward debt repayment.
- June 2026: Americold opened its integrated import-export hub at Port Saint John, New Brunswick, in partnership with DP World and Canadian Pacific Kansas City. The facility holds 22,000 pallet positions and co-locates cold storage, maritime logistics, and continental rail at 1 site.
- May 2026: Americold secured a multi-year agreement with Jeronimo Martins to manage storage and store-case-pick fulfillment of 12 million cases of frozen products annually for 300 retail stores across Portugal. The contract expanded the Lisbon site workforce by more than 40%.
Cold Chain Logistics Market Report Scope and Research Methodology
Market Definition and Coverage
Our study defines the cold chain logistics market as the end-to-end revenue generated from temperature-controlled storage, transportation, and value-added handling of perishable food, biopharmaceutical, and specialty chemical cargo that must remain within chilled, frozen, or ultra-low ranges from origin through final delivery. According to Mordor Intelligence, this includes public and private refrigerated warehouses, dedicated reefer fleets across road, rail, sea, and air, plus ancillary services such as blast-freezing and GDP compliance audits.
Scope exclusion: we exclude domestic ice-cream street vending, HVAC equipment sales, and one-time dry-ice packaging rentals.
Segments Covered in This Report
- By Service Type
- Temperature-Controlled Storage
- Public Warehousing
- Private Warehousing
- Temperature-Controlled Transportation
- Road
- Rail
- Sea
- Air
- Value-added Services (Blast Freezing, Labeling, Inventory Management, etc.)
- Temperature-Controlled Storage
- By Temperature Type
- Chilled / Refrigerated (+2 °C to +8 °C)
- Frozen (-25 °C to -15 °C)
- Controlled Ambient / Room Temperature (+15 °C to +25 °C)
- Deep-Frozen / Ultra-Low Temperature (below -40 °C)
- By Application
- Fruits and Vegetables
- Meat and Poultry
- Fish and Seafood
- Dairy and Frozen Desserts
- Bakery and Confectionery
- Pharmaceuticals and Biologics
- Vaccines and Clinical Trial Materials
- Chemicals and Specialty Materials
- Other Applications
- By Geography
- North America
- United States
- Canada
- Mexico
- South America
- Brazil
- Argentina
- Peru
- Chile
- Rest of South America
- Europe
- Germany
- United Kingdom
- France
- Italy
- Spain
- Russia
- Nordics (Denmark, Finland, Iceland, Norway, and Sweden)
- Rest of Europe
- Asia-Pacific
- China
- India
- Japan
- South Korea
- Australia
- Southeast Asia (ASEAN)
- Rest of Asia-Pacific
- Middle East and Africa
- Saudi Arabia
- United Arab Emirates
- Qatar
- South Africa
- Nigeria
- Egypt
- Rest of Middle East and Africa
- North America
Data Sources, Market Sizing, and Validation
Primary Research
Mordor analysts conducted interviews and surveys with warehouse operators, pharma quality managers, quick-commerce grocery platforms, and reefer-OEM specialists across North America, Europe, and Asia Pacific. Insights on pallet-turn velocity, lane pricing, and regulatory pain points filled data gaps and calibrated scenario assumptions.
Desk Research
We first screen open-access tier-1 sources such as UN Comtrade shipment codes, USDA cold-store capacity reports, Eurostat road-freight datasets, and WHO GDP guidelines to map product flows and regulatory triggers. Trade bodies like the Global Cold Chain Alliance, regional customs bulletins, and peer-reviewed journals on refrigeration losses further clarify demand pockets. Company 10-Ks, investor decks, and logistics tender notices feed price and capacity benchmarks. Select paid databases (D&B Hoovers for operator revenues and Dow Jones Factiva for deal pipelines) complement public data. The sources listed illustrate the breadth; many others underpin our cross-checks.
Market-Sizing & Forecasting
A hybrid top-down build starts from production, import, and export tonnage of temperature-sensitive goods, which is then priced using region-specific average logistics spend ratios. Results are corroborated through selective bottom-up checks, sampled warehouse pallet rates, reefer lane tariffs, and 3PL contract values to fine-tune totals. Key model drivers include urban e-grocery penetration, biologics clinical-trial pipeline size, refrigerated warehouse utilization, fuel price indexation, and refrigerant phase-out costs. Forecasts employ multivariate regression with ARIMA overlays to reflect both structural demand and cyclical fuel or commodity swings. Where bottom-up estimates show data voids, proxy ratios from matched corridors are applied and later validated with panel experts.
Data Validation & Update Cycle
Outputs pass variance screens against independent freight indices and customs tonnage, followed by senior analyst peer review. We refresh the model annually, triggering interim updates after material events such as refrigerant regulation changes or mega-mergers, and a final sense check occurs just before report release.
How Mordor Intelligence's Cold Chain Logistics Market Size Compares to Other Published Estimates
Published estimates often diverge because firms pick different service mixes, currency bases, and refresh cadences. Mordor's disciplined scope alignment, variable vetting, and dual-path modeling temper extremes, giving executives a balanced starting point.
Key gap drivers include whether refrigerated last-mile flows are counted, how aggressively future warehouse capacity is priced, and the cadence at which biologics demand shocks are folded into models.
Benchmark comparison
| Market Size | Anonymized source | Primary gap driver |
|---|---|---|
| USD 361.37 B (2025) | Mordor Intelligence | - |
| USD 316.34 B (2024) | Global Consultancy A | Excludes integrated 3PL value-added fees and applies >20 % CAGR without supply-side stress checks |
| USD 228.30 B (2024) | Industry Association B | Counts warehousing revenue only, omits chilled transport lanes |
| USD 324.85 B (2024) | Trade Journal C | Uses pallet-rate x warehouse stock method, ignores cross-border freight mark-ups |
These contrasts show that our model, anchored to observable tonnage and validated tariffs, delivers a transparent baseline stakeholders can trace, replicate, and confidently use for strategic planning.
Key Questions Answered in the Report
What is driving cold chain logistics demand through 2031?
Demand is supported by vaccine and biologics distribution, quick-commerce grocery delivery, protein trade, and higher traceability requirements.
How large is the Cold Chain Logistics Market in 2026?
The cold chain logistics market stands at USD 384.85 billion in 2026 and will reach USD 518.08 billion by 2031.
Which service type is growing fastest in cold chain logistics?
Value-added services are forecast to register at a 7.73% CAGR through 2031, led by needs such as blast freezing, labeling, and inventory management.
Which application has the highest growth rate through 2031?
Vaccines and clinical trial materials are forecast to register at an 8.94% CAGR through 2031.
Which region leads global cold chain logistics?
Asia-Pacific held 40.14% of global revenue in 2025 and is forecast to register at a 7.45% CAGR through 2031.
What are the main operational constraints for refrigerated logistics providers?
United States reefer driver shortages, European refrigerant retrofit costs, unreliable power in parts of Africa, and fragmented infrastructure in India constrain operations.