Market Overview
| Study Period | 2020 - 2031 |
|---|---|
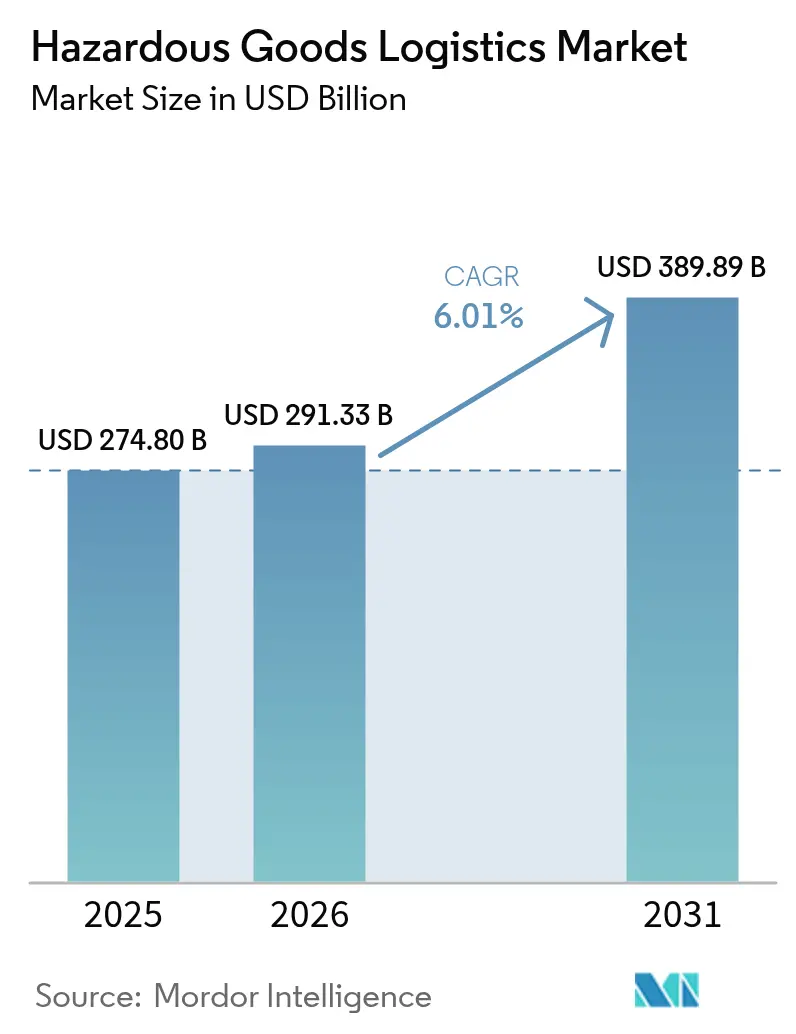
| Market Size (2026) | USD 291.33 Billion |
| Market Size (2031) | USD 389.89 Billion |
| Growth Rate (2026 - 2031) | 6.01% CAGR |
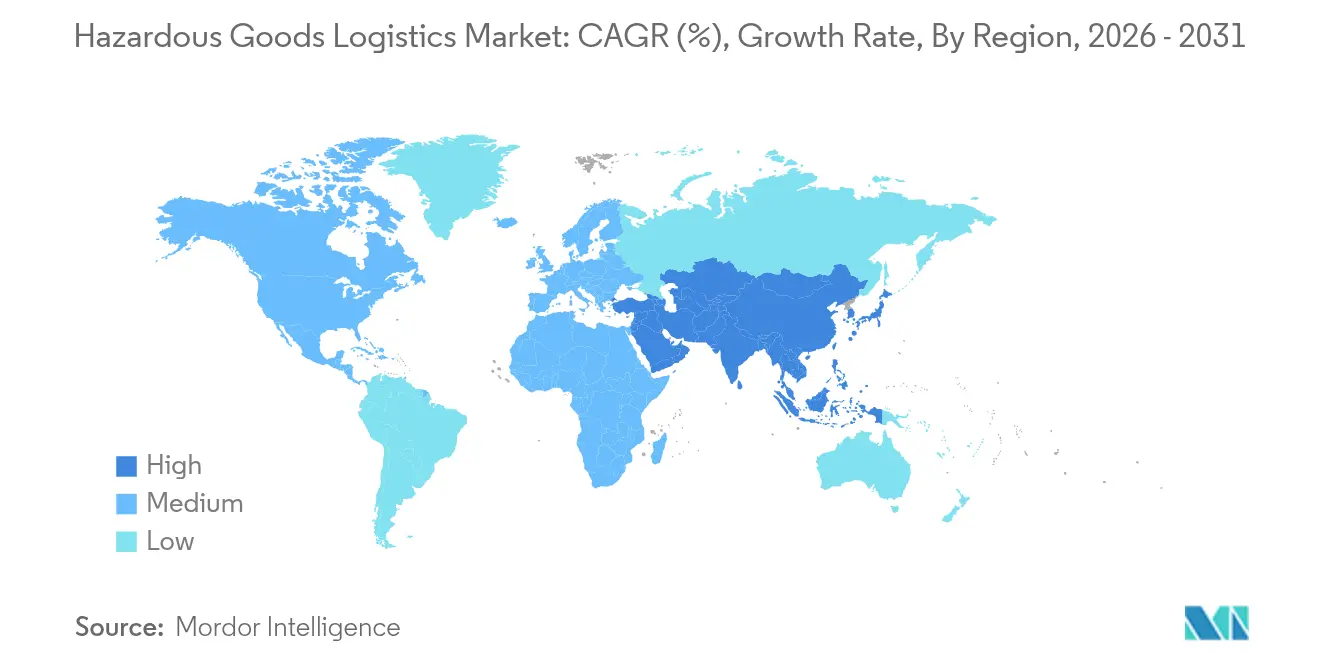
| Fastest Growing Market | Asia-Pacific |
| Largest Market | North America |
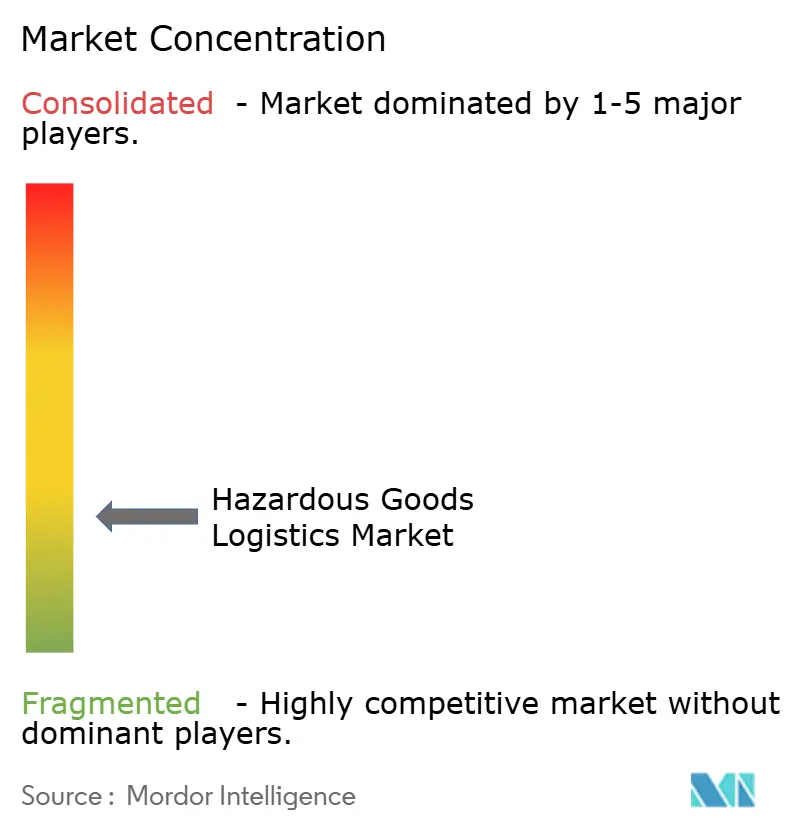
| Market Concentration | Low |
Major Players *Disclaimer: Major Players sorted in no particular order Image © Mordor Intelligence. Reuse requires attribution under CC BY 4.0. | |
Hazardous Goods Logistics Market Analysis by Mordor Intelligence
The Hazardous Goods Logistics market size is expected to grow from USD 274.80 billion in 2025 to USD 291.33 billion in 2026 and is forecast to reach USD 389.89 billion by 2031 at 6.01% CAGR over 2026-2031.
The upward trajectory is underpinned by expanding chemical and petrochemical trade flows, growing lithium-ion battery volumes, and the need for temperature-controlled biologics that demand specialized handling across road, rail, air, and maritime networks. Progressive digitalization—chiefly IoT sensors, blockchain-enabled chain-of-custody tools, and AI-driven routing—reinforces operational visibility while helping operators navigate tightening global safety mandates. Regulatory bodies in North America, the European Union, and Asia-Pacific are synchronizing standards around packaging, labeling, and real-time data sharing, which is prompting carriers to modernize fleets with Euro VI or zero-emission powertrains and fire-suppression technologies. Meanwhile, persistent pressure from rising insurance premiums and cross-border compliance costs is encouraging consolidation as large providers pursue economies of scale.
Key Report Takeaways
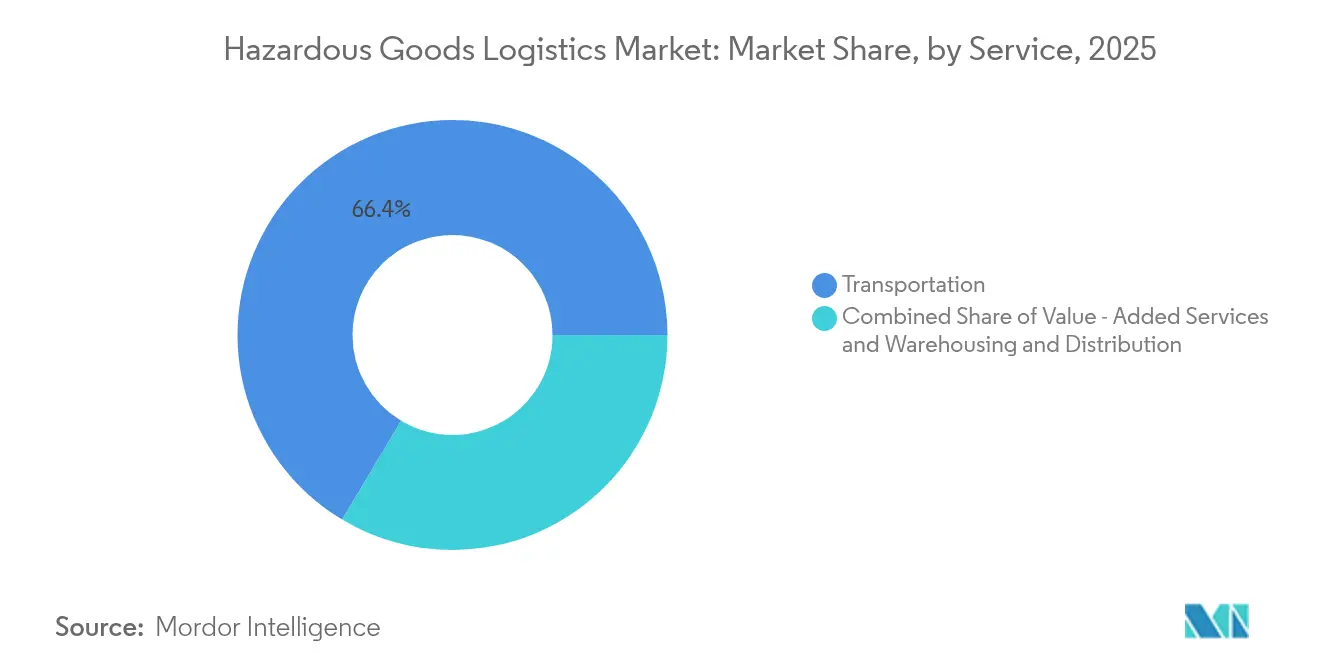
- By service, transportation held 66.42% revenue share of the Hazardous Goods Logistics market in 2025 while value-added services are forecast to grow at 7.56% CAGR through 2031.
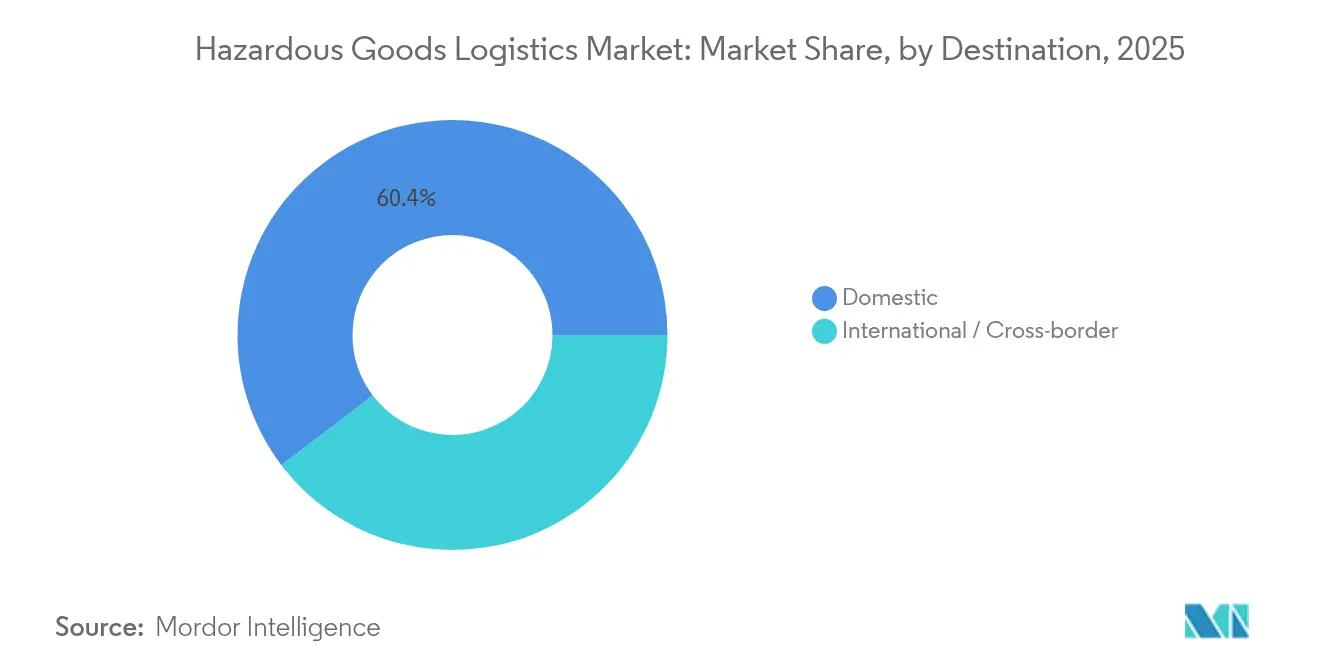
- By destination, domestic shipments captured 60.35% of the 2025 Hazardous Goods Logistics market share whereas intermodal and multimodal solutions are expected to post a 9.02% CAGR to 2031.
- By end-use industry, chemicals and petrochemicals commanded 35.42% share in 2025, but healthcare and pharmaceuticals are expanding at a 10.25% CAGR through 2031.
Note: Market size and forecast figures in this report are generated using Mordor Intelligence’s proprietary estimation framework, updated with the latest available data and insights as of 2026.
Global Hazardous Goods Logistics Market Trends and Insights
Drivers Impact Analysis*
| Driver | ( ~ ) % Impact on CAGR Forecast | Geographic Relevance | Impact Timeline |
|---|---|---|---|
| Expansion of global chemical & petro-product trade | +1.8% | Asia-Pacific and North America dominate | Long term (≥ 4 years) |
| Tightening multi-modal safety regulations & audits | +1.2% | EU and North America lead | Medium term (2-4 years) |
| Rapid growth of B2B e-commerce platforms for hazmat | +0.9% | North America and EU, accelerating in Asia-Pacific | Short term (≤ 2 years) |
| Blockchain-enabled chain-of-custody solutions | +0.7% | Early adoption in developed markets worldwide | Medium term (2-4 years) |
| Low-carbon rail-water corridors for hazmat | +0.6% | EU and North America, pilots in Asia-Pacific | Long term (≥ 4 years) |
| Reverse-logistics demand from on-site industrial recycling | +0.5% | Global, tied to circular-economy mandates | Long term (≥ 4 years) |
| Source: Mordor Intelligence | |||
Expansion of Global Chemical & Petro-Product Trade
Global manufacturers now move larger volumes of specialty chemicals, fertilizers, and refined products that require class-specific packaging, ventilation, and segregation. The United States alone handled 1.2 million daily hazmat consignments in 2024, equal to 12% of all freight ton-miles [1]Pipeline and Hazardous Materials Safety Administration, “Hazardous Materials Incident Data,” PHMSA, phmsa.dot.gov. Chemicals represented 36% of overall 2024 revenues inside the Hazardous Goods Logistics market, demonstrating the need for scale assets such as pressurized tank cars and ISO tank containers. Class 3 flammable liquids and Class 8 corrosives dominate rail traffic, and carriers cite a 99.99% incident-free delivery rate that helps maintain public and regulatory confidence[2]Union Pacific, “Rail Safety Performance Report 2024,” Union Pacific, up.com. Pipeline, terminal, and rail operators are accelerating load-sensor adoption that cuts loading cycles to 45 minutes, facilitating greater throughput without compromising safety. Capacity upgrades across Gulf Coast and Asia-Pacific ports continue, encouraging shippers to bundle hazardous liquid bulk with containerized dangerous goods inside value-added service contracts. These combined forces collectively expand addressable demand inside the Hazardous Goods Logistics market.
Tightening Multi-Modal Safety Regulations & Audits
Governments are elevating penalties for non-compliance, which compels logistics providers to invest in certified equipment and staff training. PHMSA raised civil fines above USD 100,000 per day in 2025, and railroads must now deliver electronic consist data to first responders under FAST Act mandates, a ten-year outlay estimated at USD 17.7 million. Cross-border harmonization with UN Model Regulations saves shippers USD 50–130 million annually in avoided paperwork while shrinking clearance times for Class 7 radioactive materials. Europe’s ADR 2023 added stricter provisions for tetramethylammonium hydroxide and recycled-plastic IBCs, forcing fleets to upgrade container linings and gaskets[3]United Nations Economic Commission for Europe, “ADR 2023 Updates,” UNECE, unece.org. Compliance is further supported by satellite tracking and ATEX-certified sensors rolled out by major producers, ensuring continuous temperature and pressure logging on 700 tank containers. As oversight deepens, companies that embed risk-management protocols gain a competitive edge across the Hazardous Goods Logistics market.
Rapid Growth of B2B E-Commerce Platforms for Hazmat
Digitization is transforming procurement as specialized portals allow laboratories, factories, and clinics to place direct compliant orders for dangerous goods. Integration of DGIS workflows into enterprise resource-planning stacks accelerates shipping document validation and automates label generation, shaving days off traditional approval cycles. Blockchain smart contracts increasingly verify SDS content, reducing declaration errors while creating tamper-proof audit trails demanded by regulators. PHMSA’s move to electronic-only registrations aligns with paperless customs pilots in Canada, Mexico, and the EU, supporting swift cross-border clearances. Predictive analytics in pharmaceutical cold chains now anticipate temperature excursions and propose reroutes, combatting annual spoilage losses that once exceeded USD 35 billion. Nevertheless, cybersecurity gaps in e-DG systems remain, driving carriers to harden networks with multi-factor authentication and end-to-end encryption. These developments collectively stimulate incremental revenues inside the Hazardous Goods Logistics market.
Blockchain-Enabled Chain-of-Custody Solutions Gain Traction
Distributed ledgers provide immutable time-stamped records that strengthen chain-of-custody verifications. Operators can grant regulators view-only permissions, enabling real-time oversight without exposing proprietary commercial data. In emergency scenarios, blockchain nodes fuse sensor data with accident-response algorithms that instantly model vapor-cloud dispersions and advise responders. SAVVY Telematic Systems offers ATEX and IECEx devices that stream continuous GPS, shock, and temperature data directly into decentralized storage, satisfying audit requirements for Class 2.3 toxic-gas moves. Early adopters report throughput gains because cargo releases no longer await manual document checks, illustrating how blockchain drives measurable efficiencies within the Hazardous Goods Logistics market. As more ports and rail yards deploy permissioned networks, stakeholders expect lower administrative costs and quicker demurrage resolution.
Restraints Impact Analysis*
| Restraint | (~) % Impact on CAGR Forecast | Geographic Relevance | Impact Timeline |
|---|---|---|---|
| Compliance complexity across jurisdictions | -1.4% | Global, most acute on cross-border lanes | Medium term (2-4 years) |
| Escalating insurance & liability premiums | -0.8% | Global, highest impact in North America and EU | Short term (≤ 2 years) |
| Shortage of Euro VI and zero-emission hazmat-qualified vehicles | -0.6% | EU and North America, with emerging gaps in Asia-Pacific markets | Medium term (2-4 years) |
| Cybersecurity vulnerabilities in e-Dangerous Goods Declaration systems | -0.5% | Global, driven by accelerated digitalization of hazmat workflows | Short term (≤ 2 years) |
| Source: Mordor Intelligence | |||
Compliance Complexity Across Jurisdictions
A patchwork of national regulations compels carriers to master multiple documentation regimes, training schedules, and packaging codes. The United States aligns with UN standards yet retains country-specific tank car specifications that add retrofit costs for foreign fleets. China’s GB 6944-2012 classification diverges from ADR, necessitating packaging conversions when shipments transit from Shenzhen to Rotterdam. Europe’s pending PFAS restrictions could interrupt semiconductor and PCB supply chains as firms scramble for substitute chemistries. Varying driver-hazmat endorsement hours, document language rules, and emergency-contact protocols lead to detention fees and higher buffer inventories. Logistics providers therefore maintain parallel compliance teams, which inflates overhead and slows onboarding of new trade lanes inside the Hazardous Goods Logistics market.
Escalating Insurance & Liability Premiums
Specialized coverage for Class 7 radioactive sources or Class 9 lithium batteries has surged as underwriters reassess catastrophic risk. Insurers now demand telematics-verified driver scores, installation of thermal runaway detectors, and proof of double-wall containment on select tankers before quoting policies. Smaller carriers frequently confront minimum annual premiums above USD 500,000, limiting market entry and constraining competition. PHMSA’s proposal to raise registration fees compounds the burden, especially for firms that operate mixed commodity fleets. Although rail accident rates fell 91% since 1980, a single tank-car rupture can yield claims exceeding USD 100 million, justifying underwriter caution. High deductible layers push logistics operators to adopt rigorous training and monitoring protocols, further raising cost structures across the Hazardous Goods Logistics market.
*Our forecasts treat driver/restraint impacts as directional, not additive. The impact forecasts reflect baseline growth, mix effects, and variable interactions.
Segment Analysis
By Service: Value-Added Solutions Drive Market Evolution
Transportation remains the backbone, responsible for 66.42% of 2025 revenues inside the Hazardous Goods Logistics market. Operators run dedicated road tankers, stainless ISO tanks, pressure-rated railcars, and specialized cargo aircraft that together guarantee arrival of Class 1 explosives, Class 2 gases, and Class 3 flammables with near-perfect safety statistics. While transport volume growth is steady, shippers increasingly request integrated services that extend beyond point-to-point haulage. This shift explains why the value-added segment posts a 7.56% CAGR to 2031, reflecting demand for on-site labeling, kit assembly, customs brokerage, and regulatory consulting. Healthcare firms, for example, require end-to-end cold chain pathways, complete with data-logger archiving that satisfies GDP inspections. Chemical producers similarly outsource SDS updates and multi-language hazard documentation, allowing them to focus on core production tasks. IoT sensor packages, blockchain timestamping, and AI risk-scoring engines are embedded into premium contracts, conferring enhanced visibility and proactive exception management. Investment in specialized warehouses equipped with segregated bays, explosion-proof HVAC, and inert-gas fire suppression supports longer dwell times for reactive cargoes. Together, these capabilities broaden customer stickiness and underpin sustained revenue momentum inside the Hazardous Goods Logistics market.
Warehouse and distribution services complement transportation by providing compliant storage for incompatible classes under one roof. Facilities now feature robotic pallet movers fitted with LIDAR to avoid spark generation, while real-time gas detectors trigger automated ventilation when vapor thresholds near OSHA limits. Regional distribution models shorten final-mile distances, which is essential for biologics requiring narrow temperature tolerances. Carriers tap predictive analytics to place inventory closer to demand clusters, thus lowering spoilage risks and shrinking lead times. Railroads promote bulk transload hubs that connect tank-car arrivals to intermediate bulk container refills, eliminating redundant long-haul road legs. As clients pursue scope 3 carbon-reduction targets, logistics providers roll out lifecycle assessment dashboards that quantify embedded emissions from cradle-to-gate. Those metrics feed sustainability reports and influence vendor selection criteria. All these trends collectively sustain growth in value-added offerings, ensuring the Hazardous Goods Logistics market continues to evolve from transactional hauling toward high-margin, data-rich solutions.


By Destination: Domestic Dominance with Cross-Border Complexity
Domestic flows represented 60.35% of revenue in 2025, evidencing the sizeable volumes of refinery feedstocks, agricultural chemicals, and industrial gases that circulate within national boundaries. Many domestic journeys leverage established rail corridors and dedicated pipeline networks, enabling cost-efficient distribution and quick response to local demand spikes. Uniform training curricula and consistent signage standards simplify compliance, lowering hand-off friction among carriers, storage sites, and emergency services. Incident response teams maintain pre-mapped routes, enhancing preparedness and minimizing service disruptions. Moreover, domestic regulatory agencies often provide real-time advisories on weather, track conditions, and road-closure alerts that help dispatchers adjust in transit. As shippers chase faster cycle times, same-day clearance programs have emerged that allow pre-vetted consignments to bypass routine inspections, a boon for critical medical isotopes.
Cross-border consignments, though smaller in share, endure more documentation layers and physical checks. Goods traveling from US Gulf Coast refineries into Canadian petrochemical clusters must reconcile PHMSA and Transport Canada rules on placarding and emergency-response guides. Similarly, European road-rail intermodal moves pass through multiple ADR signatory nations, each imposing nuanced route restrictions around tunnels and densely populated zones. Geopolitical frictions, such as vessel diversions away from conflict-prone waterways, add sailing days and increase bunker consumption. Customs authorities now pilot blockchain corridors that interface with port community systems, enabling regulators to query tamper-proof certificates in seconds rather than hours. Despite these innovations, carriers still allocate buffer transit times to account for potential secondary inspections, currency fluctuations, and driver visa delays. The result is higher working-capital requirements and complex scheduling, yet premium cross-border lanes also command higher yields, sustaining profitability inside the Hazardous Goods Logistics market.
By End-Use Industry: Healthcare Drives Growth Amid Chemical Dominance
Chemicals and petrochemicals led with 35.42% contribution to 2025 revenue, underscoring the foundational role of acids, solvents, and flammable liquids in global manufacturing. Refineries, polymer plants, and fertilizer producers rely on specialized tank cars with corrosion-resistant linings and double-shelf couplers that minimize derailment risk. Dedicated maritime terminals maintain nitrogen-blanketed storage spheres that curb vapor emissions. Producers award multi-year contracts that bundle transport, storage, and safety-training programs, guaranteeing predictable throughput for carriers. Pipeline operators maintain remote leak-detection sensors and shutdown valves spaced every 10 kilometers, delivering a 99.999% incident-free rate for toxic inhalation hazard substances. Chemical customers also seek reverse-logistics solutions for off-spec material reprocessing, adding backhaul opportunities for logistics firms.
Healthcare and pharmaceuticals, although smaller today, exhibit a 10.25% CAGR through 2031, reflecting the surge in biologics, mRNA vaccines, and temperature-sensitive cell-and-gene therapies. These products mandate lane qualification, GDP-certified packaging, and active temperature control from loading dock to patient bedside. Lithium-ion battery-powered infusion pumps fall under Class 9 regulations, so carriers must ensure UN 3480 compliance and install fire-containment covers on aircraft pallets. Leading operators deploy dedicated Control Towers that monitor life-science shipments in real time, issuing alerts when sensors detect a 2 °C drift. Regulatory shifts, such as the US Drug Supply Chain Security Act, compel full item-level serialization and traceability, tasks well suited to blockchain and AI-enabled image recognition. Investments nearing EUR 2 billion in new GDP hubs by 2030 highlight the strategic focus on healthcare, reinforcing its outsized influence on future revenues inside the Hazardous Goods Logistics market.
Geography Analysis
North America constitutes the largest share of the Hazardous Goods Logistics market, benefiting from 3.3 million miles of regulated pipelines, an integrated rail network, and sophisticated emergency-response infrastructure. Major railroads such as BNSF and Union Pacific continue to record 99.999% incident-free hazmat deliveries, underlining a culture of safety investment and proactive maintenance. The US-Canada corridor leverages harmonized placard codes and shared data portals that expedite customs clearance, while the US-Mexico lane earns priority upgrades under trilateral trade facilitation programs. Carriers allocate automation budgets to wayside defect detectors, predictive maintenance AI, and FRA-approved brake-health analytics that collectively reduce downtime. Legislators channel grants toward zero-emission drayage trucks at ports, helping shippers shrink carbon footprints without sacrificing compliant power for hazardous cargo.
Europe follows as the second-largest region, shaped by stringent ADR provisions and a policy push toward low-carbon multimodal corridors. Rail freight operators capitalize on Single European Railway Area initiatives that enable cross-border locomotive shifts without extensive administrative stops. Ports such as Rotterdam and Antwerp offer dedicated Class-7 isotope bunkers, while inland waterways handle Class 3 liquids on double-hulled barges fitted with vapor-recovery units. The European Green Deal incentivizes modal shifts from road to rail and inland waterway, and carriers respond by investing in 45-foot swap bodies compatible with both platforms. DSV’s EUR 14.3 billion (USD 15.78 billion) acquisition of Schenker bolsters network density across 90 countries, ensuring broad service coverage for multinational shippers. Operators also trial hydrogen-powered line-haul trucks to comply with Euro VII proposals, demonstrating Europe’s role as a technology incubator within the Hazardous Goods Logistics market.
Asia-Pacific delivers the fastest growth pace, propelled by industrial expansion in China, Southeast Asia, and India. China continues modernizing its regulatory regime, rolling out compulsory telematics on Class 2 cylinder trucks and constructing segregated service areas along hazardous routes. India invests in dedicated freight corridors that accommodate hazmat trains with reduced dwell times and electrified traction. Japanese ports host automated guided vehicles equipped with explosion-proof batteries, shortening vessel turnaround. Manufacturers diversify supply bases, redirecting some electronics and battery production toward Vietnam and Thailand, which in turn accelerates regional demand for compliant logistics. Australia and South Korea upgrade chemical parks with on-premise firefighting brigades and digital twin simulations that enhance preparedness. Collectively, these initiatives strengthen the competitive positioning of Asia-Pacific participants, expanding overall revenue contributions to the Hazardous Goods Logistics market.
Note: Segments share of all individual segments available upon report purchase

Competitive Landscape
The competitive environment remains moderately fragmented, yet ongoing consolidation steadily lifts market concentration. DSV’s Schenker acquisition pushes combined annual revenue to DKK 310 billion (USD 45.89 billion) and enlarges the workforce to 160,000 employees across 90 countries, enhancing end-to-end hazardous capability through integrated contract logistics, customs brokerage, and multimodal transport. DHL allocates EUR 2 billion (USD 2.20 billion) for health-logistics infrastructure, increasing GDP-certified capacity in key biopharma clusters. CEVA secures CEIV Li-Ba certification, elevating its credibility in lithium battery airfreight, and augments Turkish reach via Borusan Tedarik’s 570,000 square-meter storage footprint. UPS deepens cold-chain expertise with the USD 1.6 billion purchase of Andlauer Healthcare, positioning its supply-chain solutions unit to compete aggressively in high-margin life-science segments.
Technology differentiation proves decisive. Leading operators embed IoT devices that monitor pressure, vibration, and temperature at ten-second intervals, feeding AI engines that predict excursion risk two hours in advance. Blockchain pilots span ocean carriers and inland haulers, yielding immutable hand-off records and accelerating invoice reconciliation. Autonomous yard tractors equipped with LIDAR and redundant braking systems perform shunting tasks within Class 1 explosives depots, reducing human exposure. Smaller regional specialists pursue niche depth; Kenan Advantage Group builds scale in caustic soda haulage through targeted asset purchases, while SAVVY Telematic Systems licenses ATEX-certified trackers to multi-modal fleets. White-space growth vectors encompass battery-recycling reverse logistics, hydrogen fuel infrastructure servicing, and overseas expansion into Middle East chemicals hubs. Participants that orchestrate end-to-end compliance, real-time visibility, and data-driven optimization stand to outpace peers as the Hazardous Goods Logistics market continues maturing.
Hazardous Goods Logistics Industry Leaders
DHL
DSV
Ceva Logistics
DGD Transport
Bolloré Logistics
- *Disclaimer: Major Players sorted in no particular order

Recent Industry Developments
- April 2025: DSV completed its EUR 14.3 billion (USD 15.78 billion) acquisition of DB Schenker, creating one of the world’s largest logistics firms with 160,000 employees across 90 countries.
- April 2025: CEVA Logistics signed a USD 440 million agreement to acquire Borusan Tedarik, adding 570,000 square meters of warehousing in Turkey.
- March 2025: Kenan Advantage Group bought M.C. Tank Transport, adding 100 tractors and 500 chemical trailers to its fleet.
- March 2025: Mitsui O.S.K. Lines acquired LBC Tank Terminals for USD 1.715 billion, gaining 3 million m³ of chemical storage across seven terminals.


Research Methodology Framework and Report Scope
Market Definitions and Key Coverage
Our study defines the global hazardous goods logistics market as revenue earned by specialist third-party providers that store, handle, and move substances legally classed as dangerous (corrosive, flammable, explosive, toxic, oxidizing, radioactive, or bio-hazardous) across road, rail, air, sea, and intermodal chains. According to Mordor Intelligence, the scope spans transportation, dedicated hazmat warehousing, and safety-linked value-added services delivered between shipper gate and consignee dock.
We leave captive manufacturer fleets and one-off emergency spill response jobs outside the scope.
Segmentation Overview
- By Service (Value)
- Transportation
- Road
- Rail
- Air
- Sea and Inland Waterways
- Warehousing & Distribution
- Value-added Services (Labelling, Kitting, Consulting)
- Transportation
- By Destination (Value)
- Domestic
- International / Cross-border
- By End-use Industry (Value)
- Oil & Gas
- Chemicals & Petrochemicals
- Healthcare & Pharma
- Agriculture & Fertilizers
- Mining & Metals
- Energy & Utilities
- Manufacturing (Electronics, Automotive, etc.)
- Waste Management & Recycling
- Others
- Geography (Value)
- North America
- United States
- Canada
- Mexico
- South America
- Brazil
- Peru
- Chile
- Argentina
- Rest of South America
- Asia Pacific
- India
- China
- Japan
- Australia
- South Korea
- South East Asia (Singapore, Malaysia, Thailand, Indonesia, Vietnam, and Philippines)
- Rest of Asia-Pacific
- Europe
- United Kingdom
- Germany
- France
- Spain
- Italy
- BENELUX (Belgium, Netherlands, and Luxembourg)
- NORDICS (Denmark, Finland, Iceland, Norway, and Sweden)
- Rest of Europe
- Middle East And Africa
- United Arab of Emirates
- Saudi Arabia
- South Africa
- Nigeria
- Rest of Middle East And Africa
- North America
Detailed Research Methodology and Data Validation
Primary Research
Mordor analysts interviewed safety auditors, 3PL operations heads, hazmat insurers, and chemical-plant buyers across North America, Europe, Asia-Pacific, and the Gulf. Their insights on surcharge patterns, container cycles, and compliance costs bridged data gaps and refined every assumption.
Desk Research
Analysts began with the UN Model Regulations, ADR, and the IMDG Code, then matched them with UN Comtrade flow tables, Eurostat dangerous-goods tonne-kilometer data, PHMSA incident files, and OSHA violation logs. Company 10-Ks and respected business press clarified tariff swings and lane pricing.
Our team also cross-checked operator revenues through D&B Hoovers and monitored real-time updates on Dow Jones Factiva. These references illustrate, not exhaust, the wider pool tapped for numbers, context, and validation.
Market-Sizing & Forecasting
A top-down demand pool was rebuilt from national hazardous freight-ton volumes, cross-border shares, and blended tariff-inclusive rates, then checked through selective bottom-up supplier roll-ups and sampled price-times-volume tests.
Drivers such as global chemical output, rig count, pharma cold-chain lane growth, regulatory fee escalators, and modal capacity feed a multivariate regression that projects value through 2030.
Data Validation & Update Cycle
Outputs pass three-step variance screens against accident statistics and customs receipts; any anomaly triggers follow-up calls before sign-off.
Reports refresh each year, with interim updates when regulation or macro shocks move a key driver.
Why Our Hazardous Goods Logistics Baseline Commands Reliability
Published figures differ because firms adopt unlike service mixes, markup paths, currency locks, and refresh cadences.
Key gap drivers include whether warehousing is counted, how intermodal surcharges are treated, and if captive fleets sit inside the scope.
Benchmark comparison
| Market Size | Anonymized source | Primary gap driver |
|---|---|---|
| USD 274.80 B (2025) | Mordor Intelligence | - |
| USD 251.13 B (2025) | Global Consultancy A | Warehousing omitted, deeper short-haul discount |
| USD 274.20 B (2024) | International Publisher B | 2022 FX frozen, single 5.9 % rollover growth |
| USD 225.89 B (2024) | Industry Journal C | Safety add-ons excluded, invoice floor USD 500 k |
These contrasts show that, once scope and conversion choices align, Mordor's disciplined, annually refreshed model gives decision-makers a balanced, transparent baseline they can trust.


Key Questions Answered in the Report
What is the current size of the Hazardous Goods Logistics market in 2026?
The Hazardous Goods Logistics market size stood at USD 291.33 billion in 2026 and is projected to reach USD 389.89 billion by 2031.
Which service segment leads the Hazardous Goods Logistics market in 2025?
Transportation services account for 66.42% of 2025 revenue, reflecting the essential role of multi-modal hauling assets.
Which end-use industry is growing fastest within hazardous goods logistics through 2031?
Healthcare and pharmaceuticals show the highest pace, advancing at a 10.25% CAGR through 2031 thanks to biologics and battery-powered devices.
What are the main drivers of future market growth over 2026-2031?
Expanding global chemical trade, stricter safety regulations, digitized B2B commerce, and blockchain-based traceability collectively add momentum.
How are rising insurance premiums affecting logistics providers in 2026?
Higher liability cover costs raise operating expenses and encourage greater investment in telematics, training, and consolidated scale to preserve margins.
Which regions present the strongest growth opportunities through 2031?
Asia-Pacific leads growth due to industrial expansion in China, India, and Southeast Asia, supported by regulatory modernization and infrastructure upgrades.
Page last updated on:


