People Counting System Market Size and Share
Market Overview
| Study Period | 2021 - 2031 |
|---|---|
| Market Size (2026) | USD 1.64 Billion |
| Market Size (2031) | USD 2.99 Billion |
| Growth Rate (2026 - 2031) | 12.78% CAGR |
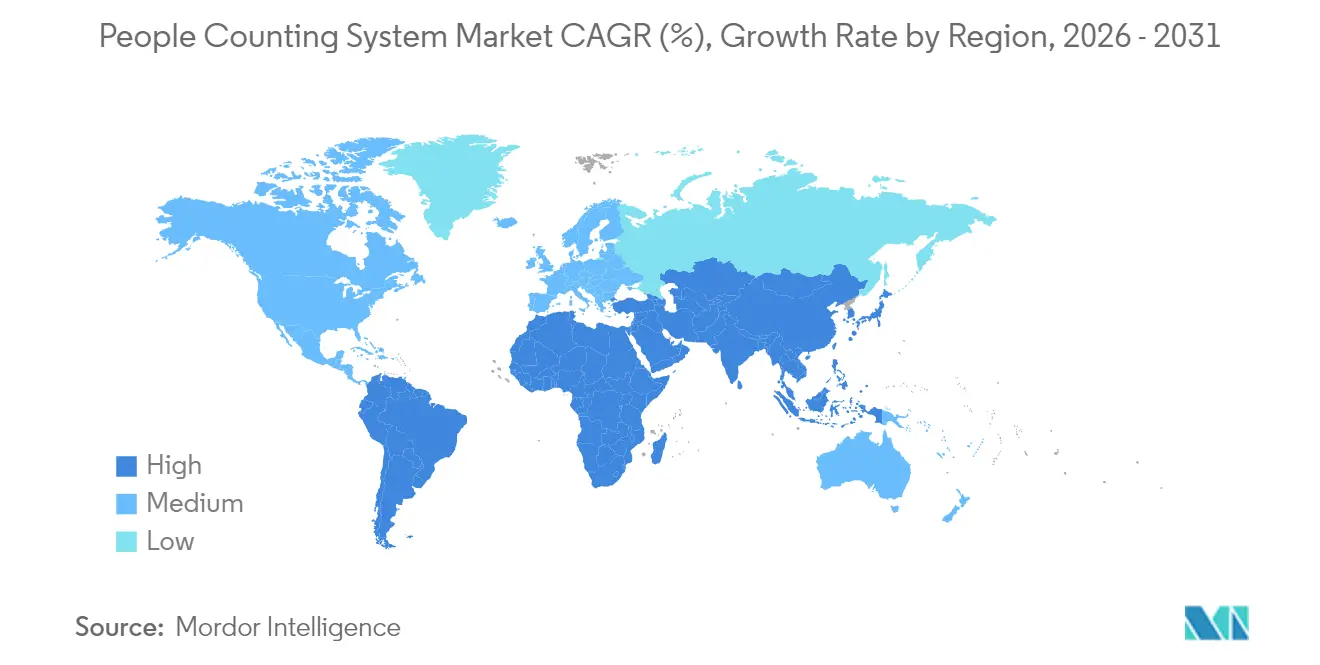
| Fastest Growing Market | Middle East and Africa |
| Largest Market | Asia Pacific |
| Market Concentration | High |
Major Players *Disclaimer: Major Players sorted in no particular order Image © Mordor Intelligence. Reuse requires attribution under CC BY 4.0. | |
People Counting System Market Analysis by Mordor Intelligence
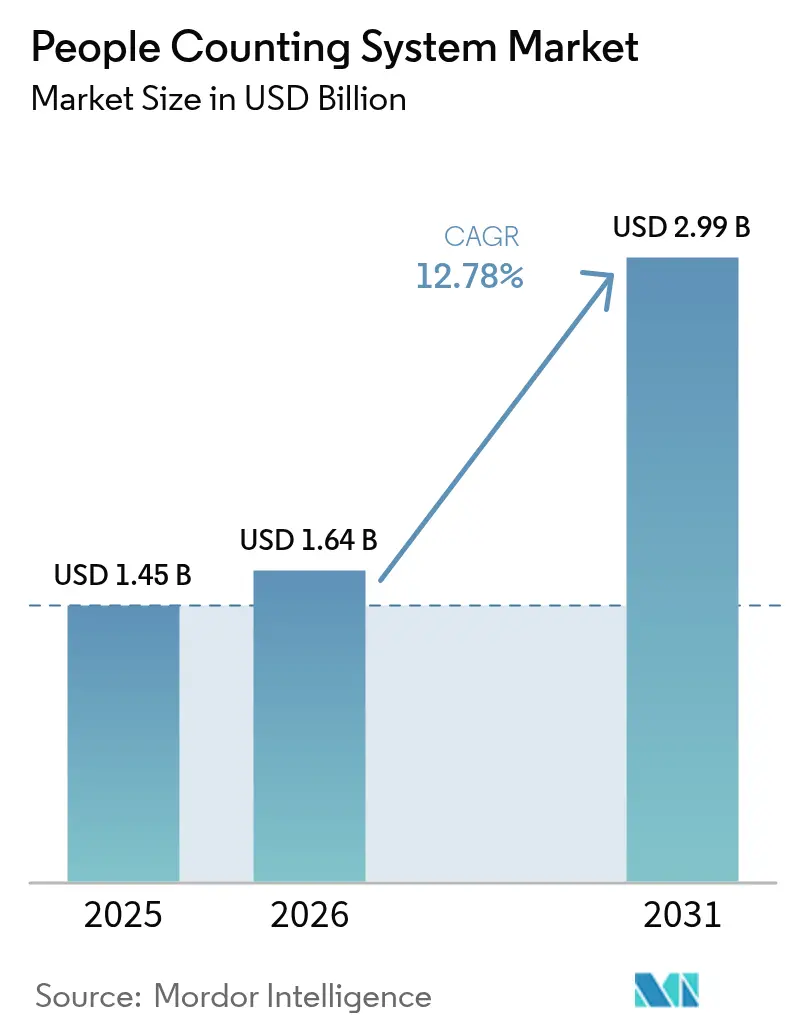
The People Counting System Market size is projected to expand from USD 1.45 billion in 2025 and USD 1.64 billion in 2026 to USD 2.99 billion by 2031, registering a CAGR of 12.78% between 2026 to 2031.
Steady demand comes from smart-city spending, post-pandemic occupancy requirements, and the continuing shift toward AI-enabled sensor fusion that raises accuracy while lowering operating costs.[1]Milesight, “milesight-vs133-ai-tof-people-counting-sensor-whitepaper,” tyrrellproducts.com Adoption accelerates as Time-of-Flight (ToF) sensors deliver 99.8% accuracy and integrate privacy-by-design features that help owners meet GDPR and CCPA mandates. Energy-saving tie-ins with HVAC systems underline a move from point analytics to portfolio-wide optimization, with documented commercial-building pilots posting 12.5% energy reductions. Smart-transport projects across Asia Pacific, metro expansion in the Middle East, and mall traffic rebounds in the United States sustain multi-vertical momentum. At the same time, semiconductor supply disruption and heightened compliance costs create price tension that smaller retailers must navigate.
Key Report Takeaways
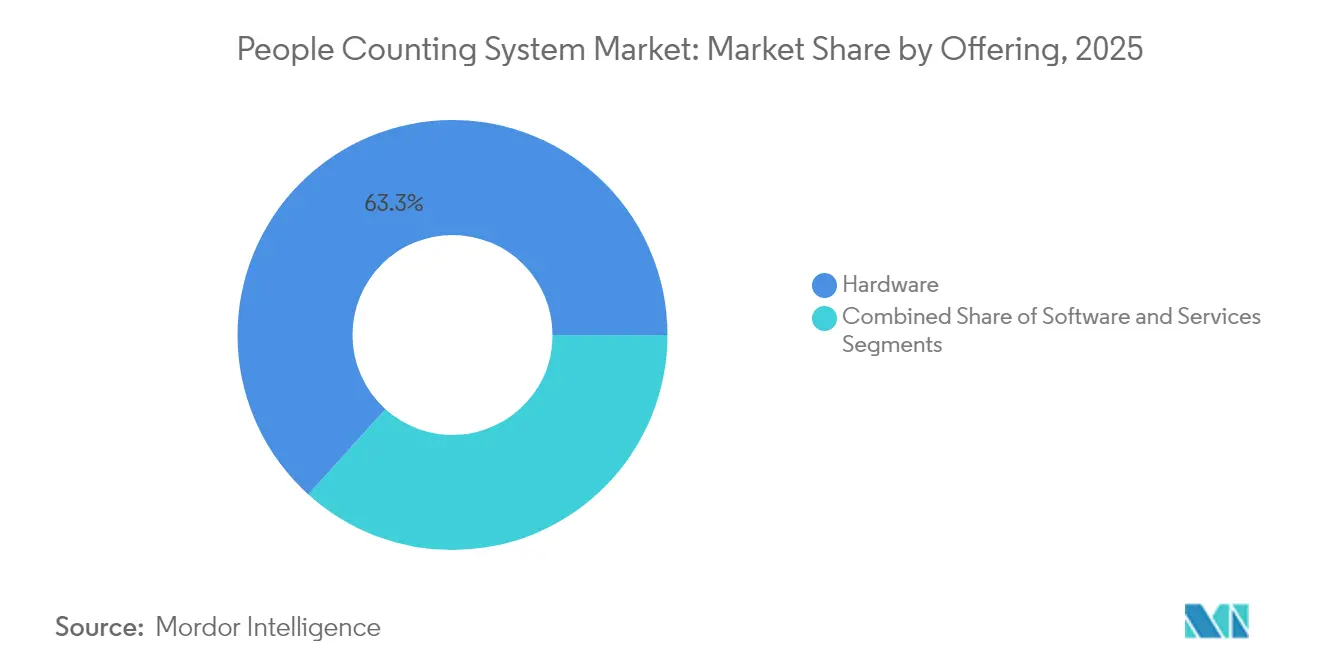
- By offering, hardware led with 63.30% revenue share in 2025, while services are forecast to expand at a 13.45% CAGR through 2031.
- By sensor technology, infrared beam sensors accounted for 36.10% of People Counting System market share in 2025; Time-of-Flight sensors are set to advance at a 14.05% CAGR to 2031.
- By deployment mode, on-premise solutions held 70.60% of People Counting System market size in 2025, whereas cloud deployment records the highest projected CAGR at 14.2% through 2031.
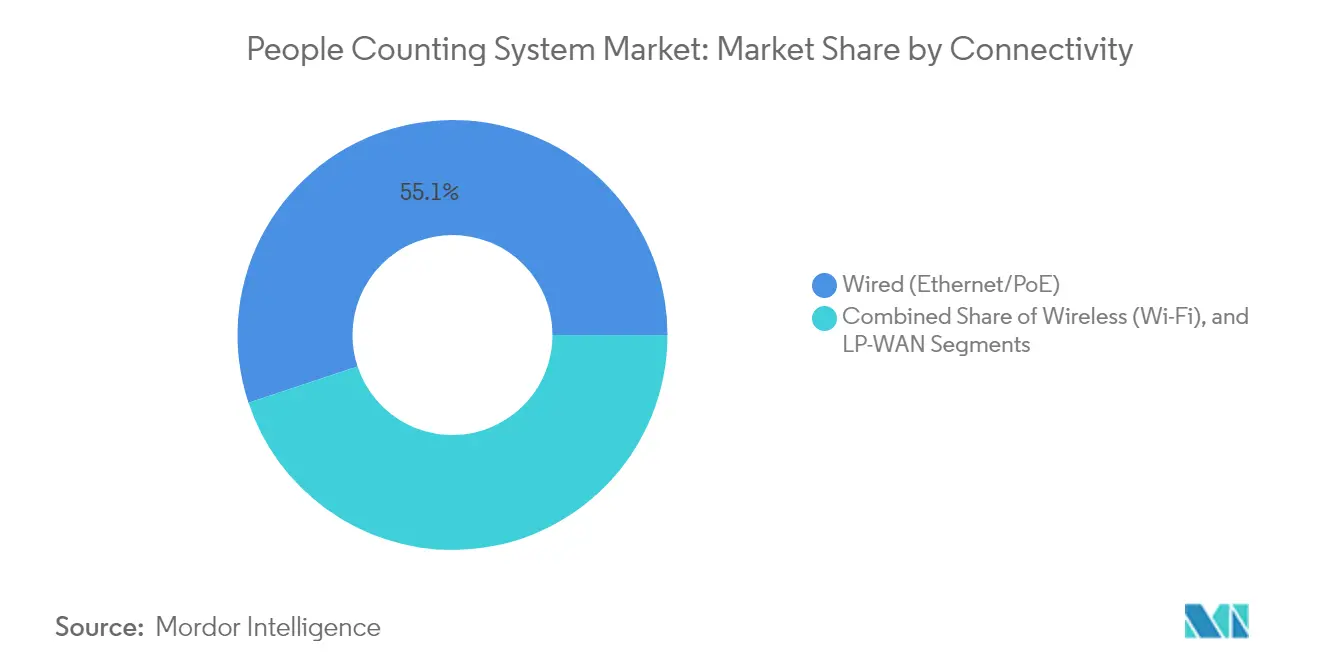
- By connectivity, wired Ethernet/PoE installations captured 55.10% share in 2025; LP-WAN links are projected to rise at a 13.5% CAGR over the forecast period.
- By end-user vertical, retail stores led with 28.40% revenue share in 2025, while transportation hubs represent the fastest-growing segment at 14.35% CAGR.
- By geography, Asia Pacific commanded 31.10% of People Counting System market size in 2025; the Middle East is poised for a 13.85% CAGR to 2031.
Note: Market size and forecast figures in this report are generated using Mordor Intelligence’s proprietary estimation framework, updated with the latest available data and insights as of 2026.
Global People Counting System Market Trends and Insights
Drivers Impact Analysis*
| Driver | (~) % Impact on CAGR Forecast | Geographic Relevance | Impact Timeline |
|---|---|---|---|
| Smart-Retail Demand for Real-Time Footfall Analytics in North America and Europe | +2.1% | North America & Europe | Medium term (2-4 years) |
| Post-COVID Occupancy Compliance Mandates Fueling Installations (EU, US) | +1.8% | EU & US | Short term (≤ 2 years) |
| Smart-City Transportation Hubs Deploying Crowd-Flow Sensors Across Asia | +2.3% | Asia Pacific | Long term (≥ 4 years) |
| AI-Enabled Video Analytics Cutting TCO and Boosting Accuracy | +2.0% | Global | Medium term (2-4 years) |
| HVAC Energy-Optimization via Occupancy Integration in Commercial Buildings | +1.6% | Global | Long term (≥ 4 years) |
| Venture-Capital Surge into MENA Footfall-as-a-Service Platforms | +1.4% | Middle East & North Africa | Short term (≤ 2 years) |
| Source: Mordor Intelligence | |||
Smart-retail demand for real-time footfall analytics in North America and Europe
Retailers rely on anonymized footfall data to raise conversion and calibrate staffing; evidence from U.S. malls shows 5-15% revenue uplift after analytics rollouts.[2]Mapzot, “US Shopping Malls Make a Comeback Foot Traffic Soars in 2025,” mapzot.ai Link Retail’s LinkVision camera software leverages existing CCTV to surpass 95% accuracy, lowering retrofit costs for European chains. Telstra’s 2024 deployment across Australian stores underscores global reach, pairing >95% accuracy with on-device processing that addresses privacy risk. By enriching traffic counts with demographic metadata, retailers adjust layouts and execute targeted promotions without data-sharing exposure. These traction points reinforce the People Counting System market as a core pillar of omnichannel strategy.
Post-COVID occupancy compliance mandates fueling installations (EU, US)
Revised building codes now require live head-counting to support emergency egress and indoor-air-quality monitoring, spurring adoption in health facilities and public offices.[3]Buildings, “The Hospital of the Future,” buildings.com The GSA Oklahoma City Federal Building linked occupancy sensors to its BMS and cut energy use 41%, proving ROI to government buyers. GDPR-aligned designs from FootfallCam anonymize data at chip level, preventing storage of personal imagery while sustaining counting fidelity. Homeland Security’s 2024 survey that endorsed 15 crowd-analysis tools confirms the technology’s relevance to public-safety readiness. Heightened compliance requirements therefore work as both catalyst and filter, rewarding vendors with defensible privacy credentials.
Smart-city transportation hubs deploying crowd-flow sensors across Asia
Metro operators in Singapore, Hong Kong, and Japan integrate ToF, LiDAR, and ticketing data to modulate passenger loads and shorten dwell times.[4]Thales and SBS Transit, “Collaboration to Deliver Better Travel Experience,” sbstransit.com.sg NEXCOM’s intelligent railway infrastructure suite fuses edge AI with LiDAR to improve safety and throughput in Hong Kong. JR East’s analytics platform draws from ~600 stations to guide retail node placement and timetable planning. Airport rollouts such as bCounted continue to deliver real-time density maps for gate management. The strong alignment between mobility modernization and counting accuracy supports the long-run expansion of the People Counting System market.
AI-enabled video analytics cutting TCO and boosting accuracy
Second-generation ToF sensors reach 99.8% accuracy while replacing server-heavy architectures with edge inference. University of Virginia research on transformer networks improves human-action recognition, enabling behavior tagging alongside raw counts. Milesight’s VS133 ToF unit discriminates between group types and filters trolleys, keeping GDPR compliance intact without external video. These innovations lower lifetime cost and open mid-market revenue pools that were previously price-locked, elevating the People Counting System market as a horizontal analytics platform.
Restraints Impact Analysis*
| Restraint | (~) % Impact on CAGR Forecast | Geographic Relevance | Impact Timeline |
|---|---|---|---|
| GDPR/CCPA privacy compliance hindering camera-based adoption | -1.2% | EU & California | Medium term (2-4 years) |
| Accuracy gaps in open-area counting reducing buyer confidence | -0.8% | Global | Short term (≤ 2 years) |
| Legacy BMS integration complexity in emerging markets | -0.9% | Emerging Markets | Long term (≥ 4 years) |
| Price sensitivity of SMB retailers in South America | -0.6% | South America | Medium term (2-4 years) |
| Source: Mordor Intelligence | |||
GDPR/CCPA privacy compliance hindering camera-based adoption in EU and CA
Stringent consent rules compel vendors to embed anonymization and local processing, raising bill-of-materials and legal consultancy costs. Aura Vision’s on-device analytics avoid image storage, satisfying regulators yet still capturing directional counts. ToF sensors emerge as a substitute, providing >95% accuracy without identifiable frames, easing certification hurdles. Vendors that can verify end-to-end compliance are increasingly favored in public tenders, which shapes competitive dynamics within the People Counting System market.
Accuracy gaps in open-area counting reducing buyer confidence (stadiums)
Wide-entrance venues challenge legacy solutions; VizioSense finds that 2D cameras top out near 95% accuracy, while LiDAR improves precision but demands EUR 50,000 (USD 52,800) per sensor. Beonic’s LiDAR upgrade counters low-light error yet comes at a premium. Research into sensor-fusion models shows up to 98% accuracy with speed classification error below 9%, indicating progress but not parity with enclosed-doorway results. Until costs moderate, some venue owners defer procurement.
*Our forecasts treat driver/restraint impacts as directional, not additive. The impact forecasts reflect baseline growth, mix effects, and variable interactions.
Segment Analysis
By Offering: Integration services outpace hardware growth
Hardware continues to dominate People Counting System market revenue, holding 63.30% share in 2025. Capital outlays concentrate on ToF and LiDAR sensors installed across retail thresholds, airport terminals, and public facilities. Managed services, however, are climbing at a 13.45% CAGR as operators seek outsourced analytics, compliance auditing, and continuous calibration. The migration from one-off installs to subscription models transforms revenue visibility and underpins sustainable growth. People Counting System industry participants leverage cross-selling—pairing sensor upgrades with dashboard training—to lock in multi-year contracts. Software platforms move toward micro-services that ingest third-party data, supporting predictive staffing and energy-optimization use cases.
Integration depth raises complexity, positioning services firms as orchestrators that align IT security, facilities management, and marketing. Projects that join occupancy data with HVAC schedules demonstrate tangible opex gains, encouraging building owners to shift spending from fixed assets to outcome-based agreements. As a result, the services category helps diversify the People Counting System market beyond hardware refresh cycles.


By Sensor Technology: ToF accelerates amid regulatory tailwinds
Infrared beam sensors captured 36.10% of People Counting System market share in 2025 on the back of reliability in narrow-door installations. Yet ToF 3D sensors are set to expand at a 14.05% CAGR, catalyzed by privacy laws that favor non-imaging depth measurement. By converting light-flight time into depth maps, ToF differentiates people from carts and pets, sustaining accuracy under changing lighting. The shift bodes well for vendors with proprietary ToF ASICs that can embed GDPR-inclusive logic. Video-based approaches survive by pivoting to on-edge inference that strips personal imagery, but some buyers remain cautious. Thermal imaging occupies a niche in hospitals where temperature screening merges with head counts. The People Counting System market size tied to ToF sensors is projected to eclipse infrared revenues before 2030 as component cost curves decline.
Hybrid deployments that blend ToF at entry points with Wi-Fi probes in open zones demonstrate rising interest in multimodal precision. Qualcomm’s patent work on scalable depth estimation underscores wider tech-stack investment that will keep ToF on a steep performance trajectory. As adoption broadens, economies of scale further compress price points, reinforcing switch-over momentum.
By Deployment Mode: Cloud adoption broadens user base
On-premise installations accounted for 70.60% of People Counting System market size in 2025, anchored by public-sector and healthcare data-sovereignty rules. Cloud deployments are advancing fastest at 14.2% CAGR as multi-site retailers prioritize central dashboards and elastic compute. Hybrid schemes combine edge devices for millisecond latency with cloud analytics for fleet benchmarking. 5G rollouts ease high-bandwidth uploads, while LP-WAN back-channels supply redundancy. Software-only entrants such as Yellow Sub AI demonstrate a light-footprint approach that eliminates site hardware by analyzing publicly available data streams, opening fresh ground for service-led differentiation.
Cost-flexible, pay-as-you-go pricing stimulates adoption among mid-market chains. At the same time, cloud providers must prove encryption robustness and regional data residency to satisfy regulators. Progressive contracts include phased migration paths that start with on-site appliances and shift analytic workloads to the cloud once compliance gates clear, smoothing buyer journeys within the People Counting System market.
By Connectivity: LP-WAN unlocks hard-to-wire locations
Wired Ethernet or PoE still powers 55.10% of counted devices, favored for reliability and security in retail and corporate campuses. LP-WAN formats LoRa, Zigbee, BLE are growing at a 13.5% CAGR because they offer multi-year battery life and sub-GHz penetration that suits heritage buildings and temporary pop-ups. Wi-Fi remains the default in medium-scale spaces, while early-stage 6G research hints at high-bandwidth, low-power benefits for edge AI. Milesight’s LoRaWAN VS133 line proves that wire-free devices can support both uni-directional and bidirectional counting without compromising battery headroom.
Hybrid connectivity blends wired power at main entrances with LP-WAN repeaters inside large floors, tightening coverage without trenching. Vendors bundle SIM-based cellular as fallback for mission-critical sites. This flexible network layer strengthens the People Counting System market’s reach into greenfield and retrofit projects alike.
By End-User Vertical: Transportation hubs outpace retail’s mature base
Transportation hubs are forecast to post a 14.35% CAGR, buoyed by airport, metro, and bus-terminal modernization. Smart-gate systems calibrate staffing and security lanes in real time, improving traveler throughput while satisfying health-capacity guidelines. Retail retains the largest revenue pool at 28.40%, yet year-over-year growth slows as penetration rises toward saturation in tier-one chains. Malls re-engage after foot-traffic rebounds, deploying zone analytics to drive tenant leasing value. Healthcare and public buildings increasingly leverage occupancy data for infection-control and energy objectives, widening addressable demand. Sports venues, although challenged by open-area counting, represent high ticket value once accuracy hurdles resolve. The People Counting System industry thus maintains diversified exposure that lessens dependence on any single sector.
Geography Analysis
Asia Pacific holds a 31.10% revenue stake in 2025, propelled by government-funded smart-city frameworks and locally manufactured sensor hardware that compresses unit costs. Singapore’s MRT applies camera upgrades and ticket data to push crowdedness alerts, while Hong Kong integrates LiDAR-backed edge AI for railway safety. Japan’s JR East processes Suica transaction logs across ~600 stations to model commuter flow, feeding both transport planning and retail placement. China’s tier-two city urbanization fuels bulk orders for crowd-management kits, and Southeast Asian airports deploy ToF counters to speed security lines. These coordinated infrastructure goals cement the region’s long-term dominance within the People Counting System market.
The Middle East emerges as the fastest-growing geography at a 13.85% CAGR. Vision 2030 programs back large-scale sensor rollouts in Saudi Arabia, the UAE, and Qatar. Bold Technologies allocates USD 2.5 billion to the Aion Sentia cognitive-city platform that fuses mobility, healthcare, and energy data on one AI layer. Dubai targets a city-wide digital twin via street-level sensors, expanding opportunities for crowd analytics providers. Venture-capital flows into MENA analytics startups indicate rising local supply capacity.
North America sustains adoption through retail refresh cycles and federal facility mandates. The return of U.S. mall shoppers in 2025 renews appetite for staff-versus-shopper differentiation features. Europe’s GDPR regime fosters privacy-centric ToF and on-edge video solutions, stimulating upgrades rather than greenfield sales. South America grapples with SMB affordability, while Africa’s nascent smart-city schemes provide longer-dated upside.

Competitive Landscape
The People Counting System market is moderately fragmented. Axis Communications, Teledyne FLIR, and Xovis leverage camera and sensor portfolios to cross-sell analytics modules, while focused players such as FootfallCam and V-Count emphasize purpose-built accuracy and privacy. Battery Ventures’ majority stake in RetailNext supplies expansion capital for AI roadmap acceleration. Milesight aligns with Vemco Group to merge ToF edge devices and cloud dashboards, signaling a convergence toward integrated IoT stacks. Patent velocity in depth-estimation algorithms, including Qualcomm’s scalability work, highlights future differentiation on low-power edge intelligence.
Strategically, incumbents seek vertical-specific feature sets such as queue management for airports or space-planning for corporate campuses. Emerging disruptors explore software-only or subscription pricing to undercut hardware-heavy offerings. Competitive advantage increasingly pivots on compliance certification, energy tie-ins, and total-cost-of-ownership reductions. Overall, the top five players control roughly 35-40% of revenue, leaving space for regional specialists and OEM white-label suppliers.
People Counting System Industry Leaders
RetailNext Inc.
Axis Communications AB
Teledyne FLIR Systems Inc.
FootfallCam Ltd.
Xovis AG
- *Disclaimer: Major Players sorted in no particular order

Recent Industry Developments
- April 2025: Bold Technologies committed USD 2.5 billion to the Aion Sentia AI cognitive-city platform, positioning itself as a full-stack urban-intelligence vendor and signaling downstream demand for crowd-analytics modules.
- April 2025: The UAE unveiled biometric ID replacement using facial recognition, creating interoperability pathways with counting systems for unified citizen services
- March 2025: The UAE unveiled biometric ID replacement using facial recognition, creating interoperability pathways with counting systems for unified citizen services
- February 2025: Milesight partnered with Vemco Group to fuse LoRaWAN sensors and analytics software, targeting retailers’ real-time occupancy needs.


Global People Counting System Market Report Scope
The people counting system consists of the counter device integrated with a surveillance camera and facial recognition technology that measures the number of people and the direction in which they travel. The people counting system is widely used in the entrance and exist of shopping malls, retail stores, government buildings, and many other public places, where there is a chance of high crowd.
| Hardware |
| Software |
| Services |
| Infrared Beam |
| Thermal Imaging (IR) |
| Video-Based (Mono / Stereo / AI) |
| Time-of-Flight (3-D) |
| Pressure and Magnetic |
| Wi-Fi / BLE Probe |
| On-Premise |
| Cloud |
| Wired (Ethernet / PoE) |
| Wireless (Wi-Fi) |
| LP-WAN (LoRa, Zigbee, BLE) |
| Retail Stores |
| Shopping Malls and Hypermarkets |
| Transportation Hubs (Airports / Metro / Bus) |
| Hospitality and Leisure (Hotels, Casinos, Theme Parks) |
| Sports and Entertainment Venues |
| Banks and Financial Institutions |
| Corporate and Government Buildings |
| Healthcare Facilities |
| Smart Cities and Public Spaces |
| Others |
| North America | United States | |
| Canada | ||
| Mexico | ||
| South America | Brazil | |
| Argentina | ||
| Chile | ||
| Rest of South America | ||
| Europe | United Kingdom | |
| Germany | ||
| France | ||
| Italy | ||
| Spain | ||
| Nordics (Sweden, Norway, Denmark, Finland) | ||
| Rest of Europe | ||
| Asia Pacific | China | |
| Japan | ||
| India | ||
| South Korea | ||
| Southeast Asia | ||
| Australia | ||
| New Zealand | ||
| Rest of Asia Pacific | ||
| Middle East and Africa | Middle East | Saudi Arabia |
| United Arab Emirates | ||
| Turkey | ||
| Rest of Middle East | ||
| Africa | South Africa | |
| Nigeria | ||
| Rest of Africa | ||
| By Offering | Hardware | ||
| Software | |||
| Services | |||
| By Sensor Technology | Infrared Beam | ||
| Thermal Imaging (IR) | |||
| Video-Based (Mono / Stereo / AI) | |||
| Time-of-Flight (3-D) | |||
| Pressure and Magnetic | |||
| Wi-Fi / BLE Probe | |||
| By Deployment Mode | On-Premise | ||
| Cloud | |||
| By Connectivity | Wired (Ethernet / PoE) | ||
| Wireless (Wi-Fi) | |||
| LP-WAN (LoRa, Zigbee, BLE) | |||
| By End-User Vertical | Retail Stores | ||
| Shopping Malls and Hypermarkets | |||
| Transportation Hubs (Airports / Metro / Bus) | |||
| Hospitality and Leisure (Hotels, Casinos, Theme Parks) | |||
| Sports and Entertainment Venues | |||
| Banks and Financial Institutions | |||
| Corporate and Government Buildings | |||
| Healthcare Facilities | |||
| Smart Cities and Public Spaces | |||
| Others | |||
| By Geography | North America | United States | |
| Canada | |||
| Mexico | |||
| South America | Brazil | ||
| Argentina | |||
| Chile | |||
| Rest of South America | |||
| Europe | United Kingdom | ||
| Germany | |||
| France | |||
| Italy | |||
| Spain | |||
| Nordics (Sweden, Norway, Denmark, Finland) | |||
| Rest of Europe | |||
| Asia Pacific | China | ||
| Japan | |||
| India | |||
| South Korea | |||
| Southeast Asia | |||
| Australia | |||
| New Zealand | |||
| Rest of Asia Pacific | |||
| Middle East and Africa | Middle East | Saudi Arabia | |
| United Arab Emirates | |||
| Turkey | |||
| Rest of Middle East | |||
| Africa | South Africa | ||
| Nigeria | |||
| Rest of Africa | |||


Key Questions Answered in the Report
What is the current size of the People Counting System market?
The market is valued at USD 1.64 billion in 2026 and is forecast to reach USD 2.99 billion by 2031.
Which segment is growing fastest within the People Counting System market?
Services, driven by managed analytics and integration support, is projected to grow at a 13.45% CAGR through 2031.
Why are Time-of-Flight sensors gaining traction?
ToF sensors combine 99.8% accuracy with privacy-friendly depth mapping, ensuring GDPR compliance and reducing total cost of ownership.
Which geography will expand most rapidly?
The Middle East is expected to post a 13.85% CAGR through 2031 on the back of Vision 2030 smart-city investments.
How do occupancy sensors improve energy efficiency?
Integrating people counts with HVAC systems has yielded documented energy savings of up to 12.5% in commercial buildings.
What connectivity options are preferred for hard-to-wire sites?
LP-WAN technologies such as LoRa and Zigbee provide multi-year battery life and strong penetration, enabling cost-effective deployments in older or temporary structures.
Page last updated on:


