PCR Packaging Market Size and Share
Market Overview
| Study Period | 2020 - 2031 |
|---|---|
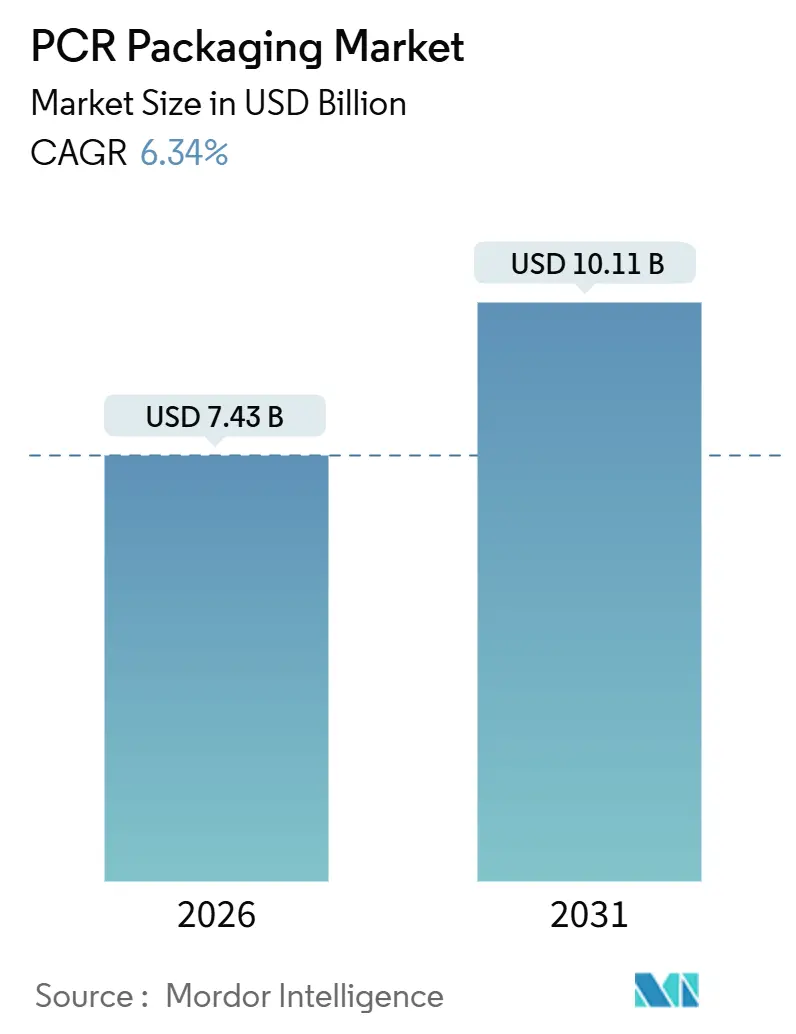
| Market Size (2026) | USD 7.43 Billion |
| Market Size (2031) | USD 10.11 Billion |
| Growth Rate (2026 - 2031) | 6.34% CAGR |
| Fastest Growing Market | Africa |
| Largest Market | Asia Pacific |
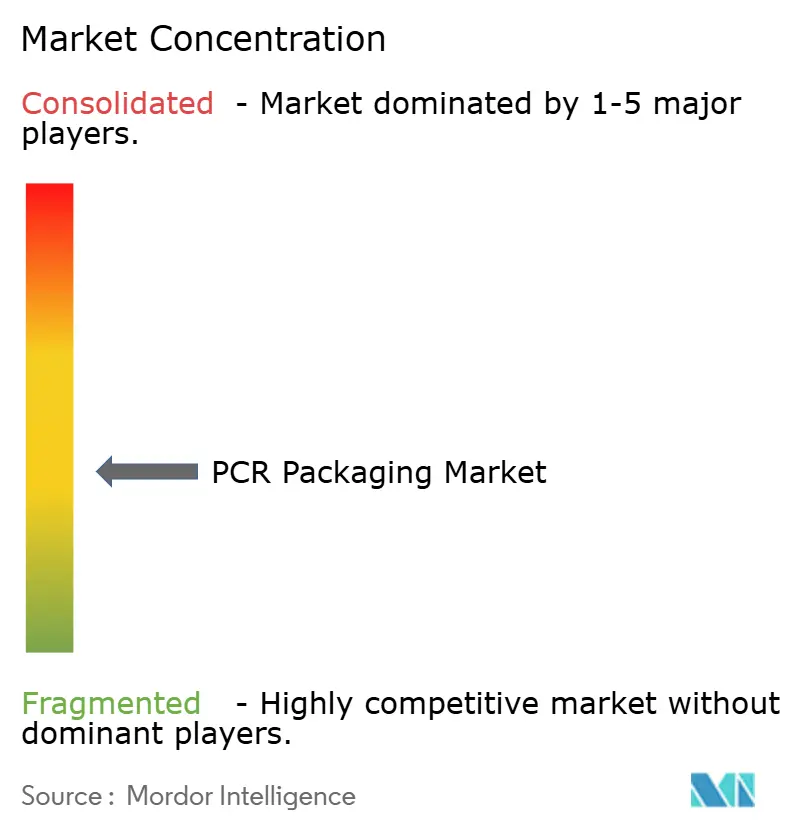
| Market Concentration | Medium |
Major Players *Disclaimer: Major Players sorted in no particular order Image © Mordor Intelligence. Reuse requires attribution under CC BY 4.0. | |
PCR Packaging Market Analysis by Mordor Intelligence
The PCR packaging market size stands at USD 7.43 billion in 2026 and is projected to reach USD 10.11 billion by 2031, reflecting a 6.34% CAGR. Across global value chains, brand-owner pledges, recycled-content mandates, and converter integration into washing and pelletizing capacity continue to shift demand away from virgin polymers toward certified circular feedstock. Polyethylene terephthalate remains the workhorse material thanks to bottle-to-bottle loops and food-contact approvals, yet mono-material pouches are scaling fastest as cosmetics and personal-care brands prioritize lightweight designs compatible with mechanical recycling. Tightening extended producer responsibility (EPR) schemes in California, the European Union, and Japan provide a regulatory floor for post-consumer resin, while Africa’s rising deposit-return systems attract fresh capital in wash-line infrastructure. Consolidation among converters accelerates, creating procurement scale and closed-loop capabilities that secure long-term supply agreements with multinational fast-moving consumer goods companies.
Key Report Takeaways
- By material type, polyethylene terephthalate held 46.50% of PCR packaging market share in 2025 and is forecast to expand at a 10.80% CAGR through 2031.
- By product type, bottles captured 37.90% revenue in 2025, whereas pouches are projected to grow at an 11.50% CAGR to 2031.
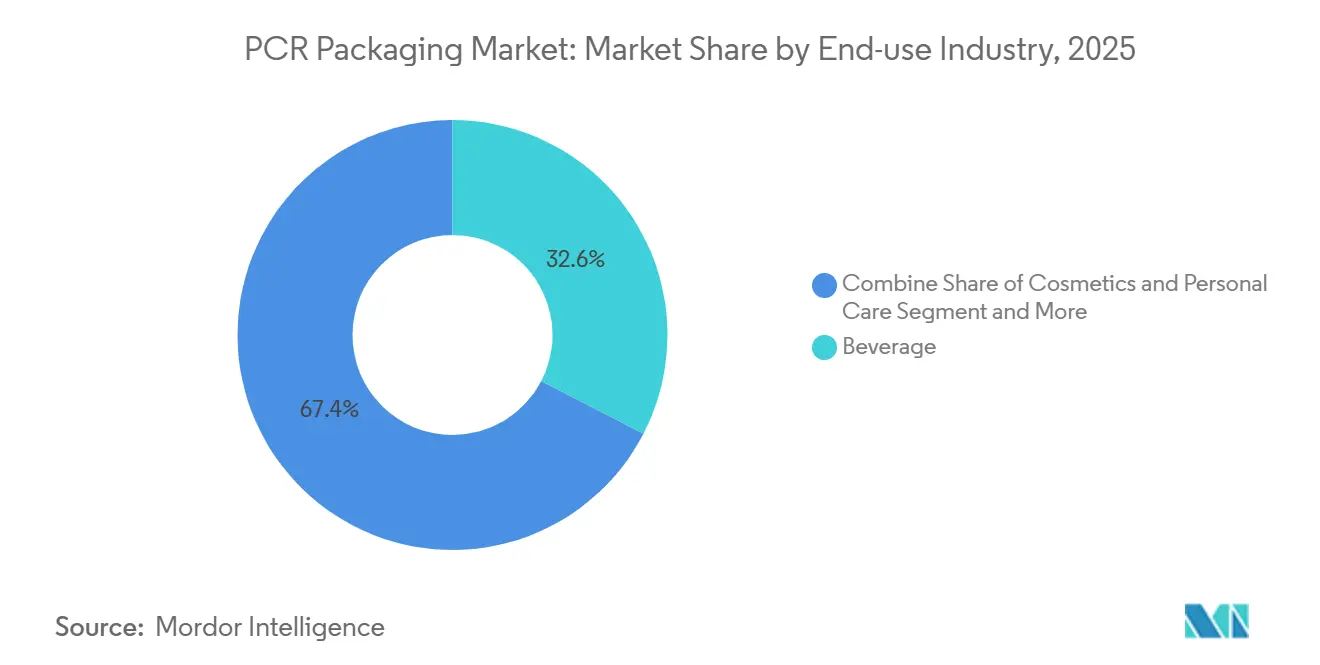
- By end-use industry, beverage applications led with 32.60% share in 2025; cosmetics and personal care is advancing at a 12.20% CAGR through 2031.
- By recycling source, post-consumer feedstock accounted for 71.45% of PCR packaging market size in 2025 and is rising at a 13.40% CAGR over the forecast period.
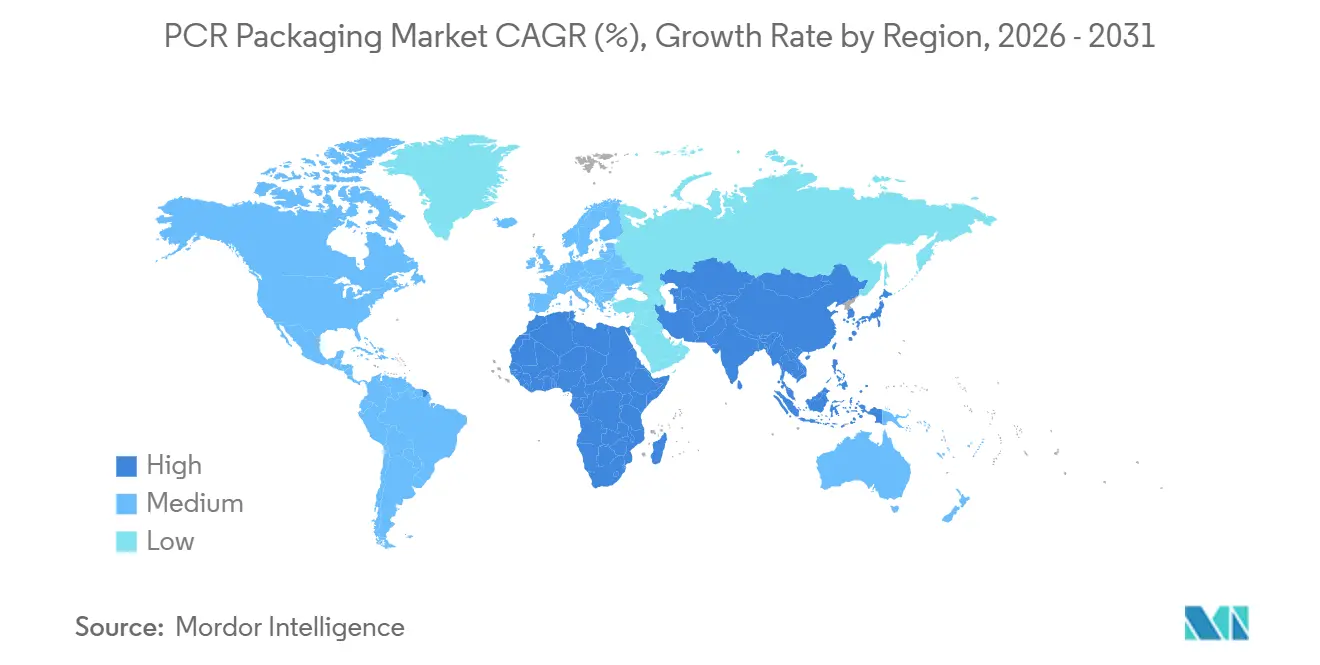
- By geography, Asia-Pacific commanded 38.50% of global demand in 2025, while Africa is poised for the fastest growth at a 14.10% CAGR to 2031.
Note: Market size and forecast figures in this report are generated using Mordor Intelligence’s proprietary estimation framework, updated with the latest available data and insights as of January 2026.
Global PCR Packaging Market Trends and Insights
Drivers Impact Analysis*
| Driver | (~) % Impact on CAGR Forecast | Geographic Relevance | Impact Timeline |
|---|---|---|---|
| FMCG Brands' Recycled-Content Pledges Accelerate Volume Demand | +1.2% | North America, Europe, urban Asia-Pacific | Medium term (2-4 years) |
| Government EPR and Recycled-Content Mandates Tighten After 2025 | +1.5% | Europe, California, Japan, South Korea, India, Brazil | Long term (≥4 years) |
| Improved Global PCR Resin Supply Narrows Price Gap with Virgin Plastics | +1.0% | North America, Europe, Southeast Asia | Medium term (2-4 years) |
| Closed-Loop Brand Take-Back Programs Unlock New Feedstock Pools | +0.8% | North America and Europe, pilot Asia-Pacific cities | Short term (≤2 years) |
| Advanced Decontamination Technologies Enable Food-Grade PCR | +0.7% | North America, Europe, Japan, India, China | Medium term (2-4 years) |
| Blockchain Traceability Platforms Boost Compliance Confidence | +0.4% | Global | Short term (≤2 years) |
| Source: Mordor Intelligence | |||
FMCG Brands' Recycled-Content Pledges Accelerate Volume Demand
Global consumer-goods companies have locked in public targets that require minimum recycled content across packaging portfolios. Nestlé Purina converted its Friskies canisters to 100% mechanically recycled plastic in 2025, removing 500 metric tons of virgin material annually [1]Amcor plc, “Sustainability Report FY25,” AMCOR.COM. Mars Petcare Australia followed with Schmackos packs that integrate 60% ISCC PLUS-certified resin, demonstrating price-tolerant adoption even in treat categories. Multi-year supply contracts arising from these pledges give converters the demand certainty needed to finance new extrusion lines and decontamination assets. Beverage and personal-care brands feel the greatest consumer scrutiny, yet industrial film categories are beginning to align as Scope 3 emissions enter procurement scorecards. The overall effect is a structural pull that disciplines recycled-resin demand even when virgin-polymer prices soften.
Government EPR and Recycled-Content Mandates Tighten After 2025
Regulators are translating voluntary frameworks into enforceable quotas. California’s Plastic Pollution Prevention and Packaging Producer Responsibility Act sets a 25% cut in single-use plastics by 2032, subjecting non-compliant producers to per-ton fees. The European Union’s updated Packaging and Packaging Waste Regulation widens recycled-content thresholds beyond polyethylene terephthalate bottles to include flexible films and closures. Japan revised its recycling targets in 2024, and South Korea now pilots deposit-return for polyethylene pouches. These policies create a compliance floor: brand owners must secure certified post-consumer resin regardless of the virgin-to-recycled price spread. Certification frameworks such as ISCC PLUS and RecyClass have consequently become market-access passports for converters serving multinational clients.
Improved Global PCR Resin Supply Narrows Price Gap with Virgin Plastics
Mechanical recycling investments and commercial-scale advanced recycling projects expand the volume of food-grade post-consumer resin. ALPLA will channel EUR 15 million (USD 16.9 million) per year into recycling lines from 2026, doubling its output capacity to 700,000 metric tons by 2030. Amcor’s agreement with ExxonMobil grants it access to chemically recycled polyethylene via the Exxtend process, accelerating circular feedstock for healthcare and food pouches. As converters co-locate wash lines beside extrusion assets, freight costs fall and quality consistency rises, compressing the historical 20%–30% price premium over virgin resin.
Closed-Loop Brand Take-Back Programs Unlock New Feedstock Pools
Retail collection bins, refill schemes, and e-commerce reverse logistics secure mono-polymer streams that bypass municipal contamination. Amcor’s refillable milk bottle, reused up to 16 times before recycling, underscores the synergy between reuse and closed-loop systems. Cosmetics houses deploy in-store drop-boxes for empty jars, yielding high-purity material that meets food- and cosmetic-contact standards. Although economics favor high-margin categories today, pilot programs in quick-service restaurants suggest scalable reverse-logistics automation could extend closed-loop benefits to mass-market applications by 2028.
Restraints Impact Analysis*
| Restraint | (~) % Impact on CAGR Forecast | Geographic Relevance | Impact Timeline |
|---|---|---|---|
| Quality Variability and Contamination of PCR Resins | -0.9% | Africa, South Asia, Latin America | Medium term (2-4 years) |
| Under-Developed Collection and Sorting in Emerging Markets | -1.2% | Africa, South Asia, Southeast Asia | Long term (≥4 years) |
| Recycled-Resin Price Volatility from Oil-Price Swings | -0.6% | Global | Short term (≤2 years) |
| ESG-Audit Failures Cause Recalls and Brand-Equity Risk | -0.5% | Global | Short term (≤2 years) |
| Source: Mordor Intelligence | |||
Quality Variability and Contamination of PCR Resins
Mixed-polymer bales, adhesive residues, and food soils degrade melt flow and color, compelling converters to blend recycled resin with virgin feedstock at 30%–50% ratios [2]Packaging Insights, “Amcor adopts advanced recycling module at UK facility,” PACKAGINGINSIGHTS.COM . Optical sorters reach 98% accuracy on clear polyethylene terephthalate but stumble on black pigments and multilayer sachets. Hot-caustic washes remove labels, yet residual adhesive manifests as gels during extrusion, limiting film aesthetics. Odor-causing volatiles generated from food soils restrict usage in dairy and bakery packaging. Super-clean wash lines and reactive extrusion can restore virgin-like quality, though each line costs upward of USD 10 million, restricting adoption to large converters with assured feedstock.
Under-Developed Collection and Sorting in Emerging Markets
In Nigeria and Egypt, municipal collection rates remain below 30%, and informal yards introduce cross-contamination that limits production of single-polymer bales. India’s fragmented aggregators supply mixed plastics commanding a 15%–25% discount versus virgin resin because of inconsistent melt flow. South Africa’s deposit-return lifts polyethylene terephthalate recovery above 70%, but flexible packaging remains uncollected owing to inadequate optical sorting. Converters must transfer technology and capital for modular wash lines, yet currency and regulatory risks deter investment without guaranteed offtake.
*Our forecasts treat driver/restraint impacts as directional, not additive. The impact forecasts reflect baseline growth, mix effects, and variable interactions.
Segment Analysis
By Material Types: PET Dominance Anchored by Bottle Recycling Infrastructure
Polyethylene terephthalate accounted for 46.50% of PCR packaging market share in 2025. Strong bottle-to-bottle loops, FDA and EFSA approvals, and brand commitments collectively drive a forecast 10.80% CAGR to 2031. Klöckner Pentaplast’s 15,000-metric-ton expansion backs kpNext blister films and kp Elite trays made with up to 100% recycled content. Polyethylene follows on industrial and agricultural films but faces sensory hurdles in food-contact formats despite advances in vacuum distillation. Polypropylene gains traction in hot-fill and retort packaging via mono-material retort pouches such as Huhtamäki’s Blueloop PP Retort, yet limited recycling infrastructure inflates price premiums. Polyvinyl chloride and polystyrene together remain below 10%, restricted by adverse regulations and limited end-of-life pathways.
Mono-material design trends cut across all polymers, spurring investment in co-extrusion lines that eliminate aluminum foil and ethylene-vinyl-alcohol layers. Advanced barrier coatings now enable polyethylene and polypropylene pouches to meet oxygen-transmission targets without multi-layer laminates, widening the addressable scope for high-recycled-content solutions. As regulators raise recycled-content thresholds, these materials will need decontamination innovations to match polyethylene terephthalate’s established food-grade pathways.


By Product Type: Bottles Lead, Pouches Surge on Mono-Material Innovation
Bottles retained 37.90% revenue contribution in 2025, bolstered by deposit-return systems that secure high-quality feedstock and permit multiple closed-loop cycles. Trays remain pivotal for meat and ready-meal applications, with Amcor and kp expanding clear recycled-polyethylene terephthalate thermoforms that satisfy modified-atmosphere packaging needs. The standout growth, however, comes from pouches, projected at an 11.50% CAGR through 2031. Huhtamäki’s Blueloop PE pouch replaces multi-layer structures, cutting carbon footprint by 73% and retaining mechanical recyclability.
Converter investments support this shift. TC Transcontinental’s USD 60 million biaxially oriented polyethylene film line in South Carolina delivers recyclability without sacrificing form-fill-seal efficiency. Caps, closures, and clamshells round out the portfolio, with molded-fiber formats beginning to displace polystyrene foam in takeaway channels.
By End-Use Industry: Beverage Leads, Cosmetics Accelerates on Prestige Positioning
Beverage brands consumed 32.60% of PCR packaging market size in 2025, leveraging clear on-pack recycled-content claims that resonate with consumers. Closed-loop polyethylene terephthalate schemes provide high collection yields, enabling soda, water, and juice bottlers to meet 25%–50% recycled-content targets. Cosmetics and personal care represent the fastest climb, charting a 12.20% CAGR to 2031. Aptar’s Color Code PCR fragrance pump integrates up to 67% post-consumer resin and cuts production carbon dioxide emissions by 39%. Haleon’s Otrivin pump, incorporating 60% circular material, doubles down on bio-based feedstock to satisfy brand sustainability roadmaps.
Food trays, bakery films, and ready-meal containers absorb a solid share, aided by advanced recycling modules such as Greenback’s Enval system installed at Amcor’s Heanor site. Healthcare adoption lags but rises steadily as regulators clarify post-consumer content pathways for non-contact components. Industrial films remain cost-sensitive, responding acutely to crude-oil-linked virgin-resin price swings.
By Recycling Source: Post-Consumer Dominates, Driven by Regulatory Mandates
Post-consumer streams supplied 71.45% of global demand in 2025 and are growing at 13.40% CAGR. Amcor alone consumed 218,000 metric tons of post-consumer resin in fiscal 2025, equating to 10% of its plastic throughput. Deposit-return expansion, blockchain-enabled chain-of-custody, and super-clean wash lines underpin this advance. Post-industrial scrap, at 28.55%, remains valuable for in-plant reuse yet lacks regulatory credit, limiting its strategic weight in brand sustainability metrics. Rising EPR targets in emerging markets are expected to tilt the balance further toward post-consumer inputs by 2031.
Geography Analysis
Asia-Pacific remained the largest regional hub, holding 38.50% share in 2025. China’s updated packaging-waste rules and Japan’s mature bottle-recycling networks ensure a steady supply of food-grade resin. India’s informal aggregators fill volume gaps, although inconsistent quality constrains applications in dairy and ready meals. Australia and New Zealand achieve over 80% polyethylene terephthalate bottle recovery via container-deposit laws, giving converters reliable feedstock.
Africa is set to record a 14.10% CAGR, the highest globally. South Africa’s deposit-return system secures more than 70% polyethylene terephthalate recovery, attracting converter investments in wash-line capacity. Nigeria and Egypt deploy optical sorters through public-private partnerships, lifting bale purity and enabling production of mechanically recycled polyethylene suitable for personal-care packaging. Infrastructure gaps persist for flexible films, yet pilot modular wash lines signal momentum.
North America benefits from California’s producer-responsibility act and well-established polyethylene terephthalate recycling infrastructure. Flexible formats remain under-collected, but investments such as Novolex’s plastic-film recycling centers elevate supply. Mexico gains traction as brands localize supply chains, yet collection rates hover below 40%. Europe sustains strong demand through the Packaging and Packaging Waste Regulation, with Germany, France, Italy, Spain, and the United Kingdom offering comprehensive curbside and deposit-return coverage and stringent thresholds for recycled content.

Competitive Landscape
Competition is moderately fragmented: the top 20 converters control 55% of global capacity. Consolidation, however, is accelerating. Novolex’s USD 6.7 billion purchase of Pactiv Evergreen in April 2025 merged over 250 brands and integrated two plastic-film recycling centers, leveraging procurement scale and diverse substrates [3]Source: Newswire, “Novolex and Pactiv Evergreen Complete Combination,” NEWSWIRE.CA. ProAmpac’s pending USD 1.51 billion acquisition of TC Transcontinental Packaging, expected to close in Q1 2026, adds dairy, meat, medical, and pharmaceutical capacity across four continents.
Strategic themes center on backward integration into feedstock and forward integration into brand partnerships. Amcor operates CleanStream facilities and hosts Greenback’s Enval advanced-recycling modules, tying recycled-content supply to converter assets. Blockchain traceability platforms document chain-of-custody, reducing ESG-audit risk. Smaller converters lacking certified feedstock or advanced decontamination lines face displacement as multinational brands tighten supplier criteria. White-space opportunity lies in high-barrier flexible packaging: converters that master super-clean wash lines and reactive extrusion will capture margin as brand owners extend recycled-content targets beyond rigid bottles.
PCR Packaging Industry Leaders
Amcor plc
ALPLA Group
Plastipak
Mondi plc
Sonoco Products Co.
- *Disclaimer: Major Players sorted in no particular order

Recent Industry Developments
- January 2026: ALPLA reported EUR 5.2 billion (USD 5.87 billion) turnover for 2025 and reaffirmed a target to raise recycled material share to 30% by 2030.
- December 2025: ProAmpac agreed to acquire TC Transcontinental Packaging for USD 1.51 billion, aiming to close during Q1 2026.
- September 2025: Amcor installed a Greenback Enval advanced-recycling module at its Heanor, United Kingdom site for post-consumer flexible waste.
- August 2025: Amcor completed upgrades at the same Heanor facility, enabling an additional 2,800 metric tons of recyclate for high-performance flexible packaging.


Research Methodology Framework and Report Scope
Market Definitions and Key Coverage
Our study defines the post-consumer recycled (PCR) packaging market as all rigid and flexible packs whose primary substrate contains verified PCR resin, principally rPET, rPE, rPP, and rHDPE, irrespective of end-use industry or filling technology. The baseline is expressed in shipment volume because PCR adoption is dictated first by resin supply and then by value conversion.
Scope exclusion: Pre-consumer or factory scrap (PIR) material, bio-based polymers with no recycled content, and reusable containers that bypass recycling loops are outside the study.
Segmentation Overview
- By Material Types
- Polyethylene Terephthalate (PET)
- Polyethylene (PE)
- Polyvinyl Chloride (PVC)
- Polypropylene (PP)
- Polystyrene (PS)
- Other Material Types
- By Product Type
- Bottles
- Trays
- Pouches
- Other Product Types
- By End-Use Industry
- Food
- Beverage
- Healthcare
- Cosmetics and Personal Care
- Industrial
- Other End-Use Industry
- By Recycling Source
- Post-Consumer
- Post-Industrial
- By Geography
- North America
- United States
- Canada
- Mexico
- Europe
- Germany
- United Kingdom
- France
- Italy
- Spain
- Russia
- Rest of Europe
- Asia-Pacific
- China
- Japan
- India
- South Korea
- Australia
- Rest of Asia-Pacific
- Middle East
- Saudi Arabia
- United Arab Emirates
- Turkey
- Rest of Middle East
- Africa
- South Africa
- Nigeria
- Rest of Africa
- South America
- Brazil
- Argentina
- Rest of South America
- North America
Detailed Research Methodology and Data Validation
Primary Research
Mordor analysts interviewed resin reclaimers, converters, and sustainability leads across North America, Europe, and Asia-Pacific, and surveyed packaging buyers in food, beverage, and personal care segments. These discussions tested collection-rate assumptions, average selling prices, and realistic PCR blend limits, helping us reconcile desk estimates with on-ground realities.
Desk Research
We began with open datasets from bodies such as Eurostat, the US Environmental Protection Agency, NAPCOR, and the OECD, which report waste collection rates, bale yields, and recycled-content mandates. Trade associations, including the U.S. Plastics Pact and Petcore Europe, provided PCR resin price spreads and policy timelines that influence material mix. Company filings, investor decks, and press releases were scanned through Dow Jones Factiva and D&B Hoovers to capture line-side capacity additions and branded recycled-content targets. Customs shipment series and patent trends on mechanical and chemical recycling technologies supplied further evidence of supply inflection points. This list is illustrative; many additional sources supported data gathering, validation, and clarifications.
Market-Sizing & Forecasting
A top-down reconstruct of PCR resin supply built from collection volumes, sort-loss factors, and reclaim yield anchors the base. Results are cross-checked with selective bottom-up roll-ups of converter throughput and sampled ASP × volume math. Key variables include mandated recycled-content percentages, rPET-to-virgin price premiums, beverage-bottle return rates, announced wash-plant capacity, and brand PCR pledges. A multivariate regression links these drivers to historic adoption, while ARIMA smoothing handles short-run noise. Gaps where converter data are thin are bridged using regional penetration proxies vetted during interviews.
Data Validation & Update Cycle
Outputs pass variance checks against independent resin price indices and packaging shipment series, followed by a two-step analyst review before sign-off. Reports refresh each year, with interim updates triggered by material events such as new EPR laws or greater than 10 percent shifts in resin spreads, ensuring clients see the freshest view.
Why Mordor's PCR Packaging Baseline Commands Reliability
Published numbers often diverge because firms pick different functional scopes, metrics, and refresh cadences. Our team states volume in metric tons, whereas many publishers quote revenue, creating an immediate mismatch.
Key gap drivers include differing treatment of post-industrial scrap, inclusion of bio-based content, currency conversion years, and whether merchant reclaim margins or captive use are booked into revenue. Mordor's study filters out PIR and values only certified PCR resin, applies mid-year 2025 exchange rates, and is updated annually, choices that keep our baseline steady yet current.
Benchmark comparison
| Market Size | Anonymized source | Primary gap driver |
|---|---|---|
| 6.98 million tonnes (2025) | Mordor Intelligence | - |
| USD 17.46 billion (2025) | Global Consultancy A | Reports revenue, mixes PIR with PCR, and applies 2024 FX rates |
| USD 13.18 billion (2025) | Industry Association B | Covers only plastics value chain, excludes flexible film losses |
These comparisons show how scope, units, and refresh rules sway the headline figure. By grounding the model in auditable resin flows and openly stating assumptions, Mordor Intelligence delivers a dependable, transparent baseline that decision-makers can retrace and stress-test with ease.


Key Questions Answered in the Report
How large is the PCR packaging market in 2026?
The PCR packaging market is valued at USD 7.43 billion in 2026 and is forecast to reach USD 10.11 billion by 2031.
Which material holds the largest share in PCR-based packaging?
Polyethylene terephthalate leads with 46.50% share in 2025 due to mature bottle-to-bottle recycling and food-contact approvals.
What region is expected to grow fastest through 2031?
Africa is projected to record a 14.10% CAGR, fueled by deposit-return systems and new wash-line investments.
Why are pouches gaining traction in recycled packaging?
Mono-material design, lightweight formats, and cosmetics-sector demand push pouches to an 11.50% CAGR, outpacing rigid formats.
Page last updated on:


