Particulate Matter Monitoring Market Size and Share
Market Overview
| Study Period | 2019 - 2030 |
|---|---|
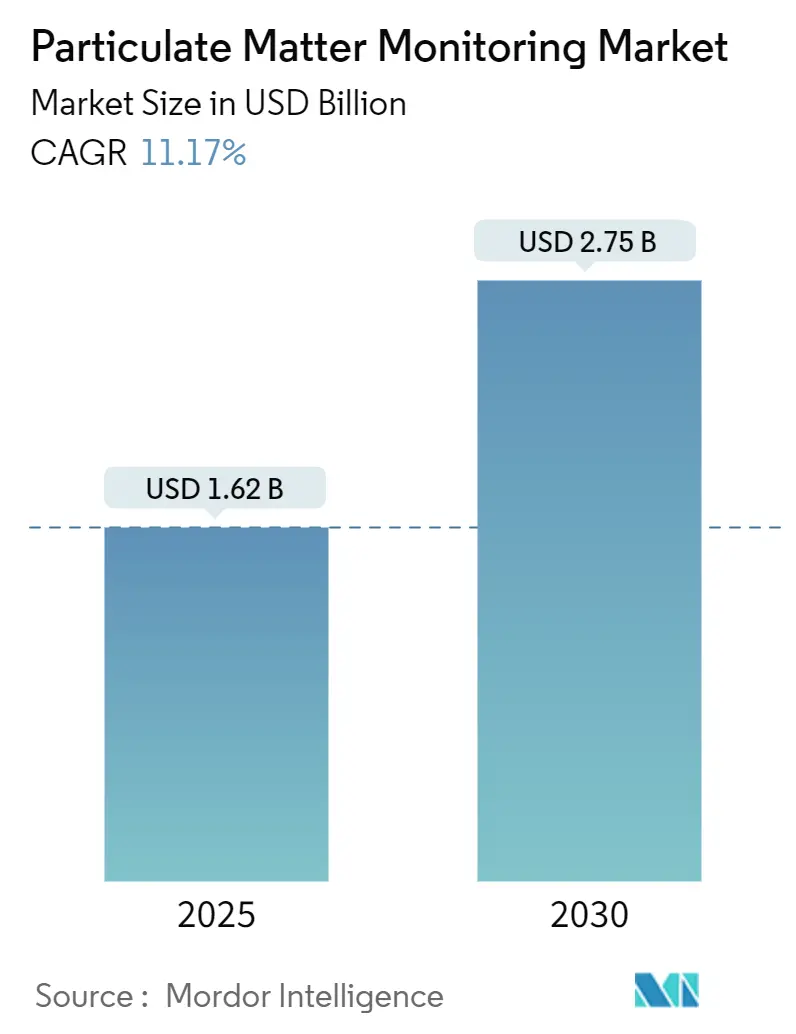
| Market Size (2025) | USD 1.62 Billion |
| Market Size (2030) | USD 2.75 Billion |
| Growth Rate (2025 - 2030) | 11.17% CAGR |
| Fastest Growing Market | Asia Pacific |
| Largest Market | North America |
| Market Concentration | Medium |
Major Players *Disclaimer: Major Players sorted in no particular order Image © Mordor Intelligence. Reuse requires attribution under CC BY 4.0. | |
Particulate Matter Monitoring Market Analysis by Mordor Intelligence
The particulate matter monitoring market size s estimated at USD 1.62 billion in 2025 and is forecast to reach USD 2.75 billion by 2030, advancing at an 11.17% CAGR over the period. Rapid sensor miniaturization, rising deployment of IoT-enabled networks, and tighter air-quality rules are combining with smart-city investments to sustain double-digit expansion of the particulate matter monitoring market. Industrial facilities are accelerating upgrades to comply with revised EPA fenceline mandates, while city authorities procure dense sensor grids that feed 15-minute-city dashboards. Manufacturers are responding with sub-USD 200 devices and AI-driven analytics that lower ownership costs, opening new demand in healthcare, precision agriculture, and occupational safety. Technological leadership in light-scattering optics, coupled with blockchain-based data-verification pilots, is widening the addressable base as public and private stakeholders seek real-time, hyperlocal air-quality intelligence.
Key Report Takeaways
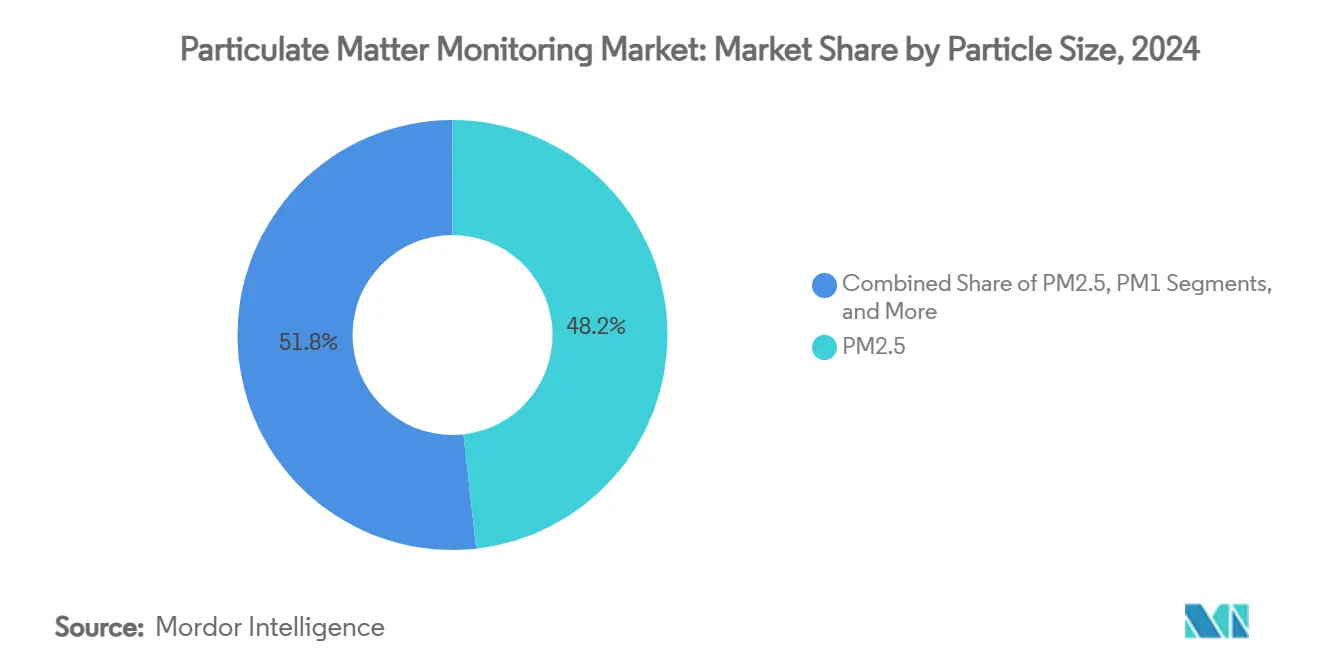
- By particle size, PM2.5 retained a 48.23% share of the particulate matter monitoring market in 2024, whereas PM1 is projected to post the fastest 11.21% CAGR to 2030.
- By type, outdoor monitoring accounted for 63.12% of 2024 revenue; indoor monitoring is set to expand at an 11.37% CAGR through 2030 as hospitals and offices tighten post-pandemic air-quality protocols.
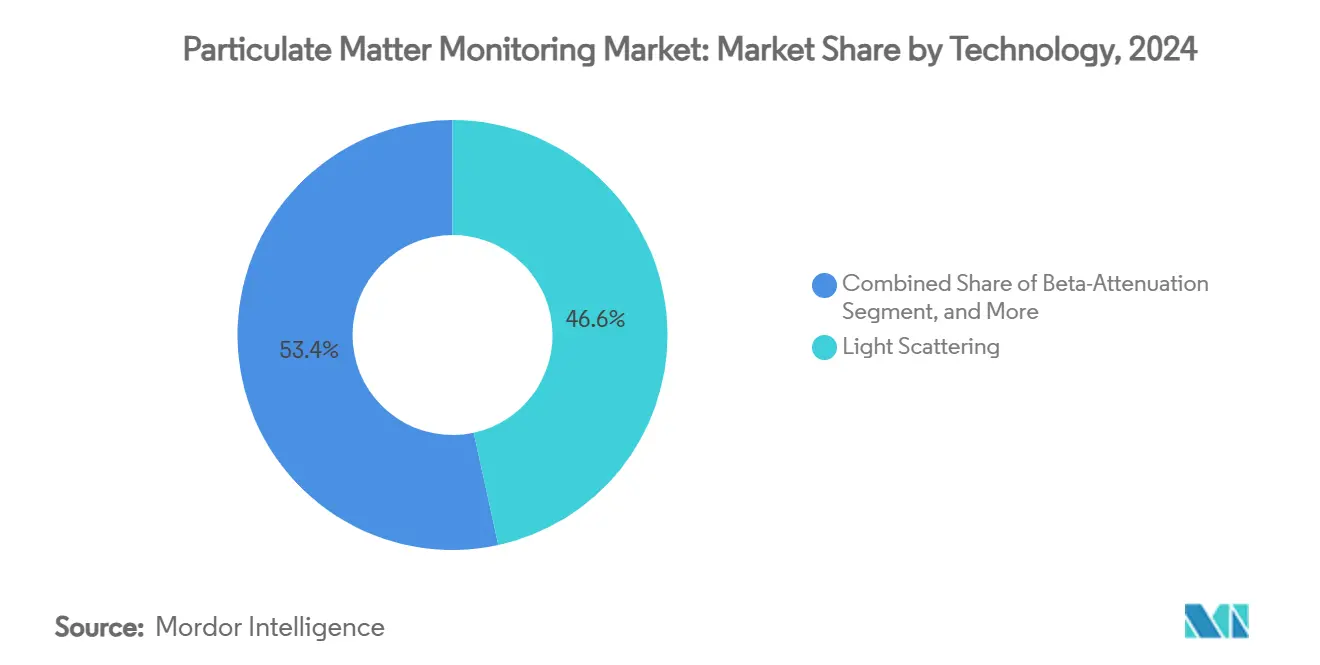
- By technology, light-scattering solutions captured 46.59% of the particulate matter monitoring market share in 2024, and the same platform is expected to register an 11.59% CAGR during the outlook period.
- By application, ambient-air networks led with 39.81% of revenue in 2024, while healthcare monitoring exhibits the strongest 11.68% CAGR on the back of infection-control initiatives.
- By geography, North America dominated with 34.78% share in 2024; Asia-Pacific is forecast to log an 11.92% CAGR to 2030 on the strength of national clean-air programmes and mega-city expansion.
Global Particulate Matter Monitoring Market Trends and Insights
Drivers Impact Analysis*
| Driver | (~) % Impact on CAGR Forecast | Geographic Relevance | Impact Timeline |
|---|---|---|---|
| Accelerated adoption of low-cost IoT-enabled PM sensors | +2.2% | Global, with early gains in Asia-Pacific and North America | Medium term (2-4 years) |
| Tighter WHO and national PM2.5/PM10 standards | +1.8% | Global, particularly Europe and North America | Long term (≥ 4 years) |
| Workplace ESG compliance pressure across process industries | +1.5% | Global, concentrated in North America and Europe | Medium term (2-4 years) |
| Urban "15-minute-city" air-quality dashboards | +0.9% | Europe and Asia-Pacific urban centers | Short term (≤ 2 years) |
| Growth of wildfire and dust-storm early-warning networks | +0.7% | North America, Australia, Mediterranean regions | Short term (≤ 2 years) |
| AI-driven predictive maintenance for PM monitors | +0.6% | Global, led by developed markets | Long term (≥ 4 years) |
| Source: Mordor Intelligence | |||
Accelerated adoption of low-cost IoT-enabled PM sensors
Sub-USD 200 optical devices are democratising access to particulate data, enabling universities and municipalities to install dense networks that map hyperlocal pollution patterns. Washington University prototypes show how embedded AI improves accuracy in large, crowdsourced fleets. [1]Washington University, “Real-Time Air and Water Quality Monitoring with AI-Based Data Analysis and Low-Cost Sensors,” wustl.edu Notre Dame’s wallet-sized ABLE detector extends these benefits to bedside infection-control in neonatal units. Blockchain pilots such as AirChain are tackling data-tampering concerns, assuring integrity without inflating costs. As a result, the particulate matter monitoring market is scaling beyond regulatory buyers into schools, retail chains, and farm operations.
Tighter WHO and national PM2.5/PM10 standards
The 2024 WHO guideline revision triggered cascading rule-makings. Australia and Canada have already adopted benchmarks stricter than previous national limits, obliging continuous PM2.5 tracking even for mid-sized facilities. In the United States the EPA’s new coke-oven rule demands fenceline benzene checks and updated stack equations, pushing steel plants to add bag-leak detection at electric-arc furnaces. The compressed 2025–2026 compliance window favours suppliers with proven certification records, translating to an immediate uplift for the particulate matter monitoring market.
Workplace ESG compliance pressure across process industries
Public-company ESG reports increasingly incorporate live emissions dashboards. ABB’s AI suite links particulate sensors to energy-control modules, cutting clinker kilns’ fuel use while documenting PM cutbacks. [2]ABB, “Applying Data Analytics and AI for Emission Control,” abb.com Nigerian cement plants are adopting similar platforms to attract international finance, confirming an ESG-led pull on the particulate matter monitoring market. Vendors able to combine predictive-emission models with verification hardware are carving out premium service contracts.
Urban “15-minute-city” air-quality dashboards
Cities from Paris to Seoul deploy block-level sensors so residents can plan walking routes and ventilation times in real time. Building-integrated IoT hubs merge HVAC controls with particulate alerts, optimising energy spend while preserving fresh air. Vision-based algorithms now extract PM indices from existing CCTV streams, adding 24/7 coverage without new roadside poles. This municipal wave is expanding the particulate matter monitoring market into traffic management, ad-supported public screens, and urban-planning analytics.
Restraints Impact Analysis*
| Restraint | (~) % Impact on CAGR Forecast | Geographic Relevance | Impact Timeline |
|---|---|---|---|
| Calibration drift in optical sensors under high humidity | -0.7% | Tropical and coastal regions globally | Short term (≤ 2 years) |
| Short product life-cycle versus long public-procurement cycles | -0.5% | Global, particularly government sectors | Medium term (2-4 years) |
| Fragmented regulatory certification regimes across regions | -0.4% | Global, most acute in emerging markets | Long term (≥ 4 years) |
| Data-ownership and privacy concerns in indoor environments | -0.3% | Europe, North America, developed Asia-Pacific | Medium term (2-4 years) |
| Source: Mordor Intelligence | |||
Calibration drift in optical sensors under high humidity
Light-scattering accuracy declines when water droplets scatter the laser beam, forcing frequent recalibrations in tropical hospitals and coastal factories. University of Basel findings show reactive PM components disappear within hours, making lab checks unreliable for field corrections. [3]University of Basel, “Proportion of Harmful Substances in Particulate Matter,” sciencedaily.com Sensor makers now bundle hydrophobic coatings and binning algorithms that classify droplet artefacts, as seen in Sensirion’s latest firmware. Higher upfront costs and lingering data-quality doubts restrain near-term growth in these climates.
Short product life-cycle versus long public-procurement cycles
Municipal tenders span three to five years, yet sensor revisions arrive every 18 months. The Pentagon’s daily bioaerosol programme illustrates the cost dilemma: consumables outstrip budget before the spec finalises, prompting virtualization trials to cut expenses tenfold. Agencies are experimenting with performance-based contracts, but without streamlined approval pathways many bids conclude with outdated models, stalling a sizeable slice of the particulate matter monitoring market.
*Our forecasts treat driver/restraint impacts as directional, not additive. The impact forecasts reflect baseline growth, mix effects, and variable interactions.
Segment Analysis
By Particle Size: Health-centric focus anchors PM2.5 leadership
PM2.5 monitoring held 48.23% of the particulate matter monitoring market share in 2024, buoyed by cardiovascular-risk evidence that underpins most global standards. Research urgency around ultrafine particles propels PM1 sensors to an 11.21% CAGR, steering funding toward devices capable of sub-micron detection. Bosch’s thumb-nail-sized BMV080 simultaneously tracks PM1, PM2.5, and PM10 and requires no fan, making it attractive for wearables and inhaler add-ons.
Academic investigations in Dhaka document PM1 spikes inside buses and kitchens, reinforcing demand for portable monitors in emerging megacities. Filter-free electrostatic purifiers that hit 90% removal efficiency need companion sensors to verify efficacy, linking air-cleaner rollouts directly to the particulate matter monitoring market.


By Type: Indoor expansion outpaces mature ambient networks
Outdoor stations contributed 63.12% of 2024 revenue, underpinned by EPA and CAAQS mandates that institutionalise replacement cycles. Yet indoor deployments will grow faster at an 11.37% CAGR, reflecting corporate wellness policies and pathogen-transmission concerns.
Healthcare leads this surge: HALO multi-parameter nodes scan PM, VOCs, and CO₂ across surgical wings, routing data to BMS dashboards that trigger real-time ventilation shifts. BIM-linked digital twins in new surgical towers predict pedestrian flows and pre-adjust airflow to maintain ISO class thresholds. Such convergence keeps the particulate matter monitoring market firmly embedded in smart-building budgets.
By Technology: Light-scattering optics extend dual supremacy
Light scattering retained 46.59% share in 2024 and is set for an 11.59% CAGR thanks to low-power LED sources and AI-corrected mass algorithms. Hybrid platforms are emerging: drones now carry twin modules, using light scattering for rapid mapping and gravimetric filters for periodic calibration checks, an architecture referenced in more than a dozen patents.
Beta-attenuation remains the compliance benchmark in power generation, while refinements such as HORIBA’s ultra-thin mass-flow controllers improve semiconductor clean-room stewardship. The “others” bucket—electrostatic, spectroscopy, and laser-induced incandescence—will stay niche until cost curves flatten, yet each niche adds to the breadth of the particulate matter monitoring market.
By Application: Hospitals create the steepest climb
Ambient-air networks still led at 39.81% in 2024, but hospital portfolios promise the briskest 11.68% CAGR. Pelco’s facility guide outlines continuous PM checks tied to infection-control audits. Impedance biosensors now detect pathogens at 695 Ω mL/µg sensitivity, integrating with PM feeds for unified airborne-hazard dashboards.
Process industries nurture a steady installed base; predictive-emission suites that swap hardware CAPEX for software subscriptions are resonating with cement kilns and coke ovens. Emerging fields such as precision-agriculture dust analysis and miners’ occupational exposure tracking are small today yet add reach to the particulate matter monitoring industry.
Geography Analysis
North America commanded 34.78% of 2024 revenue, reflecting dense regulatory networks, long-running state grants, and aggressive wildfire-monitoring budgets. EPA updates that tighten stack-opacity and benzene fenceline thresholds compel incremental purchases of certified monitors. Federal initiatives fund state sensor exchanges, refreshing fleets with AI-ready modules and sustaining the particulate matter monitoring market.
Asia-Pacific will be the fastest climber at 11.92% CAGR. China’s 2024–2025 action plan funds multi-pollutant grids across 168 cities, while India’s National Clean Air Programme sets aside capital grants for 131 non-attainment zones. Municipal pilots in Seoul integrate PM alerts with congestion-pricing models, evidencing data convergence that favours integrated monitoring analytics suites.
Europe holds a mature yet expandable base. The EU’s “Zero Pollution” ambition links transport electrification with hyperlocal exposure metrics; city councils retrofit CCTV poles with optical probes to inform low-emission-zone timers. The Middle East and Africa are earlier in the curve: mineral-export corridors and mega-events catalyse purchase orders, but spending cycles hinge on oil-price swings and concessional financing. Overall, regional contrasts enrich revenue streams, keeping the particulate matter monitoring market diversified across policy cycles.


Competitive Landscape
The market is moderately fragmented. Thermo Fisher Scientific, Siemens, Teledyne API, and TSI anchor the high-spec niche, leveraging validated optics and on-site calibration services. Mid-tier challengers differentiate through cloud dashboards, while start-ups bundle sensors with blockchain data ledgers, chasing utility-scale projects.
Service convergence is the strategic motif. Vendors wrap hardware with monthly analytics, automated compliance reporting, and API hooks that feed sustainability platforms. Spectris’ 2024 buyout of Micromeritics added material-characterisation expertise, elevating its pitch to semiconductor fabs and battery-anode lines.
Innovation vectors favour miniaturisation, multi-parameter detection, and mobility. Industrial-grade drones that compensate for rotor-induced turbulence capture vertical pollution plumes for refinery insurers, while filter-free electrostatic purifiers spark adjacent sensor demand to validate removal efficacy. These forces collectively enlarge the particulate matter monitoring market while gradually nudging it toward ecosystem partnerships over product sales.
Particulate Matter Monitoring Industry Leaders
Thermo Fisher Scientific Inc.
Siemens AG
Teledyne Technologies Incorporated
TSI Incorporated
Honeywell International Inc.
- *Disclaimer: Major Players sorted in no particular order

Recent Industry Developments
- June 2025: University of Notre Dame introduced the ABLE low-cost airborne-hazard detector for portable healthcare use.
- March 2025: University of Basel showed harmful PM compounds disappear within hours, underscoring the need for real-time sensors.
- February 2025: HORIBA Tocadero expanded its portfolio to hybrid outdoor–indoor stations for densely populated and remote areas.
- February 2025: Bosch Sensortec’s BMV080 won “Best in Show” at Embedded World for its fan-less, three-size PM sensing in a 4.4 × 3.0 × 3.0 mm³ package.


Global Particulate Matter Monitoring Market Report Scope
| PM1 |
| PM2.5 |
| PM5 |
| PM10 |
| Indoor Monitoring |
| Outdoor Monitoring |
| Light Scattering |
| Beta-Attenuation |
| Gravimetric |
| Opacity |
| Other Technologies |
| Process Industries |
| Ambient Air Monitoring |
| Indoor Air Monitoring |
| Healthcare |
| Others |
| North America | United States | |
| Canada | ||
| Mexico | ||
| South America | Brazil | |
| Argentina | ||
| Rest of South America | ||
| Europe | Germany | |
| United Kingdom | ||
| France | ||
| Russia | ||
| Rest of Europe | ||
| Asia-Pacific | China | |
| Japan | ||
| India | ||
| South Korea | ||
| Australia | ||
| Rest of Asia-Pacific | ||
| Middle East and Africa | Middle East | Saudi Arabia |
| United Arab Emirates | ||
| Rest of Middle East | ||
| Africa | South Africa | |
| Egypt | ||
| Rest of Africa | ||
| By Particle Size | PM1 | ||
| PM2.5 | |||
| PM5 | |||
| PM10 | |||
| By Type | Indoor Monitoring | ||
| Outdoor Monitoring | |||
| By Technology | Light Scattering | ||
| Beta-Attenuation | |||
| Gravimetric | |||
| Opacity | |||
| Other Technologies | |||
| By Application | Process Industries | ||
| Ambient Air Monitoring | |||
| Indoor Air Monitoring | |||
| Healthcare | |||
| Others | |||
| By Geography | North America | United States | |
| Canada | |||
| Mexico | |||
| South America | Brazil | ||
| Argentina | |||
| Rest of South America | |||
| Europe | Germany | ||
| United Kingdom | |||
| France | |||
| Russia | |||
| Rest of Europe | |||
| Asia-Pacific | China | ||
| Japan | |||
| India | |||
| South Korea | |||
| Australia | |||
| Rest of Asia-Pacific | |||
| Middle East and Africa | Middle East | Saudi Arabia | |
| United Arab Emirates | |||
| Rest of Middle East | |||
| Africa | South Africa | ||
| Egypt | |||
| Rest of Africa | |||


Key Questions Answered in the Report
What is the projected value of the particulate matter monitoring market by 2030?
The market is forecast to reach USD 2.75 billion by 2030.
Which particle size segment is expanding the fastest?
PM1 monitoring shows the highest 11.21% CAGR through 2030, driven by research on ultrafine particle health impacts.
Why is indoor monitoring growing more quickly than outdoor networks?
Post-pandemic air-quality policies in hospitals and offices require continuous indoor PM tracking, leading to an 11.37% CAGR for indoor systems.
Which technology accounts for the largest revenue share?
Light-scattering sensors hold 46.59% of 2024 revenue and continue to lead due to real-time performance and cost effectiveness.
What is driving Asia-Pacific’s rapid market growth?
National clean-air programmes, mega-city expansions, and aggressive smart-city investments push the region to an 11.92% CAGR.
How are companies differentiating in this market?
Vendors bundle hardware with analytics platforms, blockchain data integrity, and AI-based maintenance to offer end-to-end compliance solutions.
Page last updated on:


