Paperboard Trays Market Size and Share
Market Overview
| Study Period | 2019 - 2030 |
|---|---|
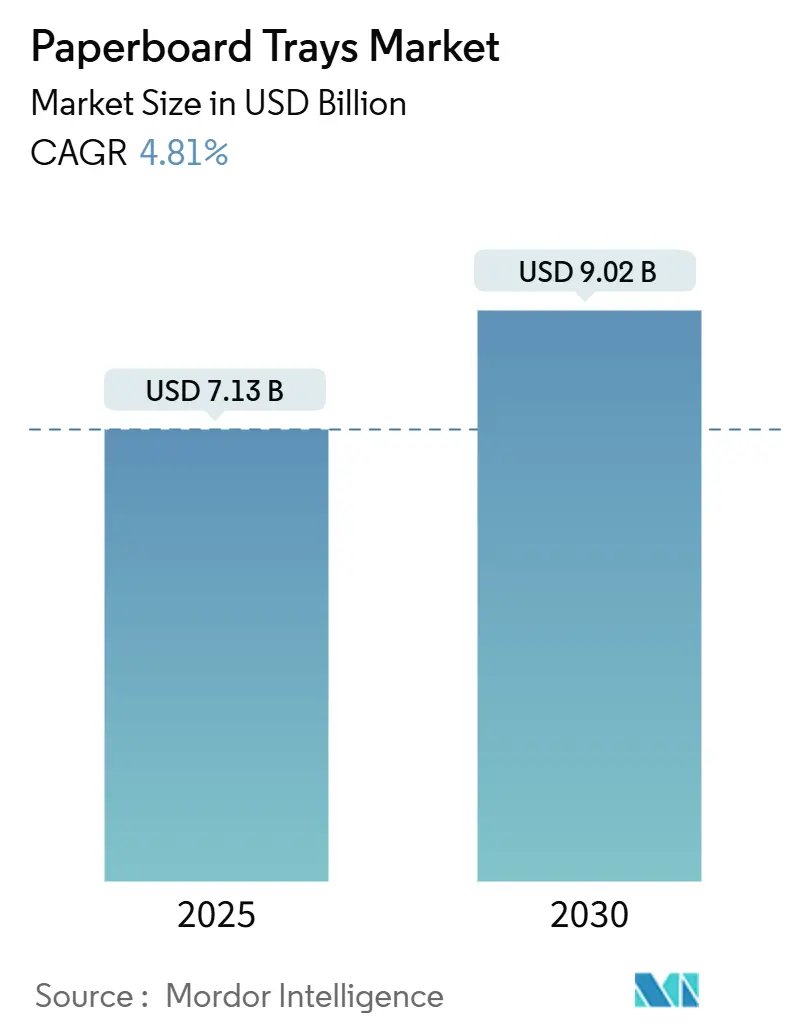
| Market Size (2025) | USD 7.13 Billion |
| Market Size (2030) | USD 9.02 Billion |
| Growth Rate (2025 - 2030) | 4.81% CAGR |
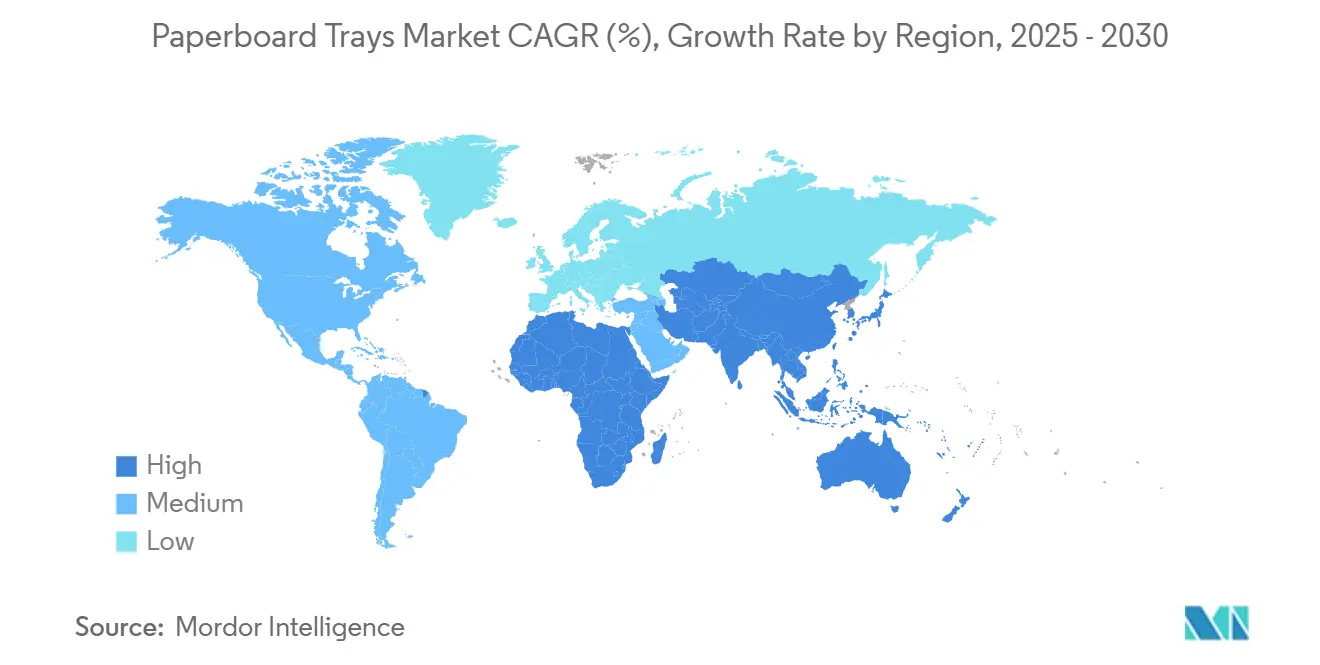
| Fastest Growing Market | Asia Pacific |
| Largest Market | Asia Pacific |
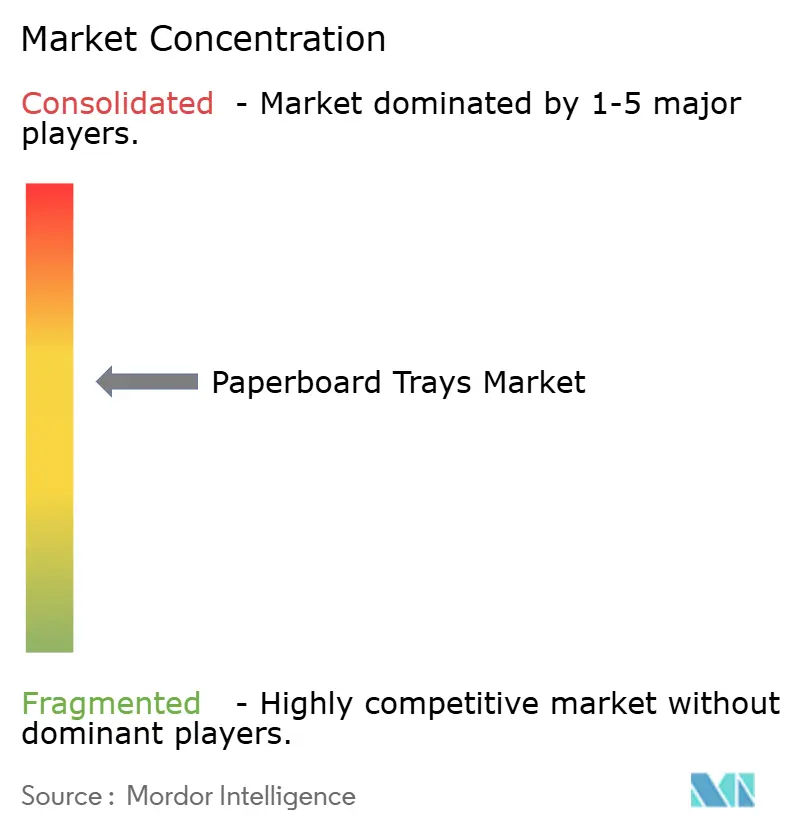
| Market Concentration | Medium |
Major Players *Disclaimer: Major Players sorted in no particular order Image © Mordor Intelligence. Reuse requires attribution under CC BY 4.0. | |
Paperboard Trays Market Analysis by Mordor Intelligence
The paperboard trays market size stands at USD 7.13 billion in 2025 and is forecast to reach USD 9.02 billion by 2030, advancing at a 4.81% CAGR. Demand is rising because regulators now require all retail packaging to be recyclable, and brand owners are moving away from plastic toward fiber-based formats that satisfy those rules. The European Union’s Regulation (EU) 2025/40 alone is steering millions of tonnes of packaging toward paperboard by 2030. Parallel proposals in Australia target 75% post-consumer recycled content for fiber packs by 2040, anchoring long-term volume visibility. Adoption also accelerates because high-pressure processing (HPP) and modified-atmosphere-packaged (MAP) meals now specify trays that combine print quality with barrier integrity, attributes that current fiber substrates can deliver. E-commerce grocery flows and meal-kit programs add further pull by valuing stackability, crush resistance, and branded unboxing, all intrinsic to paperboard trays market growth.
Key Report Takeaways
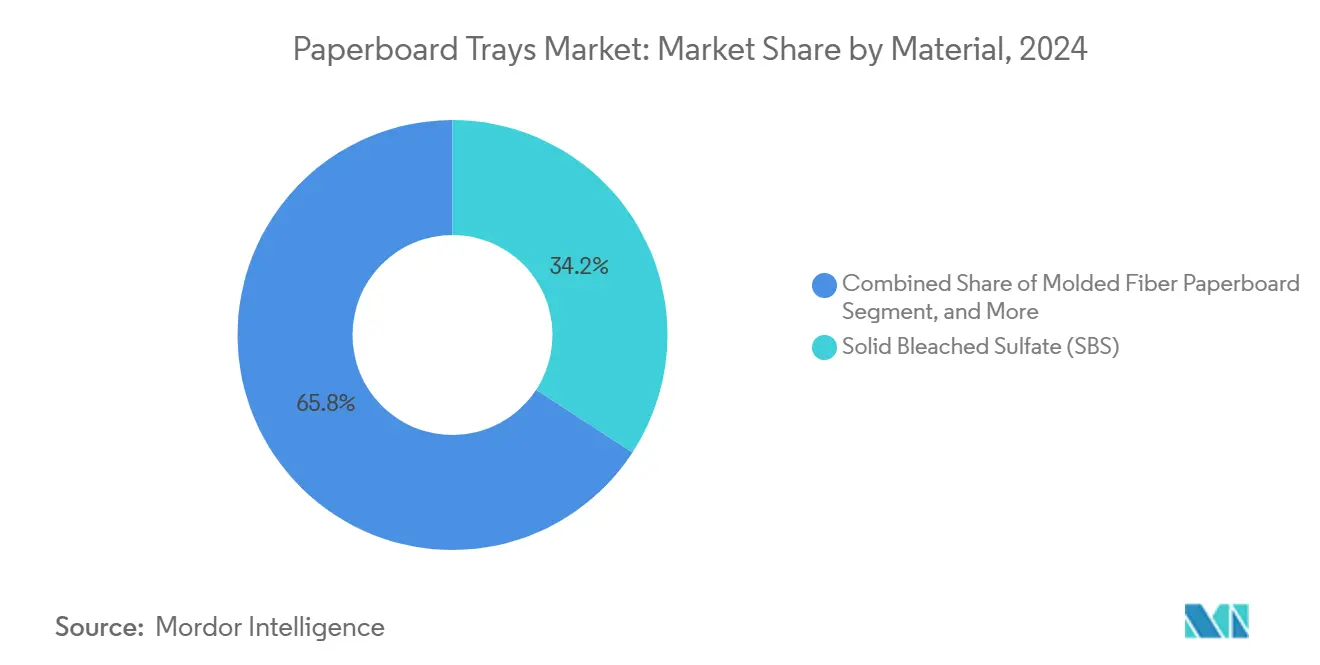
- By material, solid bleached sulfate captured 34.21% of the paperboard trays market share in 2024.
- By tray type, the paperboard trays market size for the modified atmosphere packaging trays is projected to grow at a 6.04% CAGR between 2025-2030.
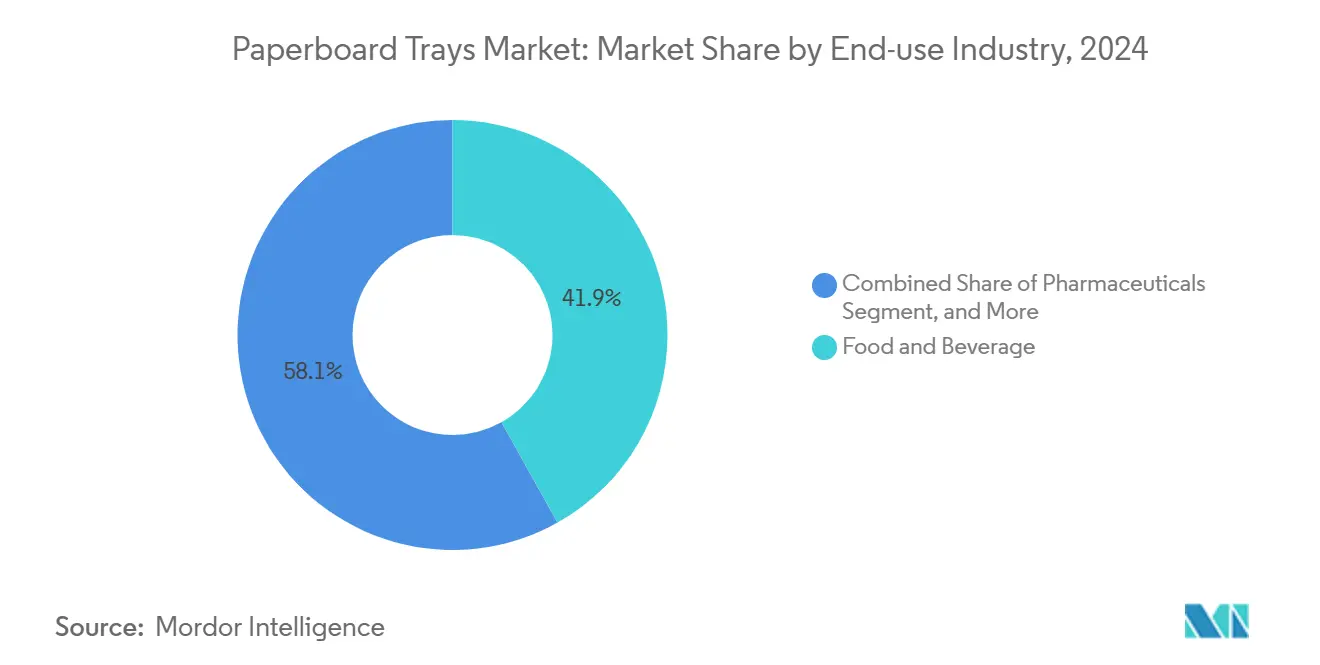
- By end-use industry, food and beverage captured 41.87% of the paperboard trays market share in 2024.
- By geography, the paperboard trays market size for the Asia-Pacific region is projected to grow at a 7.12% CAGR between 2025-2030.
Global Paperboard Trays Market Trends and Insights
Drivers Impact Analysis*
| Driver | (~) % Impact on CAGR Forecast | Geographic Relevance | Impact Timeline |
|---|---|---|---|
| Stringent single-use plastic bans | +1.2% | Global (EU, North America lead) | Short term (≤ 2 years) |
| Rising demand for ready-to-eat & microwaveable meals | +0.8% | Global urban markets | Medium term (2-4 years) |
| Growth of e-commerce grocery & meal-kits | +0.6% | North America & EU, APAC emerging | Medium term (2-4 years) |
| Innovations in bio-based barrier coatings | +0.5% | Global (R&D in North America & EU) | Long term (≥ 4 years) |
| Shift to HPP-compatible paperboard MAP trays | +0.4% | North America & EU, APAC premium | Long term (≥ 4 years) |
| Digital printing for tray customization | +0.3% | Global, early uptake in North America & EU | Medium term (2-4 years) |
| Source: Mordor Intelligence | |||
Stringent Single-Use Plastic Bans
Regulators across the European Union, Australia, and several U.S. states have removed gradual timelines and instead issued firm bans on selected plastics beginning in 2026.[1]New Zealand Ministry of Foreign Affairs and Trade, “New EU Rules on Packaging and Waste,” mfat.govt.nz Brands that formerly hedged between rPET and polypropylene are committing to fiber solutions because infrastructure for curbside recovery already exists. Retailers also prefer one-material formats to cut sorting fees under extended-producer-responsibility (EPR) laws. The result is a surge in substitution projects that place the paperboard trays market at the center of compliance spending. Paperboard processors are responding with faster certification cycles to validate food-contact safety ahead of the 2026 PFAS ban. Brand managers now benchmark tray performance on recyclability first and graphics second, reversing the decade-old plastic advantage in moisture barrier metrics.
Rising Demand for Ready-to-Eat and Microwaveable Meals
Urban consumers continue trading cook-from-scratch habits for heat-and-eat convenience. Microwave ovens penetrate nearly 93% of North American homes and above 70% in urban Asia, pulling meal producers toward formats that survive repeated thermal shocks. Paperboard retains dimensional stability during 1,000-watt heating cycles, preventing lid delamination that plagues thin-wall polypropylene. Visual appeal rises because high-opacity SBS enables photo-quality printing, and die-cut windows showcase food while meeting shelf-life rules. Premium grocery chains now specify fiber trays for seafood gratins and ethnic entrees in Europe, signaling category migration previously limited to chilled pizzas. The momentum supports volume contracts that underpin new barrier-coated board capacity across Scandinavia.
Growth of E-commerce Grocery and Meal-Kits
Home delivery exposes packs to six or more handling touchpoints, from dark-store picking to parcel locker drop-off. Trays built from 400-gsm folding boxboard tolerate compression and resist puncture better than peer plastics, lowering complaint rates for meal-kit firms. Branding is printed directly on the tray interior, saving labels and securing QR codes for recipe videos. Farm Credit East projects U.S. paper and board demand to hit 49.5 million tons by 2028, lifted mainly by e-commerce flows. The paperboard trays market, therefore, captures logistics spending that previously went to corrugated inserts.
Innovations in Bio-based Barrier Coatings
Academic and corporate laboratories have closed the historical water-vapor gap between plastic and fiber by grafting biopolymers such as boric-acid-cross-linked PVA onto board surfaces. Commercial trials show oxygen transmission rates below 1 cc/m²-day at 23 °C and 50% RH, thresholds once reachable only with EVOH layers. These coatings pass marine biodegradability, sidestepping future micro-plastic scrutiny. Suppliers target snack bars and dairy lids first, but adoption in trays will follow because the same curtain-coating lines apply to both structures.
Restraints Impact Analysis*
| Restraint | (~) % Impact on CAGR Forecast | Geographic Relevance | Impact Timeline |
|---|---|---|---|
| Volatile virgin-fiber pricing | -0.7% | Global (North America & Europe most exposed) | Short term (≤ 2 years) |
| Heat & moisture resistance limitations vs plastics | -0.5% | Global, hot-fill & high-moisture categories | Medium term (2-4 years) |
| Competition from molded-pulp containers | -0.4% | Global, cost-sensitive segments | Medium term (2-4 years) |
| CAPEX for MAP line retrofits | -0.3% | North America & EU retrofit sites | Long term (≥ 4 years) |
| Source: Mordor Intelligence | |||
Volatile Virgin-Fiber Pricing
Softwood pulp traded 14% higher Y/Y during 2024, forcing board mills to lift boxboard surcharges that lag input spikes by two quarters. Snack brands on annual contracts demanded index-linked clauses or threatened a return to PET trays. Although mixed-paper feedstock is abundant, food-grade recycled fiber remains scarce, perpetuating price swings that compress converter margins in the short term.
Heat and Moisture Resistance Limitations vs Plastics
Hot-fill sauces at 90 °C still require polypropylene or retortable pouches because even advanced wax-coated board loses tensile strength above 85 °C. Studies show a 30% drop in edge-crush values under combined heat-humidity stress. Research into microcrystalline wax emulsions lowered vapor transmission, yet industrial adoption is slow because the emulsion adds two process steps and raises tray cost by 6%.
*Our forecasts treat driver/restraint impacts as directional, not additive. The impact forecasts reflect baseline growth, mix effects, and variable interactions.
Segment Analysis
By Material: SBS Dominance Challenged by Sustainability Push
Solid Bleached Sulfate holds the largest slice of the paperboard trays market share at 34.21% in 2024, underpinned by its bright, odor-neutral surface that enables photorealistic branding. Brands targeting premium freezer meals favor SBS because the board’s virgin fibers deliver uniform caliper and seal through light frost. Nevertheless, cost and fiber intensity expose SBS users to ESG scrutiny. Converters now co-extrude thin layers of SBS over recycled middle plies, cutting virgin input by up to 40% without sacrificing print quality. Molded Fiber Paperboard, projected at 6.87% CAGR, fits circular-economy targets and benefits from province-level subsidies in China that reward ≥50% recycled content lines. The dual material trajectory keeps the broader paperboard trays market on a balanced path between performance and sustainability imperatives.
Metsä Board’s expansion in Sweden underscores investor confidence; added capacity is dedicated to lightweight FBB that pairs with water-based dispersion coatings.[2]Metsä Group, “Investments Update 2024,” metsagroup.com Recycled-board innovations rely on nano-cellulose lamination, delivering tear strength once exclusive to kraft liners. As these hybrids mature, the paperboard trays industry gains optionality to meet both unit cost and curbside recycling goals, curtailing plastic comeback narratives.


By Tray Type: MAP Technology Drives Premium Segment Growth
Standard flat formats still represent 43.73% of the paperboard trays market size because they maximize dieline efficiency and run at 400 units/min on legacy forming equipment. Mass-market bakery and produce SKUs prefer flat trays for shelf staging and pallet density. Yet modified-atmosphere trays, expanding at a 6.04% CAGR, harvest incremental value by extending shelf life on antibiotic-free meats from 10 to 20 days, allowing retailers to optimize markdown cycles. MAP versions leverage high-barrier lacquer coats and multilayer lids to maintain ≤2% O₂, attributes validated under ISO 22000 audits.
Clamshell and compartmentalized structures capture niche health-meal and airline-catering channels. Digital printing synergy favors flat surfaces, so future share may tilt back toward redesigns that support on-tray personalization. Tray-type diversity lets the paperboard trays market serve both price-led mass channels and function-led premium niches.
By End-use Industry: Food Dominance with Pharmaceutical Expansion
Food and Beverage contributes 41.87% of the paperboard trays market size and grows at 5.09% CAGR, propelled by supermarket deli, premium produce, and ready-meal aisles. Meat, poultry, and seafood SKUs particularly rely on the tray’s stiffness for leak prevention under ice. Fresh-cut fruit suppliers in Singapore converted to fiber trays after the city-state’s national plastics tax was announced. Pharmaceuticals adopt blister-tray hybrids to secure cold-chain biologics; stability studies show fiber trays retain dimensional accuracy at –20 °C, where PET may embrittle.
Personal care brands apply metallized liners that mimic foil while keeping the outer pack recyclable, reinforcing premium cues for solid fragrances. Industrial ‘other’ uses, such as electronics, provide base loads during seasonal food slowdowns, balancing plant utilization throughout the year.
By Coating Type: Wax Coatings Gain Traction in Sustainable Applications
Polyethylene coatings still dominate at 33.46% because they provide cost-effective grease resistance and run on mature extrusion coaters. Yet PFAS scrutiny and consumer distrust of poly films accelerate the shift toward wax-coated alternatives growing at 4.93% CAGR. Microcrystalline wax emulsions applied at 7 g/m² seal fibers, enabling 10/12 kit ratings and moisture vapor transmission rates suitable for bakery. PLA-coated offerings find favor with compostable-logo seekers, though heat-seal windows remain narrow.
Early-stage trials with shellac-based dispersions and chitosan blends could dethrone both PE and wax, especially once EU legislation tightens migration limits. The coating evolution is integral to sustaining the competitive relevance of the paperboard trays market against retort-grade plastics.
Geography Analysis
Asia-Pacific dominates revenue with a 47.05% share and leads growth at a 7.12% CAGR, driven by China’s scale and India’s FMCG trajectory, where domestic board demand rises 6–8% annually. Local converters enjoy labor-cost advantages and proximity to export-oriented producing hubs, letting them feed seafood tray demand in Japan while supplying rice-bowl formats in Korea. Government mandates that 30% of urban solid waste be recyclable by 2030 in China, reinforcing the fiber tray outlook.
North America accounts for roughly one-quarter of global consumption. U.S. meal-kit subscriptions topped 38 million in 2024, each box averaging four trays, pumping predictable tonnage through Midwest folding-carton plants. Canada’s province-by-province EPR rules further embed recyclability needs, amplifying the paperboard trays market thrust. Local pulp supply and integrated mill-to-converter chains insulate operators from trans-Pacific freight volatility.
Europe, though smaller in tonnage, punches above its weight as a regulatory bellwether. Regulation (EU) 2025/40 enforces traceability coding on every pack, and fiber solutions are better suited for digital watermarking than clear plastics. Nordic mills exporting dispersion-coated board secure premium margins as continental brand owners race to meet looming PFAS bans. South America and the Middle East & Africa emerge slowly; infrastructure gaps and currency swings limit high-margin tray adoption, yet urban grocery formats in São Paulo and Riyadh indicate latent upside once cold-chain penetration rises.

Competitive Landscape
The sector remains moderately concentrated: the top five producers control an estimated 56% of global volume, sufficient to negotiate wood and energy contracts yet low enough to spur regional challengers. Smurfit WestRock’s merger exemplifies scale pursuit, posting USD 7.5 billion Q4 2024 sales and achieving USD 450 million run-rate synergies in freight rationalization.[3]Smurfit WestRock, “Investor Overview,” investors.smurfitwestrock.com Graphic Packaging secured USD 8.807 billion in 2024 revenue, leveraging Bell Incorporated’s clamshell know-how to target QSR meal-bundle trays.
Innovation differentiates winners. Smurfit WestRock pilot-launched a boric-acid PVA coating line in Texas that cuts PE layer weight by 60%, while Mondi’s TrayWrap swaps shrink film for kraft paper lashing on multipacks, opening adjacency revenue. Huhtamaki hedged with molded-fiber expansion, reducing risk if price-first customer migration accelerates. Smaller specialists carve defensible niches in pharmaceutical trays with ISO-class cleanrooms or in artisanal food brands seeking low-volume, fast-art inkjet runs.
Private-equity interest re-entered in 2024 as sustainability-linked loans favored fiber assets over fossil-based plastics. Deal multiples averaged 9.4× EBITDA, a premium justified by ESG scoring that feeds into retailer supplier rankings. Competitive pressure now revolves less around tonnage pricing and more around cradle-to-recycling traceability and digital printing agility capabilities that widen the moat for early movers in the paperboard trays market.
Paperboard Trays Industry Leaders
Graphic Packaging Holding Company
Huhtamaki Oyj
Smurfit WestRock PLC
International Paper Company
Mondi PLC
- *Disclaimer: Major Players sorted in no particular order

Recent Industry Developments
- February 2025: Smurfit WestRock posted Q4 2024 net sales of USD 7.5 billion, confirming merger synergy capture across North America and Europe.
- February 2025: Graphic Packaging reported USD 8.807 billion 2024 net sales and flagged Bell Incorporated integration benefits.
- December 2024: The EU finalized Regulation (EU) 2025/40 mandating recyclability for all packaging by 2030 and banning PFAS in food-contact packs from 2026.
- October 2024: Australia unveiled an EPR framework requiring 75% post-consumer recycled content in paperboard by 2040.


Global Paperboard Trays Market Report Scope
| Coated Unbleached Kraft (CUK) |
| Solid Bleached Sulfate (SBS) |
| Recycled Board |
| Molded Fiber Paperboard |
| Standard Flat Tray |
| Lidded / Clamshell Tray |
| Modified Atmosphere Packaging (MAP) Tray |
| Compartmentalized Tray |
| Food and Beverage | Fresh Produce |
| Meat, Poultry, and Seafood | |
| Dairy Products | |
| Ready-to-Eat Meals | |
| Other Food and Beverage Products | |
| Personal Care and Cosmetics | |
| Pharmaceuticals | |
| Industrial and Other End-use Industries |
| Polyethylene (PE) Coated |
| Polylactic Acid (PLA) Coated |
| Wax Coated |
| Non-coated |
| North America | United States | |
| Canada | ||
| Mexico | ||
| South America | Brazil | |
| Argentina | ||
| Rest of South America | ||
| Europe | Germany | |
| United Kingdom | ||
| France | ||
| Italy | ||
| Spain | ||
| Russia | ||
| Rest of Europe | ||
| Asia-Pacific | China | |
| Japan | ||
| India | ||
| South Korea | ||
| Malaysia | ||
| Australia | ||
| Rest of Asia-Pacific | ||
| Middle East and Africa | Middle East | Saudi Arabia |
| United Arab Emirates | ||
| Rest of Middle East | ||
| Africa | South Africa | |
| Egypt | ||
| Rest of Africa | ||
| By Material | Coated Unbleached Kraft (CUK) | ||
| Solid Bleached Sulfate (SBS) | |||
| Recycled Board | |||
| Molded Fiber Paperboard | |||
| By Tray Type | Standard Flat Tray | ||
| Lidded / Clamshell Tray | |||
| Modified Atmosphere Packaging (MAP) Tray | |||
| Compartmentalized Tray | |||
| By End-use Industry | Food and Beverage | Fresh Produce | |
| Meat, Poultry, and Seafood | |||
| Dairy Products | |||
| Ready-to-Eat Meals | |||
| Other Food and Beverage Products | |||
| Personal Care and Cosmetics | |||
| Pharmaceuticals | |||
| Industrial and Other End-use Industries | |||
| By Coating Type | Polyethylene (PE) Coated | ||
| Polylactic Acid (PLA) Coated | |||
| Wax Coated | |||
| Non-coated | |||
| By Geography | North America | United States | |
| Canada | |||
| Mexico | |||
| South America | Brazil | ||
| Argentina | |||
| Rest of South America | |||
| Europe | Germany | ||
| United Kingdom | |||
| France | |||
| Italy | |||
| Spain | |||
| Russia | |||
| Rest of Europe | |||
| Asia-Pacific | China | ||
| Japan | |||
| India | |||
| South Korea | |||
| Malaysia | |||
| Australia | |||
| Rest of Asia-Pacific | |||
| Middle East and Africa | Middle East | Saudi Arabia | |
| United Arab Emirates | |||
| Rest of Middle East | |||
| Africa | South Africa | ||
| Egypt | |||
| Rest of Africa | |||


Key Questions Answered in the Report
How big is the paperboard trays market in 2025?
The paperboard trays market size is USD 7.13 billion in 2025.
What is the expected CAGR for paperboard trays between 2025 and 2030?
The market is projected to grow at a 4.81% CAGR over the period.
Which region leads demand for paperboard trays?
Asia-Pacific holds the largest share at 47.05% and is the fastest-growing region.
Why are MAP trays gaining traction?
MAP trays extend food shelf life, meeting retailer logistics goals and reducing food waste.
What drives the switch from plastic to fiber trays?
Tight single-use-plastic bans and consumer preference for recyclable packaging push adoption.
Page last updated on:


