Cupstock Paperboard Market Size and Share
Market Overview
| Study Period | 2019 - 2030 |
|---|---|
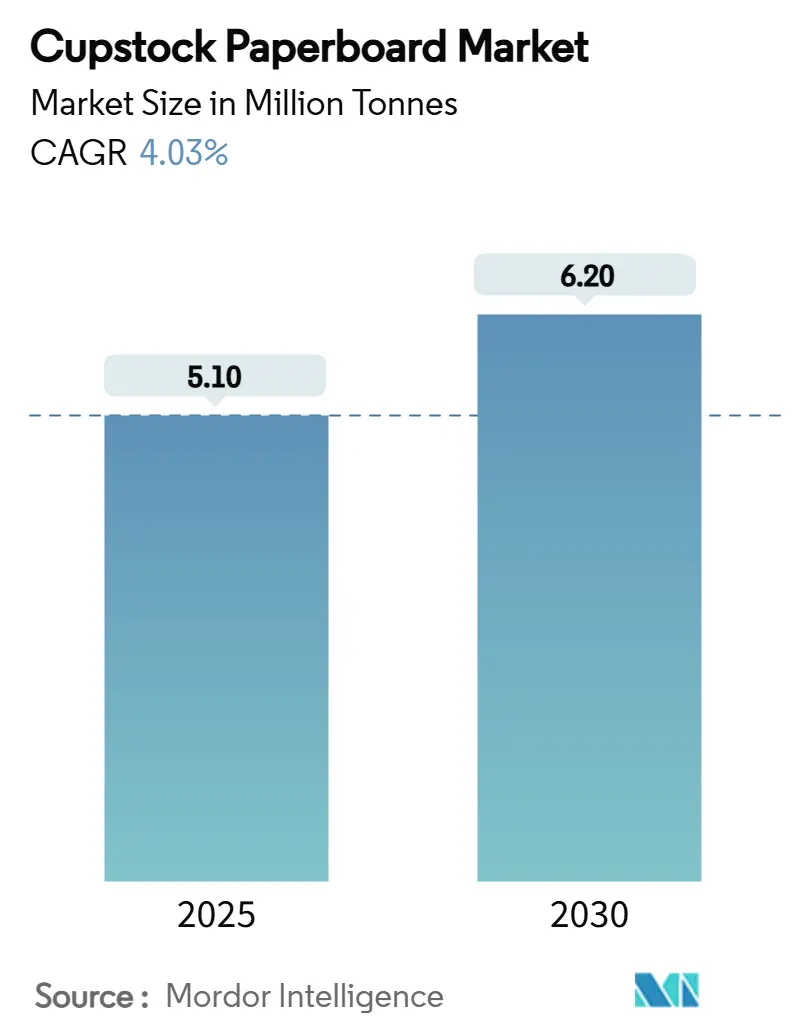
| Market Volume (2025) | 5.10 Million tonnes |
| Market Volume (2030) | 6.20 Million tonnes |
| Growth Rate (2025 - 2030) | 4.03% CAGR |
| Fastest Growing Market | Asia Pacific |
| Largest Market | Asia Pacific |
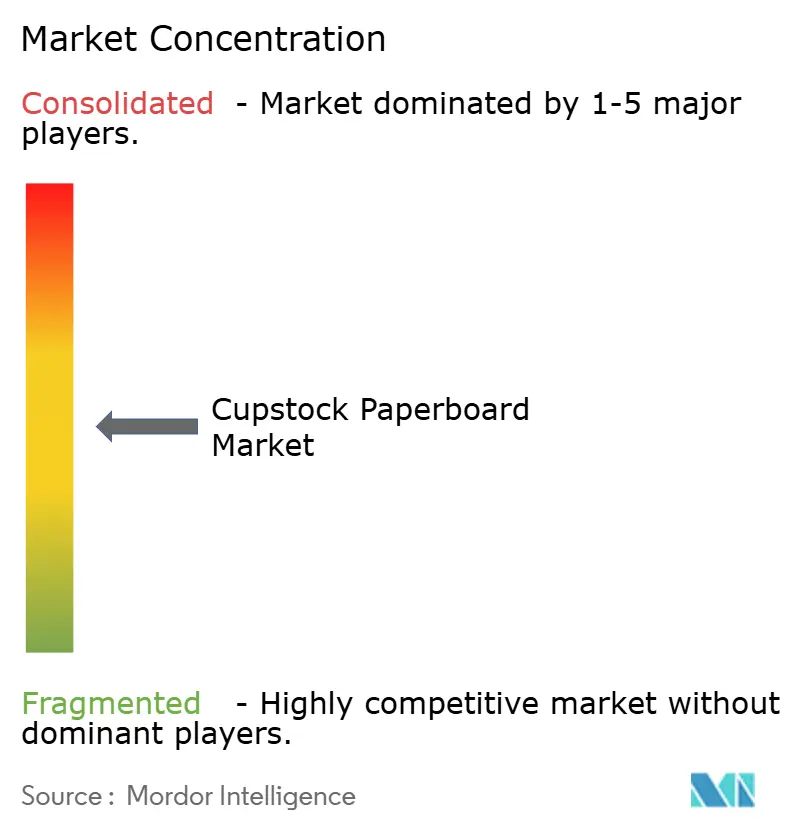
| Market Concentration | Medium |
Major Players *Disclaimer: Major Players sorted in no particular order Image © Mordor Intelligence. Reuse requires attribution under CC BY 4.0. | |
Cupstock Paperboard Market Analysis by Mordor Intelligence
The cupstock paperboard market size stands at 5.1 million tonnes in 2025 and is projected to reach 6.2 million tonnes by 2030, reflecting a CAGR of 4.03%. Continued adoption of fiber-based packaging in quick-service restaurants, stricter rules on single-use plastics, and incremental advances in PFAS-free barrier chemistry push demand higher.[1]SGS Editorial Team, “EU Issues New Legislation for Packaging and Packaging Waste,” SGS, sgs.com Producers are investing in larger, more efficient machines that reduce grammage while preserving stiffness, making the cupstock paperboard market more cost-competitive against PET and PP cups. Consolidation among major integrated players is reshaping global supply, yet mid-tier mills with niche coating capabilities remain relevant where regional brands require short lead times. Technology collaboration across the coating value chain shortens qualification cycles for aqueous dispersion linings, speeding market penetration. Raw-material cost swings tied to virgin fiber supply remain the principal near-term risk, but integrated forestry groups partly cushion volatility through captive plantations.
Key Report Takeaways
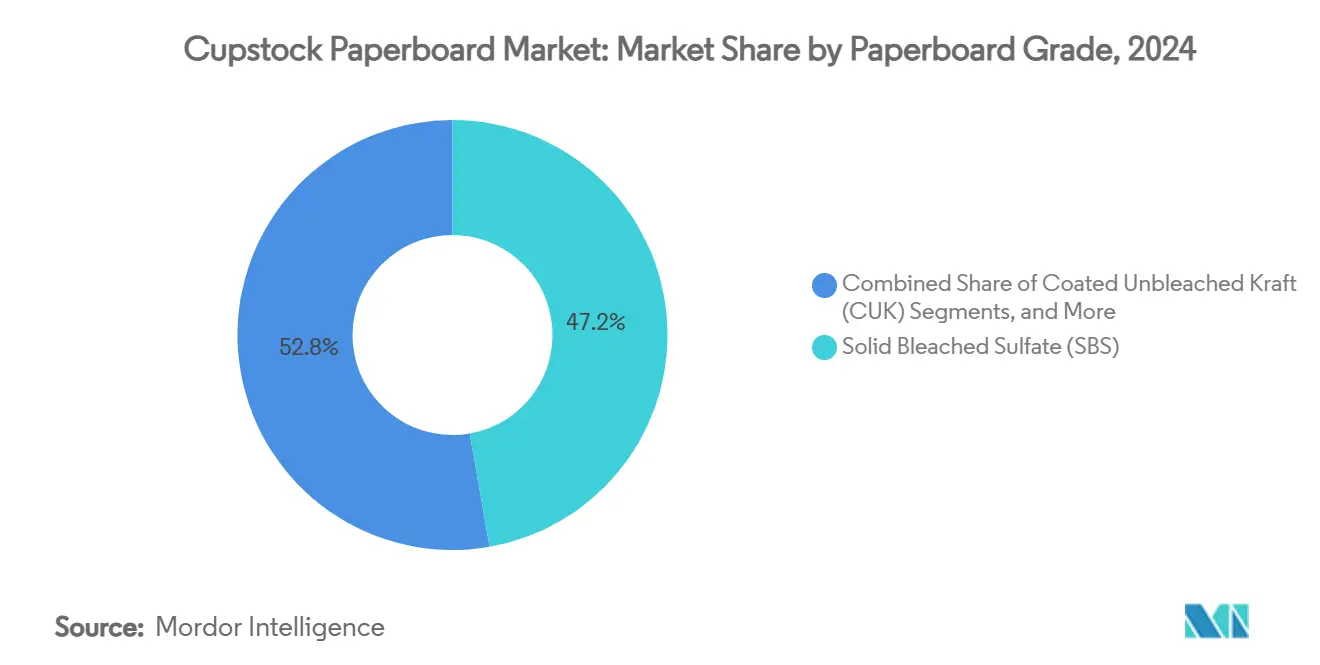
- By paperboard grade, solid bleached sulfate captured 47.24% share of the cupstock paperboard market in 2024.
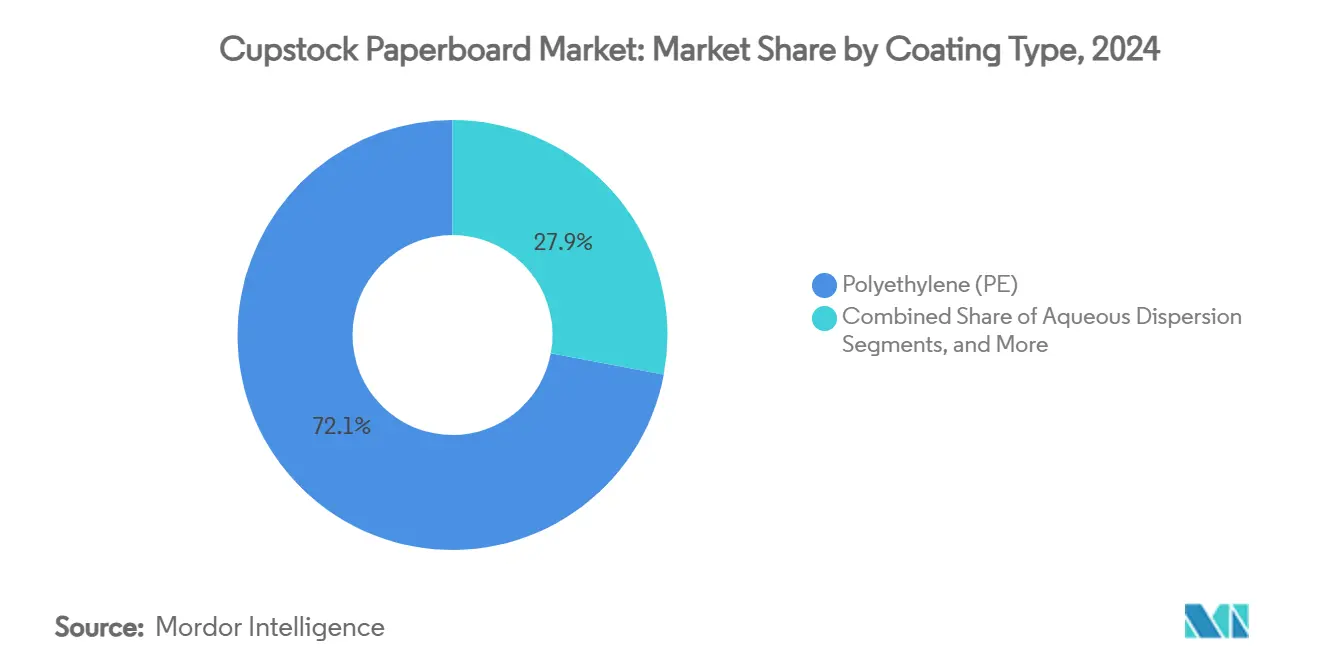
- By coating type, the cupstock paperboard market for the aqueous dispersion coatings segment is projected to grow at a 7.03% CAGR between 2025-2030.
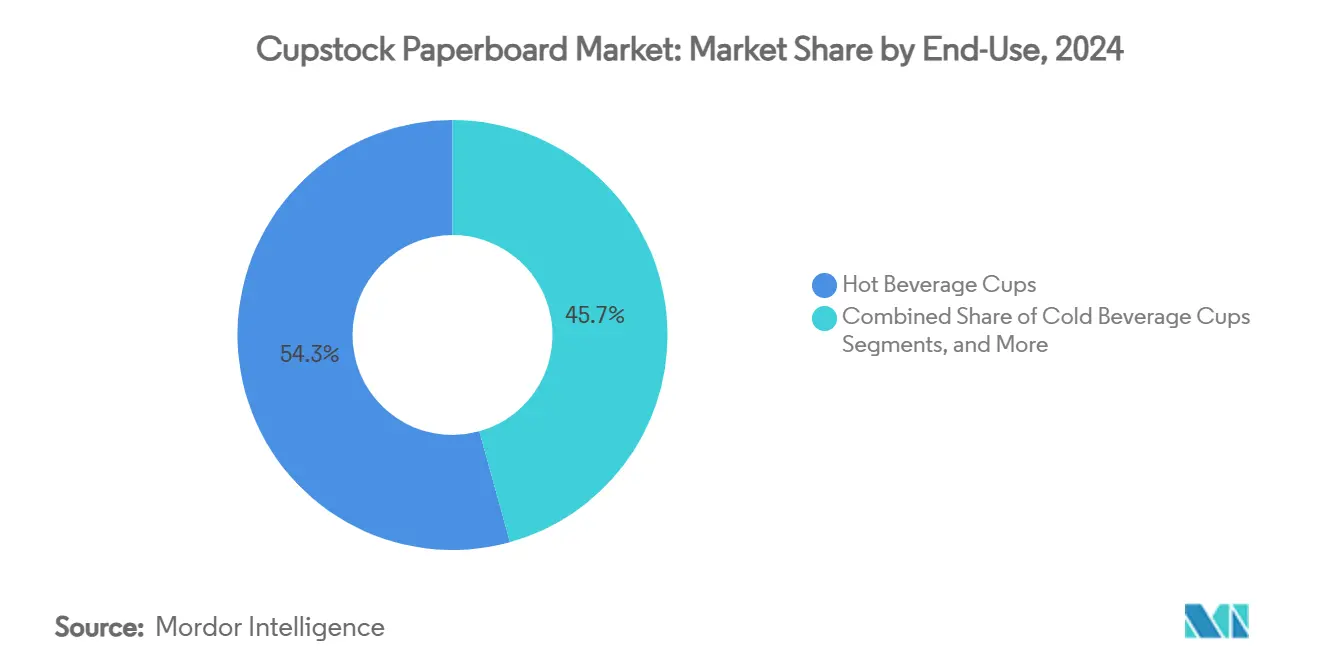
- By end-use, hot beverage cups captured a 54.31% share of the cupstock paperboard market in 2024.
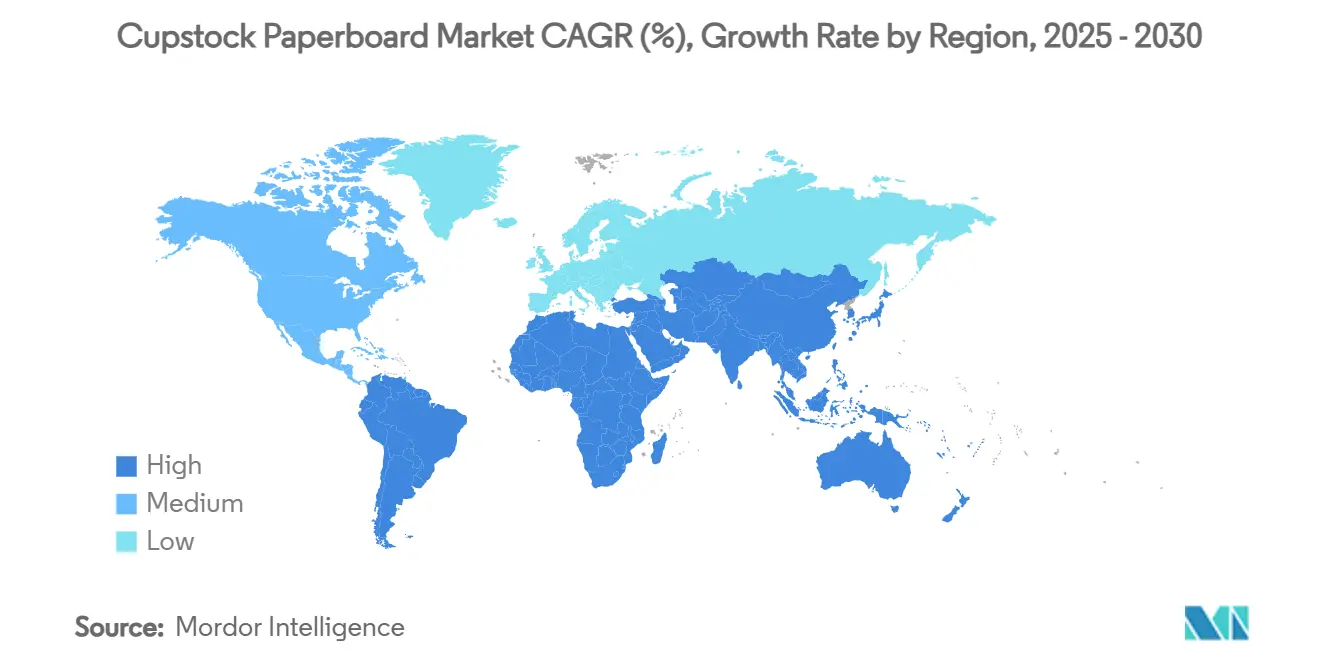
- By geography, the cupstock paperboard market for the Asia-Pacific region is projected to grow at a 6.21% CAGR between 2025-2030.
Global Cupstock Paperboard Market Trends and Insights
Drivers Impact Analysis*
| Driver | % Impact on CAGR Forecast | Geographic Relevance | Impact Timeline |
|---|---|---|---|
| Plastic-to-paper shift driven by single-use-plastic bans | +1.2% | Global, with EU and APAC leading implementation | Medium term (2-4 years) |
| On-the-go beverage growth via QSR and cafe chains | +0.8% | APAC core, spill-over to North America and Europe | Short term (≤ 2 years) |
| Rapid adoption of aqueous and PLA barrier coatings | +0.6% | North America and EU, expanding to APAC | Medium term (2-4 years) |
| Micro-fibrillated cellulose (MFC) heat-resistant coatings | +0.4% | Europe and North America | Long term (≥ 4 years) |
| Lightweight high-strength SBS/FBB for lower carbon intensity | +0.3% | Global | Medium term (2-4 years) |
| Scope-3-oriented FSC/PEFC traceability mandates | +0.2% | Global, with strongest enforcement in EU | Long term (≥ 4 years) |
| Source: Mordor Intelligence | |||
Plastic-to-paper shift driven by single-use-plastic bans
New rules, such as the European Union Packaging and Packaging Waste Regulation, which became effective in February 2025, obligate brand owners to employ recyclable materials and restrict PFAS to 25 ppb. The mandate removes regulatory arbitrage between markets because an identical cup now must meet the strictest global standard. Large food-service chains have issued supplier codes aligned with the legislation, locking in volume once coating qualification is complete. Early movers are able to demonstrate closed-loop fiber recovery gain, listing priority, and longer contracts. Markets without formal bans import finished cups that comply with EU norms, transferring demand pull to exporting mills. Compliance costs for late adopters rise as existing PE coating assets need rebuilds or replacement.
On-the-go beverage growth via QSR and cafe chains
Urbanization, dual-income households, and rising discretionary spending in China, India, and Indonesia drive higher footfall in quick-service restaurants and specialty cafés. Portfolio expansion beyond traditional hot coffee to cold brew, bubble tea, and flavored milk increases the average number of cup formats per store. Global QSR franchisors harmonize specifications across regions, concentrating orders with mills that can ship pre-printed blanks at scale. Asian regional converters expand lamination and die-cutting capacity near population centers to shorten replenishment cycles. The resulting throughput provides mill utilization that offsets pressure from promotions and price discounts. Cold-drink menu additions with higher fill volumes elevate the grams-per-cup requirement despite lightweighting trends, further benefitting the cupstock paperboard market.
Rapid adoption of aqueous and PLA barrier coatings
Aqueous dispersion coatings migrate from pilot to commercial grades as suppliers demonstrate grease- and water-resistance near PE benchmarks while allowing fiber recovery in standard mills. Production learning curves have cut cost premiums below 8% on a total cost-in-use basis. PLA linings, offered mostly in North America, achieve stronger heat-seal windows for vending cups, and converters use blended runs to de-risk supply. Brand owners publicize the move away from fluorinated chemicals in environmental reports, using on-pack logos to attract sustainability-minded consumers. Mills that retrofit rod-coater stations to handle water-based formulations report smoother machine performance and lower downtime than initial trials suggested.
Micro-fibrillated cellulose (MFC) heat-resistant coatings
MFC suspensions dispersed with starch create a dense, renewable barrier that maintains integrity up to 150 °C, meeting performance needs for premium espresso service. Production economics depend on on-site MFC generation where excess pulp is available, a model already adopted by Scandinavian mills. The technology’s oxygen barrier properties open opportunities in ready-to-drink soup cups, expanding addressable volume. Early adopters can lock in patent-backed supply agreements, discouraging entry by smaller rivals. Equipment makers report order backlogs for coaters capable of handling high-viscosity MFC, implying a multi-year lead for pioneers. The innovation also reduces plastic content to near zero, aiding corporate net-zero roadmaps.
Restraints Impact Analysis*
| Restraint | % Impact on CAGR Forecast | Geographic Relevance | Impact Timeline |
|---|---|---|---|
| Virgin-fiber cost volatility and supply disruptions | -0.7% | Global, with acute impact in regions dependent on imports | Short term (≤ 2 years) |
| Limited recycling infrastructure for poly-lined cups | -0.5% | North America and developing markets | Medium term (2-4 years) |
| PFAS phase-out raising barrier-chemistry costs | -0.4% | EU and North America | Medium term (2-4 years) |
| Competition from molded-fiber and bioplastic cup formats | -0.3% | Global, with stronger impact in premium segments | Long term (≥ 4 years) |
| Source: Mordor Intelligence | |||
Virgin-fiber cost volatility and supply disruptions
Wood denotes 40-60% of total cupstock production cost, making exchange-rate swings and weather-driven harvest setbacks a direct threat to mill margins. Stora Enso’s Q1 2025 update cited elevated Nordic round-wood prices that offset board price hikes.[2]Stora Enso Investor Relations, “Interim Report January–March 2025,” Stora Enso, storaenso.com Import-dependent converters in South Asia pay premiums when regional container shortages extend delivery cycles. Integrated players hedge risk through long-term stumpage contracts and debottlenecking in-house sawmills. Smaller mills without such buffers may idle capacity during price spikes, lowering overall supply and raising free-market prices further.
Limited recycling infrastructure for poly-lined cups
Only a handful of municipal facilities separate PE coatings from fiber, resulting in material being diverted to energy recovery streams instead of re-pulping. Brand reputation suffers when media highlight low recycling rates, prompting beverage chains to test alternative materials. Investment in cup-specific separation plants faces payback hurdles because feedstock volumes remain scattered. State governments in the United States are piloting extended producer responsibility (EPR) fees to fund upgrades, but timelines stretch beyond 2027. Until systems scale, PE-lined products risk exclusion from “recyclable” labeling, reducing appeal in sustainability-led tenders.
*Our forecasts treat driver/restraint impacts as directional, not additive. The impact forecasts reflect baseline growth, mix effects, and variable interactions.
Segment Analysis
By Paperboard Grade: SBS Dominance Faces CUK Challenge
SBS generated 47.24% of 2024 demand, retaining leadership on the strength of superior brightness and odor neutrality that satisfy premium coffee shop specs. The cupstock paperboard market size for SBS equaled 2.4 million tonnes in 2024 and will post moderate growth as brands accept price premiums for flawless print. Coated Unbleached Kraft, at 5.74% CAGR through 2030, is catching up as surface improvements allow vibrant branding with lower fiber intensity. CUK’s clay-coated surface now rivals SBS in ink hold-out, and its natural-brown reverse side feeds eco-aesthetic branding. Recycled white-lined chipboard serves discount venues but remains constrained to cold applications because of odor limitations.
Capacity additions underline the pivot. Stora Enso’s Oulu line will supply 1.2 million tonnes of CUK once ramp-up concludes in 2027, ensuring scale economies that close cost gaps relative to SBS. Mills in Brazil and India are also commissioning CUK machines integrated with in-line aqueous coaters, signalling broader geographic uptake. While SBS continues to command price leadership, dual sourcing policies mean converters increasingly allocate high-run SKUs to CUK, reserving SBS only for hero products. The ensuing substitution supports the medium-term uplift predicted for the cupstock paperboard market.


By Coating Type: PE Retreat Accelerates Aqueous Adoption
Polyethylene linings held 72.06% share of the cupstock paperboard market in 2024, equivalent to 3.7 million tonnes. Regulatory crackdowns and rising landfill fees spur a predicted 240-basis-point share loss by 2030. The cupstock paperboard market size for aqueous dispersion-lined boards is forecast to reach 1.2 million tonnes by 2030, powered by 7.03% CAGR. Dispersion products exhibit fibre yield above 90% in standard recycling plants, meeting the recyclability benchmarks embedded in the EU PPWR. PLA coatings, although more expensive, show promise where hot-fill temperatures exceed 90 °C. Bio-based polymer-free coatings, applied via extrusion of starch compounds, address niche zero-plastic brand pledges but require careful humidity control in logistics.
PE’s retreat is hastened by converters phasing out dedicated tandem extruders that cannot process water-based alternatives without major rebuilds. Capital planning now favours universal coaters capable of quick change-overs between PE, dispersion, and PLA. Coating suppliers are embedding on-site technical teams at mills to fine-tune formulations, smoothing the transition. Cost parity with PE is expected early in the next decade once dispersion binder volumes exceed critical thresholds, marking a structural milestone in the cupstock paperboard market evolution.
By End-Use: Cold Beverages Drive Growth Innovation
Hot-drink cups accounted for 54.31% of 2024 shipments, supported by entrenched global coffee habits. Cold-drink cups, however, will deliver the fastest incremental volume as iced coffee and bubble-tea chains proliferate, particularly in Southeast Asia. The cupstock paperboard market share for cold applications was 34% in 2024 and could top 38% by 2030. Extended dwell time with acidic liquids obliges superior barrier design, prompting converters to specify double-side dispersion or PLA outer-wraps. Graphic Packaging reported more than USD 200 million in innovation sales tied to cold-drink substrates in 2023, signalling commercial momentum.[3]Graphic Packaging International ESG Team, “2023 ESG Report,” Graphic Packaging, graphicpkg.com
Temperature variation remains the biggest design hurdle. Condensation risk pushes some chains toward two-piece cup-and-sleeve formats, adding paperboard tonnage per serving. Mills collaborate with adhesive suppliers to guarantee sleeve bond strength without compromising recyclability. Growth also comes from functional beverages containing protein or electrolytes, where brand managers seek billboard-quality graphics achievable on SBS. Ice-cream tubs and dairy pots retain steady demand, benefitting from rising single-serve affogato and frozen yoghurt formats in Europe.
Geography Analysis
Asia-Pacific generated 38.62% of the 2024 tonnage, equal to 1.9 million tonnes, and remains the largest cupstock paperboard market. Huge urban clusters lend themselves to efficient cup collection for recycling pilots in Shanghai and Bengaluru. Government measures such as China’s 2025 minimum recycling content quotas accelerate brand switching from plastic. Middle-income consumers embrace café culture, raising per-capita usage rates. Domestic mills expand rapidly; China’s paper and board production hit 121.05 million tonnes in 2021, confirming local fiber availability. India’s first bleached chemi-thermomechanical pulp mill, commissioned by ITC, relieves long-standing dependence on imports. Export-oriented mills in Indonesia use duty-free pulp logs to keep costs low, catering to North Asian buyers during domestic fiber shortages.
North America continues to rank second by volume, anchored by entrenched drive-through habits and widespread soda fountain refills. Dispersion-coated cup trials scaled quickly after California passed EPR legislation in 2024. Cup return schemes at stadiums show promise, though coverage is still patchy. Commodity PE-lined cups remain common in independent cafés, but major chains pledge to complete conversion by 2027, which will shift procurement sharply toward dispersion stock. Fiber costs fluctuate as beetle infestations reduce Canadian spruce harvests, prompting mills to test mixed hardwood recipes that keep tensile strength within spec.
Europe exerts disproportionate influence on specification trends despite contributing less than 18% of 2024 tonnage. The new PPWR dictates global compliance norms. High energy prices during the 2024 winter spurred investment in waste-heat recovery at cup converting plants. Scandinavian countries pilot deposit-refund schemes for paper cups, driving collection rates above 70%. Capacity rationalization following the Smurfit Westrock merger could tighten supply for independent converters, pushing them to source from Eastern European mills that predominantly produce CUK. Southern European coffee culture remains hot-drink oriented, offering a buffer against substitution threats tied to cold-drink dynamics.

Competitive Landscape
The industry is moderately consolidated; the top ten groups account for roughly 55% of worldwide capacity. The Smurfit Kappa-WestRock merger, completed in July 2024, created a USD 21.1 billion packaging leader with 400 million tonnes of annual cupstock output capability and forecast synergies of USD 400 million. The new entity gains unparalleled back-integration into semi-chemical pulp in the Americas, lowering conversion costs and reinforcing bargaining power with food-service chains. Competitors respond with geographic niche strategies, positioning mills close to large café networks to ensure supply resilience.
Stora Enso focuses on technology differentiation; its dry-forming line in Skene uses PulPac to produce fiber-based lids that cannibalize plastic accessories. Graphic Packaging divested the Augusta bleached board mill to Clearwater Paper for USD 700 million, freeing capital for high-barrier coating capacity in the Midwest. Clearwater assumes a clear growth mandate in coated grades, targeting 600,000 tonnes output and USD 150 million EBITDA run-rate by 2026.
Japanese and Korean players, though smaller globally, lead in high-speed digital printing of short-run cup blanks tailored to convenience-store promotions. Brazilian mills leverage forest proximity and low-cost eucalyptus pulp to serve Middle-East buyers facing water scarcity, which constrains local pulp expansion. Competition from molded-fibre start-ups is gaining attention; mill groups partner or acquire to hedge risk. The race to commercialize PFAS-free coatings intensifies collaboration between chemical suppliers and board producers, with joint pilot lines accelerating time-to-market for new formulations.
Cupstock Paperboard Industry Leaders
Smurfit Westrock plc
Graphic Packaging International, LLC
Stora Enso Oyj
Clearwater Paper Corporation
Nippon Paper Industries Co., Ltd.
- *Disclaimer: Major Players sorted in no particular order

Recent Industry Developments
- April 2025: International Paper reported Q1 2025 net sales of USD 5.9 billion, up from USD 4.6 billion a year earlier, reflecting the consolidation of DS Smith assets.
- February 2025: The European Union implemented the Packaging and Packaging Waste Regulation establishing recyclability mandates and PFAS limits.
- February 2025: Stora Enso confirmed a 9% sales rise to EUR 2.362 billion (USD 2.556 billion) and continued ramp-up of the Oulu consumer board line, targeting full capacity by 2027.
- October 2024: Clearwater Paper released its 2024 Sustainability Report after acquiring Graphic Packaging’s Augusta mill for USD 700 million.


Global Cupstock Paperboard Market Report Scope
| Solid Bleached Sulfate (SBS) |
| Coated Unbleached Kraft (CUK) |
| White Lined Chipboard / Recycled |
| Unbleached Kraft Board (UBK) |
| Polyethylene (PE) |
| Polylactic Acid (PLA) |
| Aqueous Dispersion |
| Bio-based Polymer-free |
| Hot Beverage Cups |
| Cold Beverage Cups |
| Ice-cream and Dairy Containers |
| Take-away Meal Bowls and Food Pots |
| Vending and Water-cooler Cones |
| North America | United States | |
| Canada | ||
| Mexico | ||
| South America | Brazil | |
| Argentina | ||
| Rest of South America | ||
| Europe | Germany | |
| United Kingdom | ||
| France | ||
| Italy | ||
| Spain | ||
| Russia | ||
| Rest of Europe | ||
| Asia-Pacific | China | |
| Japan | ||
| India | ||
| South Korea | ||
| Australia | ||
| Rest of Asia-Pacific | ||
| Middle East and Africa | Middle East | Saudi Arabia |
| United Arab Emirates | ||
| Turkey | ||
| Rest of Middle East | ||
| Africa | South Africa | |
| Nigeria | ||
| Rest of Africa | ||
| By Paperboard Grade | Solid Bleached Sulfate (SBS) | ||
| Coated Unbleached Kraft (CUK) | |||
| White Lined Chipboard / Recycled | |||
| Unbleached Kraft Board (UBK) | |||
| By Coating Type | Polyethylene (PE) | ||
| Polylactic Acid (PLA) | |||
| Aqueous Dispersion | |||
| Bio-based Polymer-free | |||
| By End-Use | Hot Beverage Cups | ||
| Cold Beverage Cups | |||
| Ice-cream and Dairy Containers | |||
| Take-away Meal Bowls and Food Pots | |||
| Vending and Water-cooler Cones | |||
| By Geography | North America | United States | |
| Canada | |||
| Mexico | |||
| South America | Brazil | ||
| Argentina | |||
| Rest of South America | |||
| Europe | Germany | ||
| United Kingdom | |||
| France | |||
| Italy | |||
| Spain | |||
| Russia | |||
| Rest of Europe | |||
| Asia-Pacific | China | ||
| Japan | |||
| India | |||
| South Korea | |||
| Australia | |||
| Rest of Asia-Pacific | |||
| Middle East and Africa | Middle East | Saudi Arabia | |
| United Arab Emirates | |||
| Turkey | |||
| Rest of Middle East | |||
| Africa | South Africa | ||
| Nigeria | |||
| Rest of Africa | |||


Key Questions Answered in the Report
What is the current size and growth outlook of the global cupstock paperboard market?
The market stands at 5.1 million tonnes in 2025 and is forecast to reach 6.2 million tonnes by 2030, translating to a 4.03% CAGR.
Which region holds the largest share and shows the fastest expansion?
Asia-Pacific leads with 38.62% share in 2024 and is projected to grow at a 6.21% CAGR through 2030.
Which paperboard grades dominate demand?
Solid Bleached Sulfate accounts for 47.24% of 2024 volume, while Coated Unbleached Kraft is the fastest-growing grade at a 5.74% CAGR.
How is coating technology evolving in this market?
Polyethylene linings still hold 72.06% share, but aqueous dispersion coatings are rising at a 7.03% CAGR as brands seek PFAS-free, fully recyclable options.
What regulatory changes most influence purchasing decisions?
The EU Packaging and Packaging Waste Regulation, effective 2025, requires full recyclability and caps PFAS at 25 ppb, driving brand owners toward new barrier chemistries.
Page last updated on:


