
Paper Pigment Market Size and Share
Market Overview
| Study Period | 2020 - 2031 |
|---|---|
| Market Size (2026) | USD 20.71 Billion |
| Market Size (2031) | USD 26.96 Billion |
| Growth Rate (2026 - 2031) | 5.41 % |
| Fastest Growing Market | Asia Pacific |
| Largest Market | Asia Pacific |
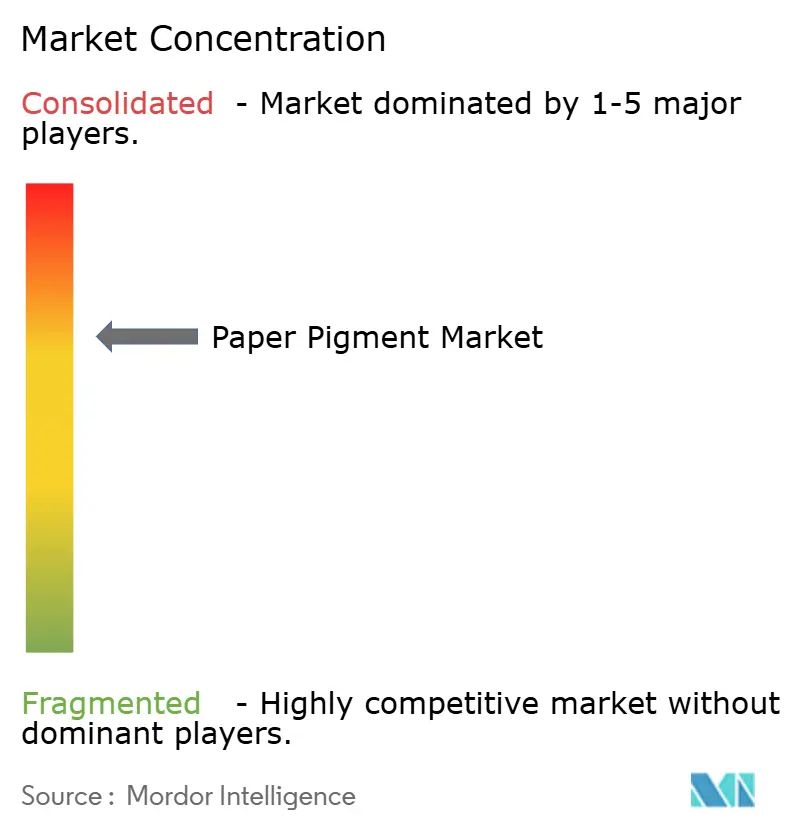
| Market Concentration | Medium |
Major Players *Disclaimer: Major Players sorted in no particular order Image © Mordor Intelligence. Reuse requires attribution under CC BY 4.0. | |
Paper Pigment Market Analysis by Mordor Intelligence
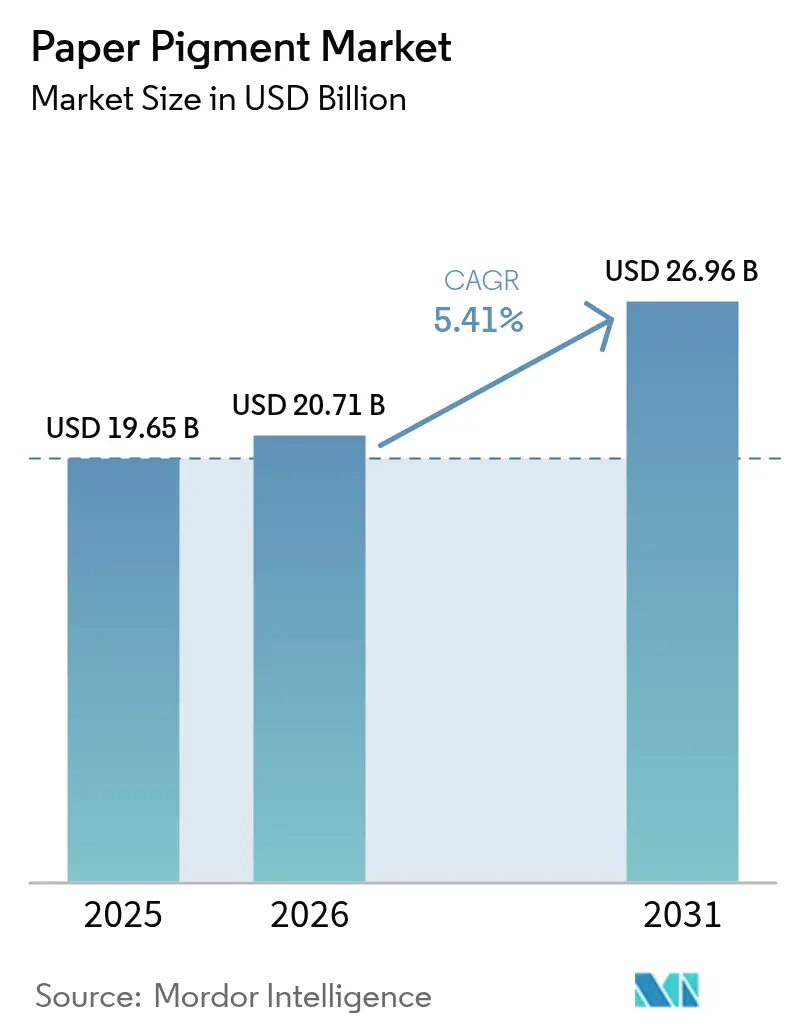
The Paper Pigment Market size was valued at USD 19.65 billion in 2025 and estimated to grow from USD 20.71 billion in 2026 to reach USD 26.96 billion by 2031, at a CAGR of 5.41% during the forecast period (2026-2031). This solid expansion of the paper pigments market reflects manufacturers’ ability to capture value from the surging global packaging segment even as traditional graphic printing wanes. Rising e-commerce volumes, rapid substitution of plastic with paper-based formats, and sustained cost pressure on paper mills are encouraging wider use of calcium carbonate and other cost-efficient fillers. Concurrently, advances in nano-structured and PFAS-free formulations are opening premium niches inside the paper pigments market for functional grades that improve barrier, opacity and hygiene performance. Finally, steady consolidation among pigment suppliers—combined with vertical integration by large mineral processors—supports scale benefits and fosters technology transfer toward low-carbon production.
Key Report Takeaways
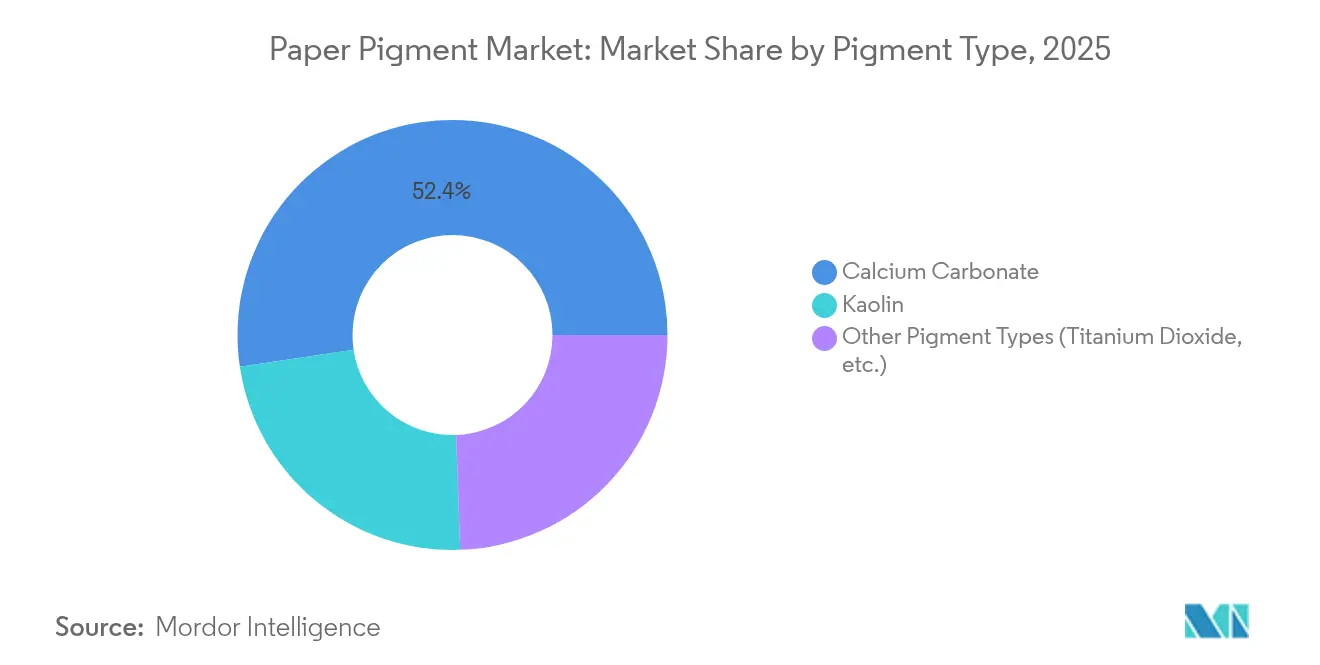
- By pigment type, calcium carbonate held 52.35% of the paper pigments market share in 2025, while the “Other Types” category is projected to grow the fastest at a 6.71% CAGR through 2031.
- By application, coated paper captured 62.55% revenue in 2025; the “Other Applications” segment is set to expand at a 7.34% CAGR to 2031.
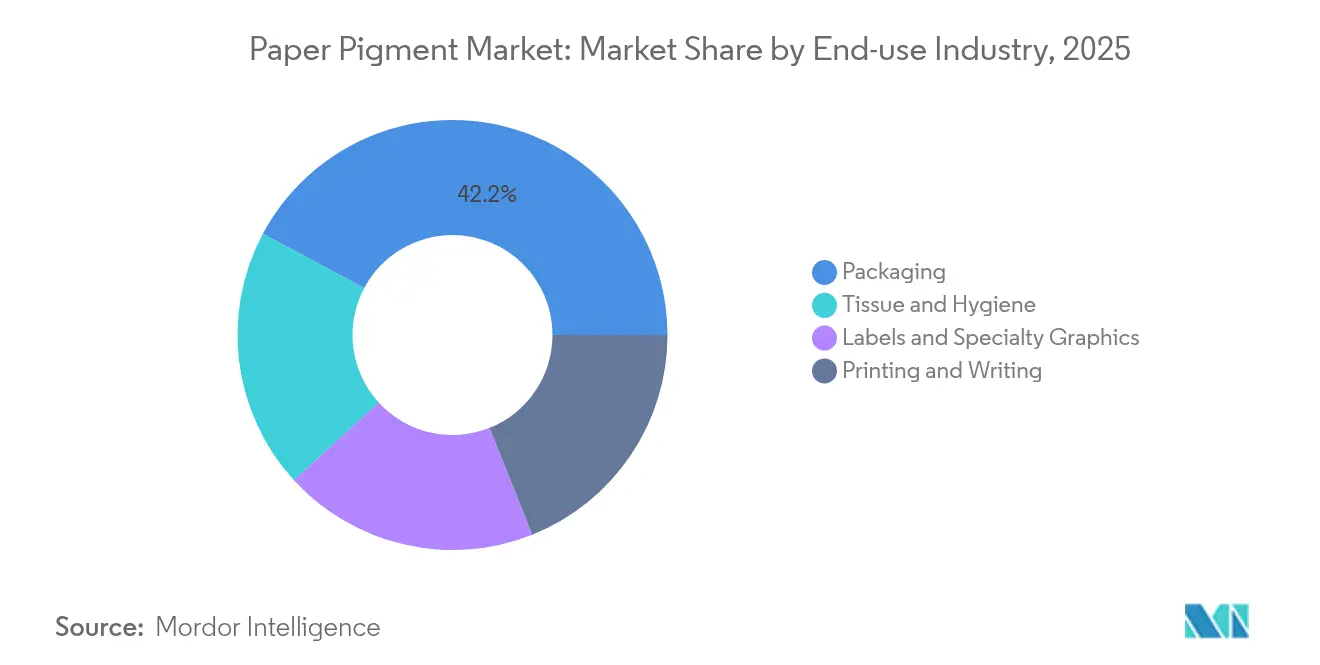
- By end-use industry, packaging accounted for 42.20% of the paper pigments market size in 2025 and is advancing at a 6.75% CAGR during the forecast period.
- By geography, Asia-Pacific led with 44.05% of the paper pigments market share in 2025; the same region is projected to post the highest 6.14% CAGR through 2031.
Note: Market size and forecast figures in this report are generated using Mordor Intelligence’s proprietary estimation framework, updated with the latest available data and insights as of 2026.
Global Paper Pigment Market Trends and Insights
Drivers Impact Analysis*
| Driver | (~) % Impact on CAGR Forecast | Geographic Relevance | Impact Timeline |
|---|---|---|---|
| Growing demand for paper from the packaging industry | +1.8% | Global, with strongest impact in Asia-Pacific and North America | Medium term (2-4 years) |
| Rising adoption of calcium carbonate fillers to cut production cost | +1.2% | Global, particularly in cost-sensitive emerging markets | Short term (≤ 2 years) |
| Expansion of e-commerce boosting corrugated board output | +1.5% | Global, with concentration in Asia-Pacific and North America | Medium term (2-4 years) |
| Increasing consumption of coated & specialty graphic papers | +0.8% | Europe and North America primarily | Long term (≥ 4 years) |
| Nano-structured pigments enabling lighter high-opacity paper | +0.6% | Developed markets with premium applications | Long term (≥ 4 years) |
| Source: Mordor Intelligence | |||
Growing Demand for Paper from the Packaging Industry
Corrugated and folding carton producers now demand pigments that meet printability, brightness and food-contact requirements. Valmet’s OptiConcept M line for Anhui Linping adds 1,808 tonnes per day of recycled linerboard capacity, underscoring the volume pull for pigments that ensure surface uniformity. Brand owners shifting from plastics to fiber packaging rely on highly opaque and migration-safe pigment systems, and BASF’s new water-based dispersion plant in Heerenveen is designed specifically for these substrates[1]BASF, “Heerenveen Water-based Dispersions Expansion,” basf.com. As a result, the paper pigments market is capturing increased tonnage and higher average selling prices in packaging-centric regions.
Rising Adoption of Calcium Carbonate Fillers to Cut Production Cost
Ground and precipitated calcium carbonate can replace titanium dioxide at up to 20 percentage points while preserving brightness, generating immediate margin relief for mills coping with volatile energy charges. Suppliers with captive limestone quarries, such as Imerys and Omya, offer on-site PCC satellite plants that lower logistics costs and help customers to optimize the paper pigments market supply chain. Emerging economies, where converter margins are slimmer, are rapidly pivoting toward GCC-rich formulations, reinforcing calcium carbonate’s dominant share.
Expansion of E-commerce Boosting Corrugated Board Output
Online retail, projected to add roughly 4.4% volume CAGR in printed packaging through 2029, is pushing converters to upgrade graphics on corrugated liners. The shift from brown box to colorful, shelf-ready formats needs pigments that improve ink holdout and dot fidelity. Large packagers such as the combined Smurfit Kappa-WestRock group are harmonizing specifications across a global mill network, giving qualified pigment suppliers sizable long-term contracts.
Increasing Consumption of Coated & Specialty Graphic Papers
Although uncoated printing grades continue to decline, specialty coated papers retain value thanks to catalog, label and luxury print use. Nano-structured titanium dioxide lets producers reach opacity at lower basis weights, cutting fiber cost and reducing transportation emissions. Suppliers that can engineer particle morphology and surface modifications are securing profitable niches within the paper pigments market.
Restraints Impact Analysis*
| Restraint | (~) % Impact on CAGR Forecast | Geographic Relevance | Impact Timeline |
|---|---|---|---|
| Digitalization reducing demand for printing & writing paper | -2.1% | Developed markets worldwide | Short term (≤ 2 years) |
| Environmental concerns & inadequate recycling infrastructure | -0.9% | Europe and North America | Medium term (2-4 years) |
| Direct-to-package digital printing lowering coating requirements | -1.5% | Global, strongest in packaging-intensive regions | Medium term (2-4 years) |
| Source: Mordor Intelligence | |||
Digitalization Reducing Demand for Printing & Writing Paper
Digital transformation creates structural headwinds for traditional paper pigment applications, with the US printing industry experiencing 47.3% employment reduction from 2002-2021 as digitalization accelerated [2]International Journal of Technology, “Digitalization and Printing Industry,” ijtech.itb.ac.id. Pigment suppliers built around high-volume offset stocks now face under-utilized plants and must realign toward packaging, tissue or functional papers.
Digitalization Reducing Demand for Printing & Writing Paper
Restrictive PFAS legislation, together with limited pigment recovery in recycling streams, raises compliance costs. Norwegian studies detected up to 971 µg/kg of PFAS in paper products, prompting swift phase-outs across Europe. Clariant’s full PFAS-free portfolio shows the immediate R&D outlay needed to satisfy regulators and brand-owner procurement policies.
*Our forecasts treat driver/restraint impacts as directional, not additive. The impact forecasts reflect baseline growth, mix effects, and variable interactions.
Segment Analysis
By Pigment Type: Calcium Carbonate Dominance Amid Specialty Innovation
Calcium carbonate commanded 52.35% of the paper pigments market in 2025, a share built on its ability to displace high-priced TiO₂ and to double as filler and coating pigment. GCC and PCC variants can cut formulation cost by up to 20%, a critical benefit when energy inflates overall mill expense. The paper pigments market size allocated to calcium carbonate grades is expected to grow in lock-step with new satellite PCC plants coming onstream near Asian board mills.
Meanwhile, the “Other Types” basket—titanium dioxide, kaolin-nano hybrids and emerging bio-based pigments—posts a 6.71% CAGR to 2031. Titanium dioxide remains indispensable in high-grade décor and label stock, yet suppliers add nanotechnology to boost opacity at lower dosages. Specialty players that master surface treatment and dispersion can charge premiums in the paper pigments industry as converters seek lightweight yet vivid sheets.



By Application: Coated Paper Leadership Faces Digital Disruption
Coated papers represented 62.55% of 2025 demand, underscoring pigment intensity where brightness and smoothness are paramount. However, migrating ad budgets and office digitization erode run lengths, compelling mills and pigment vendors to pivot toward premium, shorter-run jobs that tolerate higher pigment spend. The uncoated segment stays price-sensitive, focusing on opacity boosts rather than surface gloss.
Digital printing of labels and folding cartons introduces fresh surface-energy requirements. UV inkjet and electrophotography rely on pigments that anchor ink droplets without excessive absorption, a property now engineered through tailored PCC-kaolin blends. These dynamics sustain a segmented paper pigments market where application dictates formulation complexity.
By End-use Industry: Packaging Sector Drives Growth Momentum
Packaging captured 42.20% revenue in 2025 and rises at 6.75% CAGR to 2031, becoming the backbone of the paper pigments market. Food service, e-commerce and retail makeover campaigns require brighter liners, recyclable barrier coatings and vivid graphics, each pigment-intensive. Major linerboard capacity in China, India and Southeast Asia further underpins regional pigment offtake.
Printing & writing grades, formerly the lion’s share of pigment usage, shrink in absolute terms. Labels, décor and speciality graphics absorb part of the slack through higher unit value and customized color. Tissue and towel grades consume pigments mostly for appearance and softness, giving mineral fillers a niche but steady outlet in the paper pigments industry.
Geography Analysis
Asia-Pacific held 44.05% of the paper pigments market in 2025 and is expanding at a 6.14% CAGR as the region adds board machines and invests in e-commerce-oriented packaging. China’s latest mill upgrades, together with India’s capacity builds, secure long-run volume for PCC and specialty pigments. Suppliers benefit not only from proximity to limestone reserves but also from lower production costs that allow competitive export pricing.
North America remains anchored in packaging and tissue, offsetting graphic decline. Brand sustainability pledges have led converters to phase out plastics in favor of recyclable fiber, leading pigment producers to qualify PFAS-free, migration-safe systems at mills across the United States and Canada. Digital presses for short-run folding cartons and direct-to-corrugate printing require new surface chemistries, prompting collaborative development between pigment suppliers and OEMs.
Europe emphasizes eco-design and carbon-footprint cuts. Despite a 13% fall in paper production during 2023, investment continues in premium barrier coatings and CO₂-optimized mills, such as Smurfit Kappa’s Zülpich upgrade that trims 55,000 tonnes of annual emissions. South America and the Middle East & Africa register smaller bases but above-average growth, supported by mega-pulp projects like ANDRITZ’s 2.55 million-ton Suzano line that boosts pigment demand for high-brightness pulp exports.


Value Chain Analysis
The paper pigment value chain starts with upstream mining and beneficiation of minerals, including limestone for GCC/PCC, kaolin clays, and titanium dioxide feedstocks. Pigment processing and formulation then convert these inputs into dry powders or aqueous slurries. Integrated mineral processors such as Imerys and Omya, together with specialty producers such as Minerals Technologies Inc. (MTI) and BASF for functional dispersions, supply pigments that are further refined through dispersion, surface treatment, and quality control to meet coated paper and packaging specifications.
Midstream logistics acts as both a cost and performance lever because pigments have a high weight-to-value ratio. Bulk and slurry handling (tankers, rail, and ocean freight) and regional storage terminals help maintain continuity of supply. Downstream, paper and board mills consume pigments in wet-end addition and coating kitchens, and on-site PCC satellite plants, a model used by MTI and other carbonate suppliers, reduce transport exposure while tightening technical collaboration with mills. Purchasing is increasingly centralized among large packaging and paper producers, which raises qualification requirements, supports longer supply agreements, and encourages suppliers to provide application support tied to printability, barrier performance, and recyclability targets.
Competitive Landscape
The paper pigments market is moderately fragmented, with major players like Imerys, Omya, and Minerals Technologies dominating calcium carbonate and kaolin supply through quarry-to-customer integration and satellite PCC plants, which lower transport costs and ensure quality, creating high entry barriers. Mid-tier companies such as Clariant and BASF focus on functional additives, PFAS-free coatings, and premium nano-structured grades. Larger packaging converters are centralizing procurement, driving suppliers to standardize quality globally and improve logistics. Technology is a key differentiator, with firms investing in VOC-free dispersions, bio-based binders, and antimicrobial pigments, while R&D targets low-carbon PCC, nano-TiO₂ with controlled photoactivity, and hybrid solutions offering barrier and printability. Early commercialization of these innovations could secure significant market share.
Paper Pigment Industry Leaders
Ashapura Group
Omya AG
Minerals Technologies Inc.
Imerys
BASF
- *Disclaimer: Major Players sorted in no particular order

Market Opportunities and Future Outlook
White space is emerging in mill-integrated supply models and in functional grades that support packaging conversion from plastics while managing mill cost pressure. MTI has highlighted ongoing investment in the satellite-plant model, including commissioning an additional paper and packaging satellite plant in early 2026 after starting three new satellite plants in China and India and doubling capacity at an existing Indian site during 2025. This operational approach creates practical opportunities for carbonate suppliers to co-locate production with packaging-focused mills, improve supply security, and offer performance-driven PCC solutions that enable basis-weight reduction and partial titanium dioxide substitution.
Premium opportunities are also developing in specialty coatings where pigments take on barrier and performance roles rather than only brightness and opacity. Academic work published in May 2026 described lignin nanoparticle-stabilized Pickering emulsion coatings that deliver water and oil resistance while supporting recyclability and biodegradability, reinforcing demand for compatible pigment and dispersion systems in fiber-based food-contact and e-commerce packaging. At the same time, application-led innovation in titanium dioxide is shifting toward functional use cases, for example heat-control layers for thermal paper, which supports demand for engineered morphologies and hybrid pigment systems that align with tighter chemical and brand-owner procurement requirements, including PFAS-free positioning already visible in supplier portfolios.
Recent Industry Developments
- April 2026: Minerals Technologies Inc. reported that its Specialty Additives product line, serving paper and packaging customers, delivered a 9% sequential sales increase in Q1 2026. The update points to active demand from paper and packaging accounts and supports continued focus on functional mineral additives tied to mill performance and customer-specific specifications.
- January 2026: Minerals Technologies Inc. announced expansions of its paper and packaging satellite operations in Asia, including new satellite facilities in China and another location in the region. The change reinforces the on-site and near-site production model for PCC and related additives, reducing logistics friction while strengthening long-term integration with high-volume packaging mills.
- March 2024: Omya AG announced price increases for its calcium carbonate products in Europe effective April 1, 2024, referencing support for sustainability and the Paper and Board sector. The action reflects ongoing cost pass-through dynamics in mineral inputs and can shape reformulation decisions between carbonate grades and alternative pigments across European mills.


Research Methodology Framework and Report Scope
Market Definition and Coverage
This market counts the value of pigments used to improve paper properties such as brightness, opacity, and printability, whether they are added in the furnish or used in paper coating. We size demand across major paper grades where pigments are a repeat input tied to paper output.
Scope exclusions: Excludes paper dyes, inks, and downstream printing services, and it also excludes finished paper products sold to end users.
Segmentation Overview
- By Pigment Type
- Calcium Carbonate
- Kaolin
- Other Pigment Types (Titanium Dioxide, etc.)
- By Application
- Uncoated Paper
- Coated Paper
- By End-use Industry
- Packaging
- Printing and Writing
- Labels and Specialty Graphics
- Tissue and Hygiene
- By Geography
- Asia-Pacific
- China
- India
- Japan
- South Korea
- Thailand
- Indonesia
- Vietnam
- Malaysia
- Philippines
- Rest of Asia-Pacific
- North America
- United States
- Canada
- Mexico
- Europe
- Germany
- United Kingdom
- France
- Italy
- Spain
- Russia
- NORDIC Countries
- Turkey
- Rest of Europe
- South America
- Brazil
- Argentina
- Colombia
- Rest of South America
- Middle East and Africa
- Saudi Arabia
- United Arab Emirates
- Qatar
- South Africa
- Nigeria
- Egypt
- Rest of Middle East and Africa
- Asia-Pacific
Data Sources, Market Sizing, and Validation
Desk Research
Desk work starts by building a clear demand map linking pigment use to paper production volumes and the shift between coated and uncoated grades. For this, we rely on public paper and pulp production statistics and trade flows, along with technical references that explain typical filler and coating loadings by grade.
Common sources we refer to include publications and datasets such as FAO forestry and paper statistics, UN Comtrade trade data, USGS mineral commodity summaries, the European Commission and US EPA pages on chemical and mineral regulation, and peer reviewed papers on paper coating and mineral fillers. We also review company filings and investor presentations to understand capacity additions, product mix, and regional exposure, and we use paid subscriptions for company financials and intelligence, news and financials, patent databases, and shipment level import and export checks where useful. This list is illustrative, and many other public sources were also used to collect data, validate assumptions, and clarify gaps.
Primary Interviews and Surveys
Primary work is used to pressure test what desk sources cannot reliably show, especially pigment loading ranges by paper grade, regional price bands, and how quickly mills are shifting coating recipes. We speak with a mix of pigment suppliers, distributors, paper manufacturers, and technical specialists across APAC, EMEA, and the Americas so that assumptions can be corrected before finalizing the model.
Distribution of primary research fieldwork respondents
| Company type | Respondent position | Region |
|---|---|---|
| Top tier: 35% | CXOs: 17% | APAC: 45% |
| Mid tier: 46% | Functional/Unit leaders: 32% | EMEA: 29% |
| Smaller Players: 19% | Managers: 51% | Americas: 26% |
Market-Sizing & Forecasting
Sizing is built using a top-down and bottom-up approach, where paper and board production by region is first reconstructed from public output and trade series, and then converted into pigment demand using grade mix and typical filler and coating inclusion rates. After the demand pool is formed, pricing is applied using region specific ranges for major pigment groups and adjusted for mix shifts between calcium carbonate, kaolin, and other types.
To keep the model grounded, we use inputs such as coated versus uncoated paper share, packaging versus printing and writing balance, regional paper capacity utilization signals, import and export movements for key minerals, and the spread between domestic and imported pigment pricing. When desk indicators are thin for a country, the gap is handled through regional proxying that is cross checked with interview feedback and trade direction, and then sanity tested against supplier revenue exposure trends. Forecasting is then carried out using scenario analysis supported by simple multivariate relationships, where paper output, packaging demand momentum, and expected coating intensity are the key drivers, and then the path is refined using what industry experts expect for substitution, recipe optimization, and price progression.
Data Validation & Update Cycle
Validation is done through repeated checks across independent signals so that one data series does not drive the entire outcome. We compare modeled pigment demand against paper output growth, pigment trade movements, and realistic loading ranges, and then outliers are reviewed region by region before sign off.
If a large variance shows up, such as a sudden price step change or a demand swing not explained by paper production, analysts re check the assumptions and may reconnect with respondents to confirm what changed. Reports are refreshed annually, and interim updates are triggered when material events occur, including major capacity announcements, supply disruptions, or regulatory changes that impact mineral use. Before delivery, a final review pass is completed so clients receive the most current view available.
Mordor Intelligence's Paper Pigment Market Size Compared Against Other Published Estimates
Published market sizes for paper pigment can look far apart because the boundaries are not always consistent, and even small choices can move the number. The most common differences come from what is counted as a paper pigment, which paper grades are included, and whether values are reported at producer level or at later points in the value chain.
By tracking coated versus uncoated paper output, refreshing regional loading assumptions through interviews, and checking price bands by pigment type, Mordor Intelligence keeps the 2025 total aligned to pigment consumption tied to paper manufacturing rather than broader paper chemical spending. A few estimates also mix older base years with aggressive growth paths, or they apply one global average price across very different regional cost structures, which can widen the spread further.
Benchmark comparison
| Source | Market Size | Gaps in Research Methodology |
|---|---|---|
| Mordor Intelligence | USD 19.65 B (2025) | |
| Global Consultancy A | USD 18.21 B (2025) | Uses factory gate framing and may exclude portions of distributor margin and some downstream service elements that can be counted in other approaches, which typically keeps the total lower for the same year. |
| Industry Publisher B | USD 12.60 B (2021) | Uses an earlier base year and a different time window, and the value is not directly comparable to a 2025 market because paper grade mix and pigment pricing moved materially over the period. |
The table shows that most of the gap can be explained by year alignment and by whether the value is captured at the manufacturer gate or closer to where pigments are actually consumed in papermaking. When scope is kept tight around paper production drivers and the price and loading assumptions are checked with practitioners, the market size becomes easier to trace and repeat year to year.


Key Questions Answered in the Report
What is the current value of the paper pigments market?
The paper pigments market is valued at USD 20.71 billion in 2026.
Which pigment type dominates global demand?
Calcium carbonate leads with 52.35% market share in 2025, owing to its cost and performance advantages.
How fast is the packaging segment growing?
Packaging applications in the paper pigments market are advancing at a 6.75% CAGR through 2031 as e-commerce and plastic substitution accelerate.
What region shows the strongest growth momentum?
Asia-Pacific combines the highest 44.05% share with a leading 6.14% CAGR, supported by board-making capacity expansion.
How are environmental regulations influencing pigment development?
Tighter PFAS and carbon limits push suppliers toward PFAS-free, low-carbon, and nano-structured formulations, reshaping R&D priorities and capital deployment within the industry.
Page last updated on:


 Your data is secure and never sold or shared.


