Soybean Meal Market Size and Share
Soybean Meal Market Analysis by Mordor Intelligence
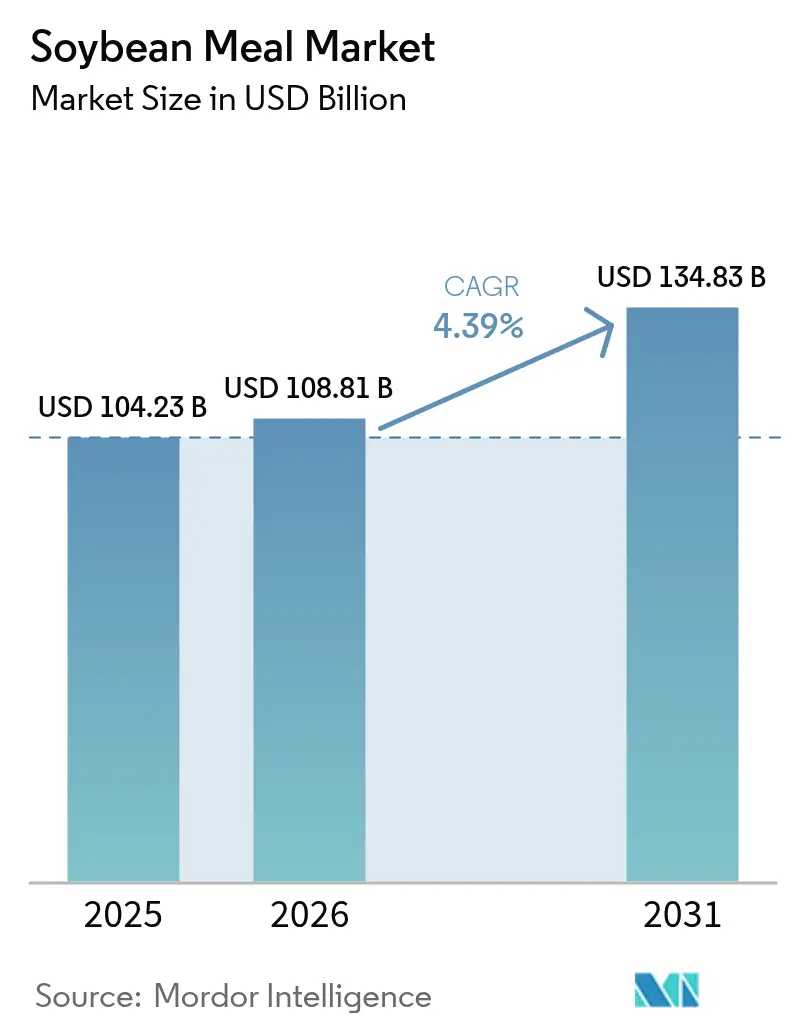
The Soybean Meal Market size was valued at USD 104.23 billion in 2025 and estimated to grow from USD 108.81 billion in 2026 to reach USD 134.83 billion by 2031, at a CAGR of 4.39% during the forecast period (2026-2031). This trajectory reflects resilient global demand for cost-efficient protein ingredients and the growing influence of renewable diesel policies that incentivize additional soybean crushing capacity. Supply chains are re-aligning as the EU’s deforestation-free regulation pushes traders to certify origin traceability, while aquaculture growth across Asia-Pacific sustains sizeable import flows despite volatile commodity prices. Record U.S. soybean meal exports of 14.4 million metric tons in 2024 underscore the market’s ability to redirect surplus meals generated by expanded oil-driven crush margins. At the same time, mycotoxin control costs and weather-related production swings continue to pressure operating margins, prompting processors to invest in quality assurance and logistics optimization.
Key Report Takeaways
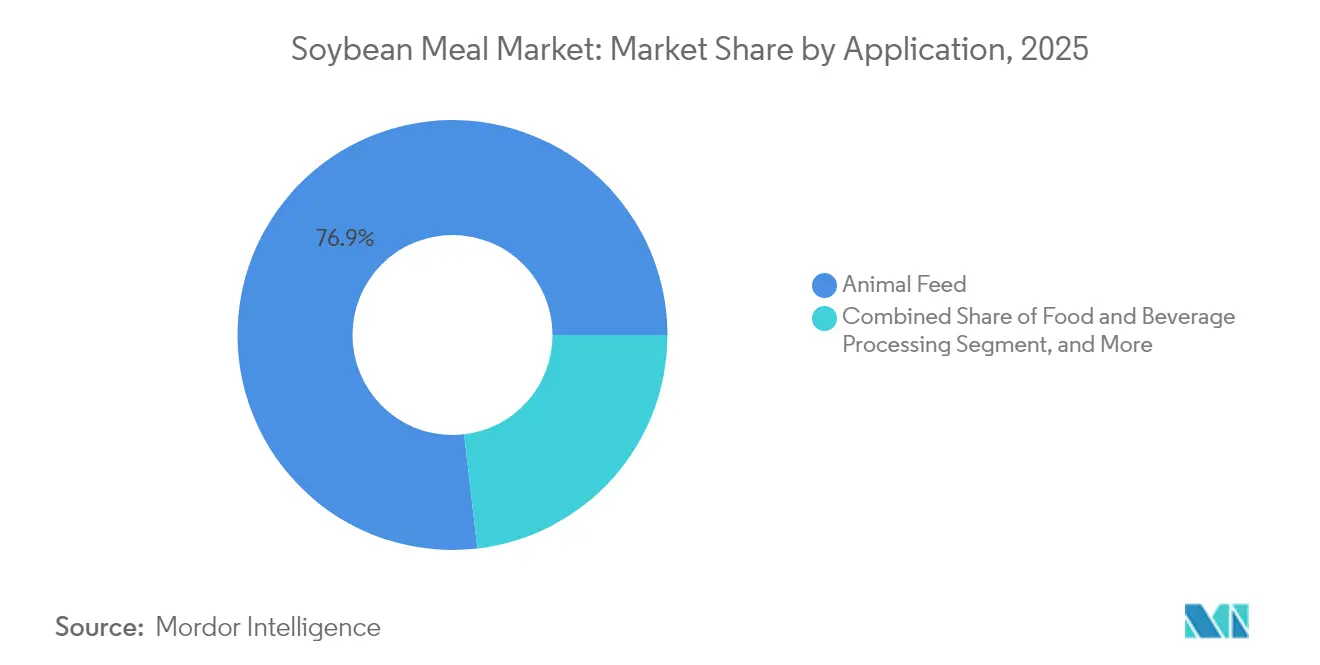
- By application, animal feed led with 76.85% of the soybean meal market share in 2025, while industrial and bio-based products are projected to expand at a 5.63% CAGR through 2031.
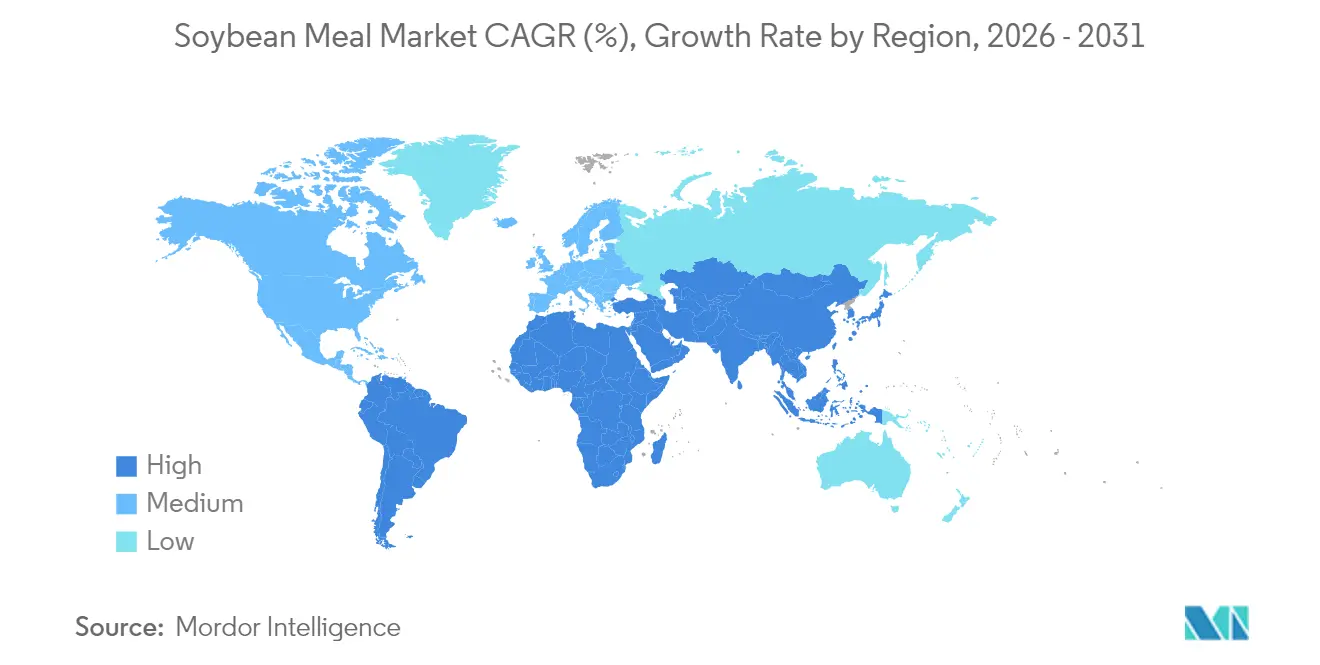
- By geography, Asia-Pacific dominated with a 38.02% value share in 2025; the same region is forecast to grow the fastest at a 5.96% CAGR by 2031.
Note: Market size and forecast figures in this report are generated using Mordor Intelligence’s proprietary estimation framework, updated with the latest available data and insights as of 2026.
Global Soybean Meal Market Trends and Insights
Drivers Impact Analysis*
| Driver | (~) % Impact on CAGR Forecast | Geographic Relevance | Impact Timeline |
|---|---|---|---|
| Rising demand for high-protein animal feed formulations | +1.2% | Global; concentrated in Asia-Pacific and North America | Medium term (2-4 years) |
| Expansion of aquaculture feed capacity | +0.8% | Asia-Pacific core; spillover to South America | Long term (≥ 4 years) |
| Biofuel growth driving additional soybean crush volumes | +1.0% | North America and EU; expanding to Brazil | Short term (≤ 2 years) |
| Deforestation-free sourcing mandates reshaping global trade routes | +0.4% | EU-focused with global implications | Medium term (2-4 years) |
| Real-time digital commodity platforms lowering transaction and logistics costs | +0.3% | Global; early adoption in developed markets | Long term (≥ 4 years) |
| Adoption of insect-soymeal blend feeds boosting overall soymeal utilization | +0.2% | Europe and North America; pilots in Asia | Long term (≥ 4 years) |
| Source: Mordor Intelligence | |||
Rising Demand for High-Protein Animal Feed Formulations
Feed accounts for 60-70% of livestock production costs, pushing formulators toward protein sources that maximize amino acid delivery per unit price. Soybean meal consistently provides a balanced amino acid profile and averages 37.7% crude protein in new varieties, reinforcing its dominance in precision poultry and swine rations. Broiler rations now absorb 66.2% of the meal used in poultry feeds after rising 21.5% between 2017 and 2022. Rapid meat consumption growth in Southeast Asia amplifies this pull, while genetic improvements in soybean cultivars enhance digestibility advantages over variable vegetable alternatives.
Expansion of Aquaculture Feed Capacity
Aquaculture represents the fastest-growing animal protein sector, and feed for shrimp, tilapia, and catfish typically contains 30-35% soybean meal to meet digestibility and amino acid needs. Mexico’s shrimp segment alone consumes significant U.S. soybean meal as feed producer Vimifos captures 21% of the local market share with soy-rich formulations.[1] Iowa Soybean Association, “Soy Demand Outlook 2025,” iasoybeans.com Fermented meal variants lower anti-nutritional factors and improve feed conversion ratios, while extrusion technology upgrades further raise digestibility, cementing soybean meal’s role despite experimentation with insect proteins.
Biofuel Growth Driving Additional Soybean Crush Volumes
Renewable diesel policies have lifted U.S. soybean oil demand, raising oil’s share of crush margins and spurring more than 30% capacity expansion since 2023. Each gallon of renewable diesel yields nearly 6.5 lb of co-product soybean meal, swelling supplies for both export and domestic feed markets. ADM and other crushers have accelerated plant upgrades to capitalize on premium credit incentives, ensuring abundant meal output even when oil commands price premiums.[2]Reuters, “China Approves Bunge-Viterra Deal,” reuters.com
Deforestation-Free Sourcing Mandates Reshaping Global Trade Routes
The EU regulation taking effect in December 2025 obliges importers to prove deforestation-free provenance, adding USD 2-5 per metric ton to certified cargoes and encouraging blockchain-enabled batch tracking. Bunge has geolocated more than 16,000 South American farms and shipped 185,000 metric tons of compliant soybean meal to Thailand as early adopters capture price premiums. Suppliers with satellite-verified supply chains gain an edge, potentially reshuffling long-established Brazilian, Argentine, and Paraguayan trade flows into the EU and the United Kingdom.
Restraints Impact Analysis*
| Restraint | (~) % Impact on CAGR Forecast | Geographic Relevance | Impact Timeline |
|---|---|---|---|
| Volatile soybean prices driven by weather and biofuel policies | -0.9% | Global; acute in South and North America | Short term (≤ 2 years) |
| Mycotoxin contamination incidents tightening quality rules | -0.5% | Global; highest in Asia-Pacific and Sub-Saharan Africa | Medium term (2-4 years) |
| Competition from alternative high-protein meals | -0.4% | Global; pronounced in Europe and North America | Long term (≥ 4 years) |
| ESG-linked finance penalizing soymeal tied to land-use change | -0.3% | EU and OECD financial markets with global spillover | Medium term (2-4 years) |
| Source: Mordor Intelligence | |||
Volatile Soybean Prices Driven by Weather and Biofuel Policies
Droughts, floods, and currency swings have intensified price movements, complicating procurement for feed compounders. Brazil’s floods cut the 2024 crop in Rio Grande do Sul by 2.71 million metric tons, while the U.S. January 2025 WASDE report surprised futures markets with smaller yield downgrades and sparked bullish rallies even as global stocks approached record highs. Renewable diesel demand exaggerates swings by tightening domestic oil supply, forcing crushers to actively hedge margins and heightening risk for downstream meal buyers.
Mycotoxin Contamination Incidents Tightening Quality Rules
Global surveys show 88% of feed samples contain at least one mycotoxin, and Chinese soybean meal exhibits 70% zearalenone contamination at 47 micrograms per kilogram, prompting costly monitoring programs. U.S. meal routinely tests cleaner, influencing Asian buyers seeking consistent quality, but universal tightening of import thresholds means exporters everywhere are investing in rapid detection kits and integrated remediation strategies that can add USD 1-3 per metric ton to delivered costs.
*Our forecasts treat driver/restraint impacts as directional, not additive. The impact forecasts reflect baseline growth, mix effects, and variable interactions.
Segment Analysis
By Application: Animal Feed Accelerates, While Industrial and Bio Based Products Show Growth Potential
Animal feed remains the anchor of the soybean meal market, holding 76.85% of its value in 2025. Broiler integrators raised soybean meal inclusion as lysine-based protein alternatives plateaued, underpinning the segment’s USD 80.11 billion contribution to the soybean meal market size in the base year. In swine, heightened feed-grade amino acid adoption trimmed volumes, yet overall feed efficiency gains preserved demand as precision nutrition formulations tilt toward balanced protein coatings. Aquaculture feed grew fastest inside the feed block owing to enzyme-enhanced meals that improve digestibility, reinforcing Asia’s heavy reliance on imported cargoes.
Industrial and bio-based uses are forecast to grow at a 5.63% CAGR, the quickest among all applications, as manufacturers exploit soybean meal’s renewable protein and fiber fractions for adhesives, lubricants, and roof sealants. Partnerships between the Iowa Soybean Association and consumer brands have already commercialized soy-based bar-and-chain oil, and Airable Research Lab pilot projects seek to extend usage into wind-turbine composites. As these initiatives scale, they could command a 9.72% slice of the soybean meal market size by 2031, adding flexibility to crush plant offtake strategies and cushioning feed-driven demand cycles.


Geography Analysis
Asia-Pacific commands 38.02% of the 2025 value and is projected to expand the soybean meal market at a 5.96% CAGR through 2031. China consumed 80.6 million metric tons of soybean meal in 2024, while livestock feed output contracted slightly as ration efficiency improved and hog herds normalized after disease outbreaks. Vietnam, the Philippines, and Bangladesh all lifted imports, and India’s 7.7 million metric tons of domestic usage signals rising protein uptake in dairy, poultry, and aqua segments. As Southeast Asia’s aquaculture complexes scale, regional crushers struggle to match demand, ensuring sustained import growth even under volatile pricing regimes.
North America anchors global supply through high-capacity crushing networks and expanding biofuel policies. U.S. soybean crush hit 65.6 million metric tons in 2024, up 5.4% year-on-year, and new Midwest plants will lift daily throughput by another 1.4 billion bushels by 2026. Capital projects such as Bartlett’s USD 375 million Kansas facility illustrate public-private alignment on renewable diesel goals, which translate directly into larger domestic meal surpluses available for Mexico, Canada, and Asian buyers.
South America combines large output with logistical diversification. Brazil produced 42.4 million metric tons of soybean meal in 2024 and exported 21.2 million metric tons, helped by currency depreciation and improved Northern Arc port infrastructure. Argentina’s crush rebounded 37% to 42.4 million metric tons after drought recovery, regaining its top exporter slot as export tax cuts and pipeline upgrades restored capacity. Paraguay and Uruguay expand at steady, albeit smaller bases, leveraging river and rail investments to capture Asian demand. Nevertheless, policy stability, transport bottlenecks, and shifting EU sustainability criteria will shape the longer-term contribution of the region to the global soybean meal market share.

Recent Industry Developments
- June 2025: The U.S. Department of Commerce has imposed a steep 340.7% countervailing duty on organic soybean meal exports from LT Foods’ subsidiary, Ecopure, citing a lack of cooperation during its investigation. This move could severely restrict Ecopure’s access to the U.S. market, prompting the company to explore legal remedies.
- May 2025: Uruguay has signed a landmark agreement with China to export rapeseed and soybean meal, backed by a phytosanitary protocol ensuring safety and traceability.
- March 2025: South American soybean meal basis prices have surged to a three-month high, with Brazil’s FOB Paranagua and Argentina’s FOB Up River premiums reaching approximately USD 7.72/metric ton and USD 2.20/metric ton above CBOT futures, respectively. This spike is fueled by global trade tensions, currency fluctuations, and local supply uncertainties, particularly Argentina’s reduced crop forecast due to drought.


Research Methodology Framework and Report Scope
Market Definitions and Key Coverage
Our study counts soybean meal as the high-protein residue obtained after solvent or mechanical extraction of oil from whole soybeans, traded globally in bulk form and used primarily as a feed-grade ingredient across livestock, poultry, and aquaculture rations. Values are reported in nominal USD at the exporter's free-on-board price plus standard freight adjustments.
Scope exclusion: specialty soy protein concentrates and fermented soy flours are not included.
Segmentation Overview
- By Application
- Animal Feed
- Food and Beverage Processing
- Industrial and Bio-based Products
- By Geography (Production Analysis (Volume), Consumption Analysis (Value and Volume), Import Analysis (Value and Volume), Export Analysis (Value and Volume), and Price Trend Analysis)
- North America
- United States
- Canada
- Mexico
- Europe
- Spain
- Croatia
- France
- Germany
- Russia
- Asia-Pacific
- India
- China
- Bangladesh
- South America
- Brazil
- Argentina
- Uruguay
- Middle-East
- United Arab Emirates
- Saudi Arabia
- Africa
- South Africa
- Egypt
- North America
Detailed Research Methodology and Data Validation
Primary Research
Structured calls with crushers, feed formulators, and commodity traders across the Americas, Asia-Pacific, and Europe helped us validate inclusion rates, average selling prices, and near-term expansion plans. Our analysts also circulated short surveys to purchasing managers to triangulate landed-cost spreads and inventory turnover norms.
Desk Research
We began with production, trade, and price curves published by USDA-ERS, FAO FAOSTAT, and UN Comtrade, which let us pin down crush volumes, meal yields, and cross-border flows. Region-specific consumption insights were drawn from sources such as OECD-FAO Agricultural Outlook, the International Grains Council, and selected peer-reviewed feed science journals. Company 10-Ks, investor decks, and customs filings were pulled through D&B Hoovers and Dow Jones Factiva to benchmark major crusher capacities and shipment patterns. This list is illustrative; many other open datasets supported interim checks.
A second sweep covered policy and demand drivers. We tracked renewable diesel mandates, livestock inventory reports, and feed ingredient substitution studies from national ministries of agriculture, Eurostat, and the Brazilian CONAB, helping us capture regulatory and dietary fingerprints that nudge soy meal usage.
Market-Sizing & Forecasting
A top-down model converts global soybean crush into meal output, adjusts for protein specification losses, and marries this volume to region-level average selling prices. Results are stress-tested with selective bottom-up roll-ups of publicly listed crushers and sampled importer channel checks, then tuned for feed inclusion ratios, fishmeal substitution, biodiesel-driven crush shifts, livestock slaughter weights, and quarterly average soymeal prices. Multivariate regression with ARIMA error correction projects these drivers through 2030, with expert consensus guiding scenario bounds.
Data Validation & Update Cycle
Before sign-off, our team reruns variance tests against independent price indices and livestock output series; anomalies trigger re-contacts with domain experts. Models refresh annually, and material policy or crop shocks prompt interim updates so clients see the latest view.
Why Mordor's Soybean Meal Baseline Earns Trust
Published estimates often diverge because each firm mixes distinct product cuts, price anchors, and update cadences.
Key gap drivers include narrower feed-only scopes, single-country price anchors, or once-off 2023 baselines used by peers, whereas Mordor Intelligence ties values to full global meal output and refreshes every crop year.
Benchmark comparison
| Market Size | Anonymized source | Primary gap driver |
|---|---|---|
| USD 104.23 Bn (2025) | Mordor Intelligence | - |
| USD 124.96 Bn (2024) | Global Consultancy A | Price anchored only on East Asia import CIF values |
| USD 98.7 Bn (2025) | Regional Consultancy B | Excludes industrial and pet-food demand pools |
Public extracts place the market at USD 124.96 billion for 2024 and USD 98.7 billion for 2025, versus our USD 104.23 billion 2025 baseline.
In sum, by pairing transparent scope choices with annually refreshed agronomic and trade inputs, we offer decision-makers a balanced, reproducible baseline they can readily audit and explain.


Key Questions Answered in the Report
What is the current size of the soybean meal market?
The soybean meal market size stands at USD 108.81 billion in 2026 and is set to reach USD 134.83 billion by 2031 at a 4.39% CAGR.
Which region holds the largest share of the soybean meal market?
Asia-Pacific leads with 38.02% of global revenue in 2025 and is also projected to be the fastest-growing region through 2031.
Why is renewable diesel important to soybean meal demand?
Renewable diesel policies boost soybean oil use, incentivizing crushers to expand capacity; the extra oilseed processing generates larger volumes of co-product soybean meal that feed and industrial users absorb.
Which application segment is growing the fastest?
Industrial and bio-based applications of soybean meal are projected to grow at a 5.63% CAGR as bio-lubricants, adhesives, and other renewable products gain traction.
Page last updated on:


