Ozone Generation Market Size and Share
Market Overview
| Study Period | 2020 - 2030 |
|---|---|
| Market Size (2025) | USD 1.69 Billion |
| Market Size (2030) | USD 2.44 Billion |
| Growth Rate (2025 - 2030) | 7.58% CAGR |
| Fastest Growing Market | Asia Pacific |
| Largest Market | North America |
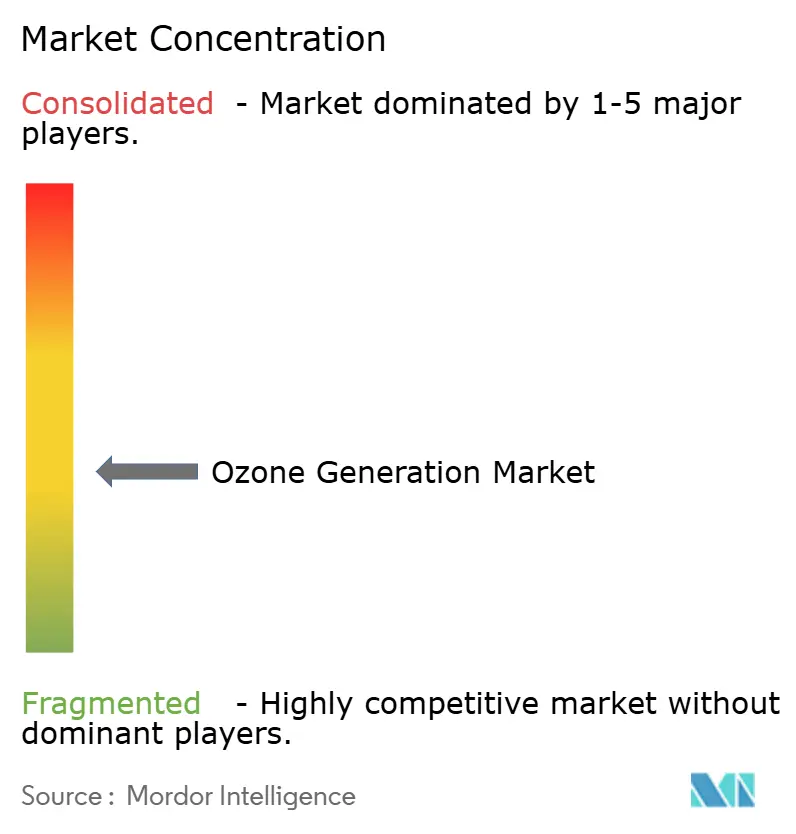
| Market Concentration | Medium |
Major Players *Disclaimer: Major Players sorted in no particular order Image © Mordor Intelligence. Reuse requires attribution under CC BY 4.0. | |

Ozone Generation Market Analysis by Mordor Intelligence
The Ozone Generation Market size is estimated at USD 1.69 billion in 2025, and is expected to reach USD 2.44 billion by 2030, at a CAGR of 7.58% during the forecast period (2025-2030).
Tightening environmental rules, hygiene-centric consumer behavior, and steady innovations in high-efficiency power supplies keep demand upward. Corona discharge systems hold leadership positions in large municipal plants, but electrolytic designs are accelerating in niche point-of-use installations. Clean-label agendas in food, craft beverages, and aquaculture broaden commercial use cases for chemical-free disinfection. Regionally, North America provides the single-largest installed base, while Asia-Pacific has the sharpest growth pace due to urban infrastructure upgrades.
Key Report Takeaways
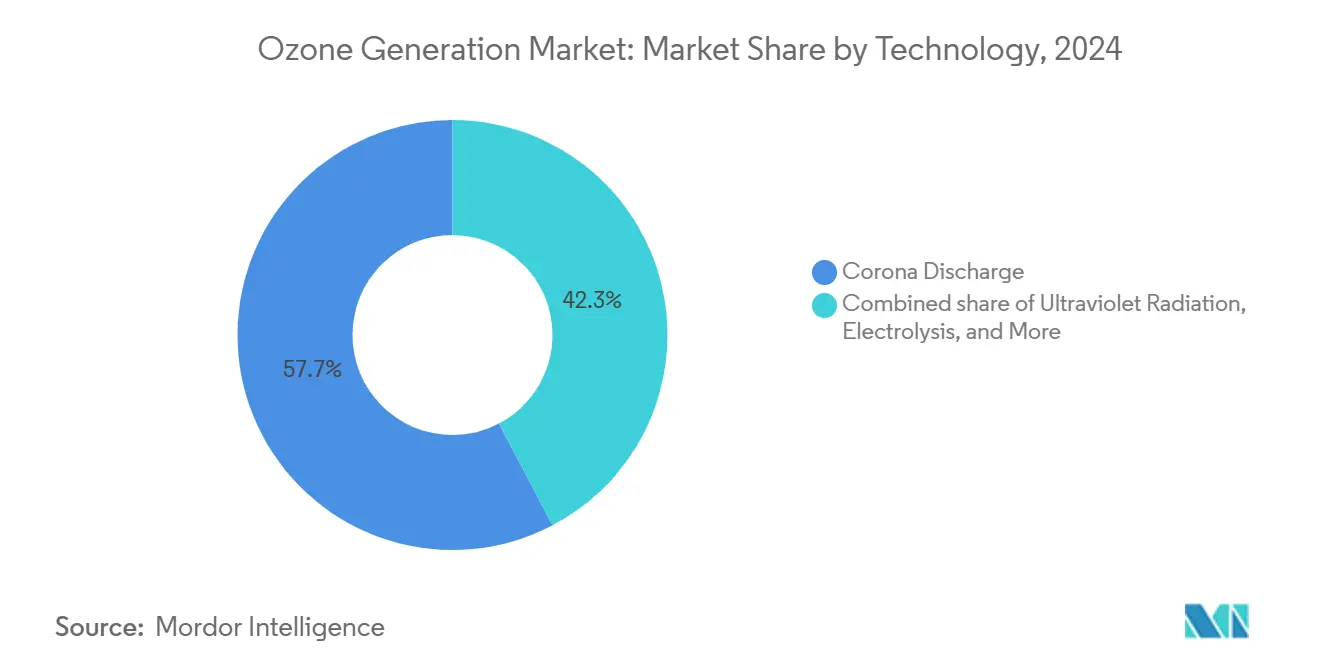
- By technology, corona discharge captured 57.7% of the ozone generation market share in 2024; electrolytic systems are forecast to post a 9.6% CAGR through 2030.
- By application, water treatment accounted for 55.9% of the ozone generation market size in 2024, while food processing is advancing at an 8.9% CAGR to 2030.
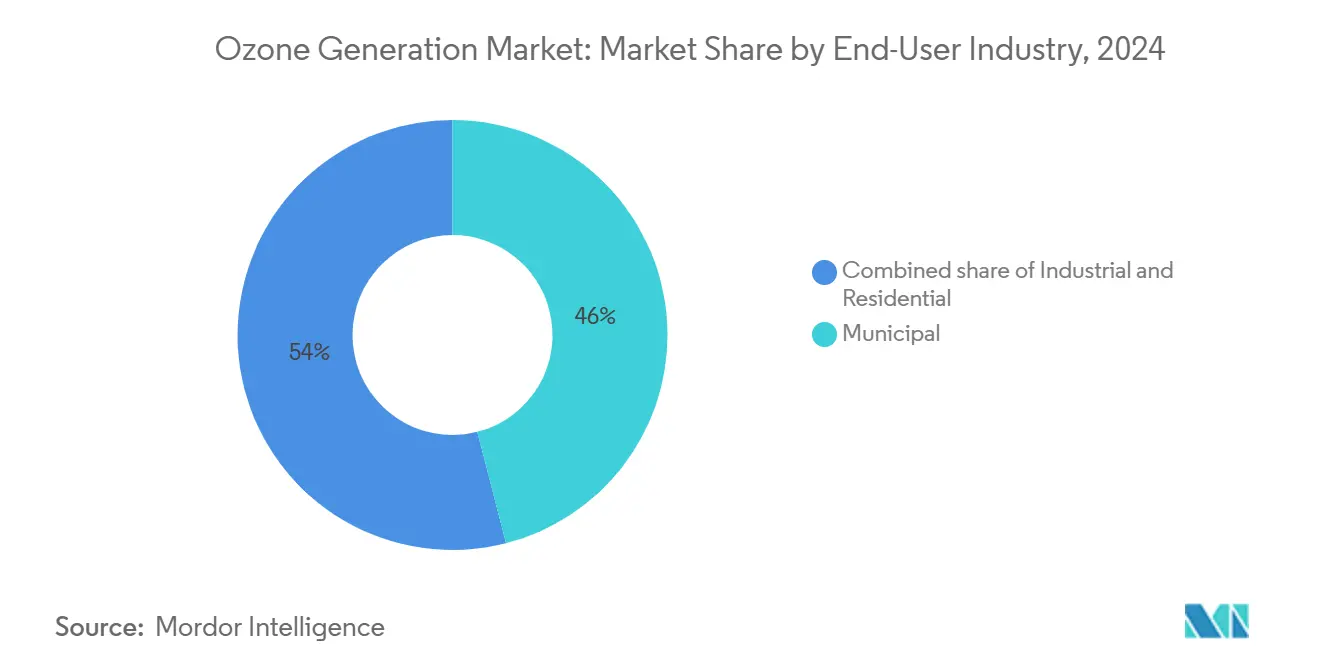
- By end-user, municipal entities held 46.0% of demand in 2024; residential installations are set to rise at an 8.3% CAGR during the outlook period.
- By region, North America led with 39.5% revenue share in 2024; Asia-Pacific is expected to grow at a 9.1% CAGR up to 2030.
Global Ozone Generation Market Trends and Insights
Drivers Impact Analysis*
| Driver | (~) % Impact on CAGR Forecast | Geographic Relevance | Impact Timeline |
|---|---|---|---|
| Stricter wastewater-discharge regulations | +1.1% | North America, European Union, global spillover | Medium term (2-4 years) |
| Growing urban water-scarcity & reuse projects | +0.9% | Asia-Pacific core, Middle East & Africa spillover | Long term (≥ 4 years) |
| Post-COVID demand for safe air purification | +0.8% | Global commercial and institutional buildings | Short term (≤ 2 years) |
| Rise of ozone-nanobubble systems in aquaculture | +0.6% | Asia-Pacific, South America expansion | Medium term (2-4 years) |
| Resonant HV power supplies reduce OPEX | +0.5% | Global, priority in energy-intensive regions | Long term (≥ 4 years) |
| Craft-beverage micro-ozonation | +0.4% | North America, European Union, Asia-Pacific emergence | Medium term (2-4 years) |
| Source: Mordor Intelligence | |||
Stricter Wastewater-Discharge Regulations
Mandates that lower allowable disinfection byproducts in treated effluent push utilities toward ozone because the molecule inactivates pathogens without forming trihalomethanes or chloramines.[1]United States Environmental Protection Agency, “Stage 2 Disinfectants and Disinfection Byproducts Rule,” epa.gov Updated Chinese quotas on ozone-depleting substances clarify compliance and indirectly stimulate local demand for ozone systems, especially in petrochemical and pharmaceutical complexes requiring advanced oxidation for refractory pollutants.[2]Government of China, “Regulations on Ozone-Depleting Substances Management,” gov.cn As facilities retrofit aging chlorination lines, corona discharge units offer drop-in replacements that meet multibarrier treatment targets under variable flow conditions.
Growing Urban Water-Scarcity & Reuse Projects
Roughly 2.7 billion people live with water scarcity each year, and 44% of municipal wastewater runs untreated, prompting megacities to adopt multi-barrier treatment trains that integrate ozone ahead of biologically activated carbon filters. Ozone’s 3,000-times faster disinfection kinetics versus chlorine allow compact reactors that fit space-constrained plants while leaving no harmful residuals, a decisive advantage for direct potable reuse programs. With only 277 U.S. plants producing ozone today out of an estimated 150,000 municipal facilities, untapped municipal potential remains large.
Post-COVID Demand for Safe Air Purification in Buildings
Commercial operators continue installing ozone-ready HVAC coils to neutralize airborne bacteria and odors without expendable filters, evidenced by Dubai International Airport’s large-scale deployment that cut odor-control costs while keeping indoor ozone below the 0.1 ppm OSHA limit. Gaming halls and hospitality venues replicate the model, leveraging real-time sensors and variable-frequency corona modules that match ozone output to occupancy levels. Controlled low-dose cycles achieve 3-log reductions of multidrug-resistant bacteria within minutes, supporting infection-control protocols in healthcare and senior-living facilities.
Resonant High-Voltage Power Supplies Reduce OPEX
Next-generation resonant inverters raise electrical efficiency to 120 g kWh versus 80 g kWh in legacy setups, trimming operating costs by 25-30%, a compelling proposition in regions with high electricity tariffs or carbon pricing. Precision pulsing also minimizes unwanted bromate formation in high-bromide source waters, easing regulatory approvals and broadening addressable markets.
Restraints Impact Analysis*
| Restraint | (~) % Impact on CAGR Forecast | Geographic Relevance | Impact Timeline |
|---|---|---|---|
| High CAPEX & OPEX versus UV/chlorine | -1.4% | Global, especially developing markets | Long term (≥ 4 years) |
| Worker-safety concerns over in-situ O₃ exposure | -0.6% | Global, strictest enforcement in OECD countries | Medium term (2-4 years) |
| Supply-chain risk for BDD electrodes | -0.5% | Global, high-tech fabs concentration | Short term (≤ 2 years) |
| Regulatory scrutiny near rocket-launch sites | -0.2% | Localized clusters in North America and Europe | Long term (≥ 4 years) |
| Source: Mordor Intelligence | |||
High CAPEX & OPEX Versus UV or Chlorine
Corona discharge skids require high-grade stainless piping, precision oxygen feed equipment, and chillers, raising turnkey costs by USD 0.16 per m³ above chlorination in 100 m³ day plants.[3]Government of Newfoundland and Labrador, “Cost Comparison of Disinfection Options for Small Water Systems,” gov.nl.ca Skilled staff must maintain dielectric gaps and calibrate ozone analyzers, further stretching budgets in small utilities. Nonetheless, total cost curves improve under disinfection byproduct penalties, nudging medium-sized municipalities toward hybrid ozone-biofiltration trains.
Worker-Safety Concerns Over In-Situ O₃ Exposure
OSHA fixes an 8-hour permissible exposure limit at 0.1 ppm, and EPA flags ground-level ozone above 0.070 ppm as pollution, compelling operators to install distributed gas detectors and interlock systems that vent units at defined thresholds. These safety upgrades add capital outlays and constrain retrofits in tight mechanical rooms lacking adequate ventilation.
*Our forecasts treat driver/restraint impacts as directional, not additive. The impact forecasts reflect baseline growth, mix effects, and variable interactions.
Segment Analysis
By Technology: Corona Discharge Dominance Faces Electrolytic Challenge
Corona discharge held a 57.7% ozone generation market share in 2024, anchored by proven scalability in large municipal and petrochemical plants. High-dielectric barrier reactors with medical-grade oxygen reliably deliver 12% weight ozone at flow rates topping 500 ppd, satisfying stringent pathogen-removal credits. Cooling jackets and moisture control systems raise complexity, yet lifetime cost advantages persist when plants exceed 2 mgd throughput. The rapid uptake of resonant inverters boosts gram-per-kilowatt productivity, narrowing OPEX gaps with UV.
Electrolytic designs are forecast to register a 9.6% CAGR, riding demand for compact, point-of-use disinfection units in food service and healthcare. Proton-exchange membrane stacks paired with boron-doped diamond anodes produce up to 2.2 mg L⁻¹ at 1 A for 20 hours without performance loss, opening semiconductor wet-bench and ultrapure rinse applications CHEMRXIV.ORG. Lifespan constraints on BDD electrodes and higher kWh kg cost currently restrain broad adoption, but localized manufacturing initiatives reduce supply risk.


By Application: Water Treatment Leadership Challenged by Food Processing Growth
Water treatment commanded 55.9% of the ozone generation market size in 2024 on the back of 277 U.S. plants alone collectively producing more than 600,000 lb day. Advanced oxidation trains pairing ozone with hydrogen peroxide or UV achieve near-complete degradation of pharmaceuticals and endocrine disruptors at residence times under 10 minutes. Growing membrane fouling concerns further elevate ozone pretreatment desirability because short oxidation boosts flux recovery without chemical clean-in-place reagents.
Food processors are expected to grow 8.9% CAGR through 2030 as clean-label initiatives gain momentum. GRAS-recognized ozonated water cuts chemical sanitizer loads, slashes rinse volumes, and extends the shelf life of fresh produce by up to 97.5% mold reduction in citrus test runs. Craft breweries deploy micro-ozonation for keg sanitation and odor-free pipeline flushing, lowering respiratory hazards linked to peracetic acid exposure. These hygiene gains feed adoption beyond premium categories into mainstream dairy and meat plants.
By End-User Industry: Municipal Strength Meets Residential Acceleration
Municipal utility boards retained a 46.0% share of the ozone generation market in 2024, thanks to predictable capital budgets and regulatory pushes to cut disinfection byproducts. Ozone’s proven Cryptosporidium log-reduction credit and strong taste-and-odor control justify system retrofits in cities such as Grand Forks, North Dakota, where two 500 ppd Wedeco SMOevo units went online in 2024.
Residential adoption is projected to increase at an 8.3% CAGR as countertop electrolytic units reach big-box retail shelves. Consumers looking to improve indoor air quality use plug-in ozone diffusers with sensors that maintain safe parts-per-billion ranges. In parallel, aquaculture farms and semiconductor fabs broaden the industrial user base. Nanobubble generators deliver 90% bacterial reductions in intensive ponds, while ultrapure rinse modules in advanced logic fabs demand in-situ electrolytic ozone with low total organic carbon content.
Geography Analysis
North America represented 39.5% of global revenue in 2024, underpinned by mature drinking-water guidelines and replacement cycles for aging chlorination hardware. Under budget, the Anderson Regional Joint Water System completed an ozone-peroxide retrofit in 2024, confirming robust payback via avoided consumer odor complaints. Canadian provinces invest in ozone to cope with taste-and-odor spikes during algal blooms in prairie reservoirs.
Asia-Pacific is forecast to expand at a 9.1% CAGR through 2030 as China, India, and members of ASEAN triple their advanced treatment capacity. Revised Chinese controls on ozone-depleting substances, effective in 2024, streamline domestic equipment approvals and favor local manufacturers. Japanese water boards, early adopters since the 1960s, now retrofit plants with strong ozone water technology that lowers dose by 25% while achieving equal micropollutant removal. India adopts ozone in smart city projects to tackle ammonia and pesticide spikes in river intakes.
Europe maintains steady additions as the Urban Wastewater Directive pushes quaternary treatment for trace organics. Compact ozone-biofiltration blocks suit space-constrained facilities and avoid bromate formation when dosing stays below 1 mg L⁻¹. South America and the Middle East & Africa remain nascent but show promise in aquaculture, desalination pretreatment, and refinery effluent polishing, where chemical-free oxidation aligns with water reuse imperatives.


Competitive Landscape
The ozone generation industry features a moderate concentration of technology vendors that balance broad portfolios with regional specialization. SUEZ (Ozonia), Xylem (Wedeco), and Mitsubishi Electric compete across corona discharge, UV-enhanced, and turnkey oxidation platforms. Mid-tier suppliers such as Pinnacle Ozone and De Nora specialize in tailored skid designs, while startups commercialize nanobubble injectors that integrate with recirculating aquaculture systems.
Recent strategic moves highlight vertical integration. Ovivo’s 2025 partnership with Evocra secures proprietary foam-fractionation and electro-oxidation IP for onsite PFAS destruction, complementing its existing filtration line. JALUX rolled out the O3MAX Water System at Japan Airport Delica in August 2025, bundling ozonation with nanobubble mixing to raise sanitation efficiency in airline catering.
Supply-chain risk around boron-doped diamond electrodes triggers backward integration; Mitsubishi Chemical scales domestic BDD wafer capacity, and several Chinese fabs fast-track pilot lines. Meanwhile, research groups unveil nickel- and antimony-doped tin oxide catalysts that promise higher ozone current efficiencies and corrosion resistance at lower cost.[4]Phys.org, “Tin Oxide Catalysts Boost Electrochemical Ozone Generation,” phys.org Energy-efficient resonant inverters and high-frequency transformers emerge as another competitive differentiator, with several U.S. firms filing patents covering pulse-width modulation sequences that minimize corona back-arcing.
Ozone Generation Industry Leaders
SUEZ (Ozonia)
Xylem (Wedeco)
Mitsubishi Electric
Toshiba Corporation
Metawater Co., Ltd.
- *Disclaimer: Major Players sorted in no particular order

Recent Industry Developments
- August 2025: JALUX began handling Fujifine's products, installing the O3MAX Water System with nanobubble generators at Japan Airport Delica to boost food sanitation efficiency.
- July 2025: Institute of Science Tokyo researchers achieved 91% selectivity for CO₂-to-methanol conversion using a Pd-loaded InGaZnOx catalyst, offering synergy with ozone-assisted carbon capture systems.
- June 2025: Ovivo partnered with Evocra to commercialize ozone foam fractionation for onsite PFAS destruction in North America, citing 90% PFAS removal in landfill leachate pilots.
- May 2025: RainHarvest Systems, a leader in water harvesting, treatment, and reuse technologies, has unveiled its latest line of ozone generators. Tailored for rigorous applications, the Pro series utilizes venturi side stream injection, ensuring accurate dosing and optimal output


Global Ozone Generation Market Report Scope
| Corona Discharge |
| Ultraviolet Radiation |
| Electrolysis |
| Spark Discharge |
| Cold Plasma/Dielectric Barrier Discharge |
| Others |
| Water Treatment |
| Air Purification |
| Food Processing |
| Medical Applications |
| Others |
| Municipal |
| Industrial |
| Residential |
| North America | United States |
| Canada | |
| Mexico | |
| Europe | Germany |
| United Kingdom | |
| France | |
| Italy | |
| NORDIC Countries | |
| Russia | |
| Rest of Europe | |
| Asia-Pacific | China |
| India | |
| Japan | |
| South Korea | |
| ASEAN Countries | |
| Rest of Asia-Pacific | |
| South America | Brazil |
| Argentina | |
| Rest of South America | |
| Middle East and Africa | Saudi Arabia |
| United Arab Emirates | |
| South Africa | |
| Egypt | |
| Rest of Middle East and Africa |
| By Technology | Corona Discharge | |
| Ultraviolet Radiation | ||
| Electrolysis | ||
| Spark Discharge | ||
| Cold Plasma/Dielectric Barrier Discharge | ||
| Others | ||
| By Application | Water Treatment | |
| Air Purification | ||
| Food Processing | ||
| Medical Applications | ||
| Others | ||
| By End-user Industry | Municipal | |
| Industrial | ||
| Residential | ||
| By Geography | North America | United States |
| Canada | ||
| Mexico | ||
| Europe | Germany | |
| United Kingdom | ||
| France | ||
| Italy | ||
| NORDIC Countries | ||
| Russia | ||
| Rest of Europe | ||
| Asia-Pacific | China | |
| India | ||
| Japan | ||
| South Korea | ||
| ASEAN Countries | ||
| Rest of Asia-Pacific | ||
| South America | Brazil | |
| Argentina | ||
| Rest of South America | ||
| Middle East and Africa | Saudi Arabia | |
| United Arab Emirates | ||
| South Africa | ||
| Egypt | ||
| Rest of Middle East and Africa | ||


Key Questions Answered in the Report
What is the global revenue for ozone generation in 2025?
Global sales reach USD 1.69 billion in 2025.
How fast is worldwide demand for ozone generators projected to grow to 2030?
Shipments are forecast to rise at a 7.58% CAGR, pushing revenues to USD 2.44 billion by 2030.
Which ozone-production method is expanding the quickest?
Electrolytic units are expected to log a 9.6% CAGR through 2030 thanks to compact, in-water operation.
Which application currently buys the most ozone equipment?
Water treatment accounts for 55.9% of 2024 shipments.
Which region shows the highest near-term growth potential?
Asia-Pacific is set to advance at a 9.1% CAGR through 2030, lifted by urban water-reuse projects.
What is the top restraint limiting broader adoption?
Higher capital and operating costs versus UV or chlorine remain the main barrier, especially for small utilities.
Page last updated on:


