
Market Overview
| Study Period | 2021 - 2031 |
|---|---|
| Market Size (2026) | USD 113.75 Billion |
| Market Size (2031) | USD 148.46 Billion |
| Growth Rate (2026 - 2031) | 5.47 % |
| Fastest Growing Market | Asia Pacific |
| Largest Market | Asia Pacific |
| Market Concentration | Medium |
Major Players *Disclaimer: Major Players sorted in no particular order Image © Mordor Intelligence. Reuse requires attribution under CC BY 4.0. | |
Air Quality Control System Market Analysis by Mordor Intelligence
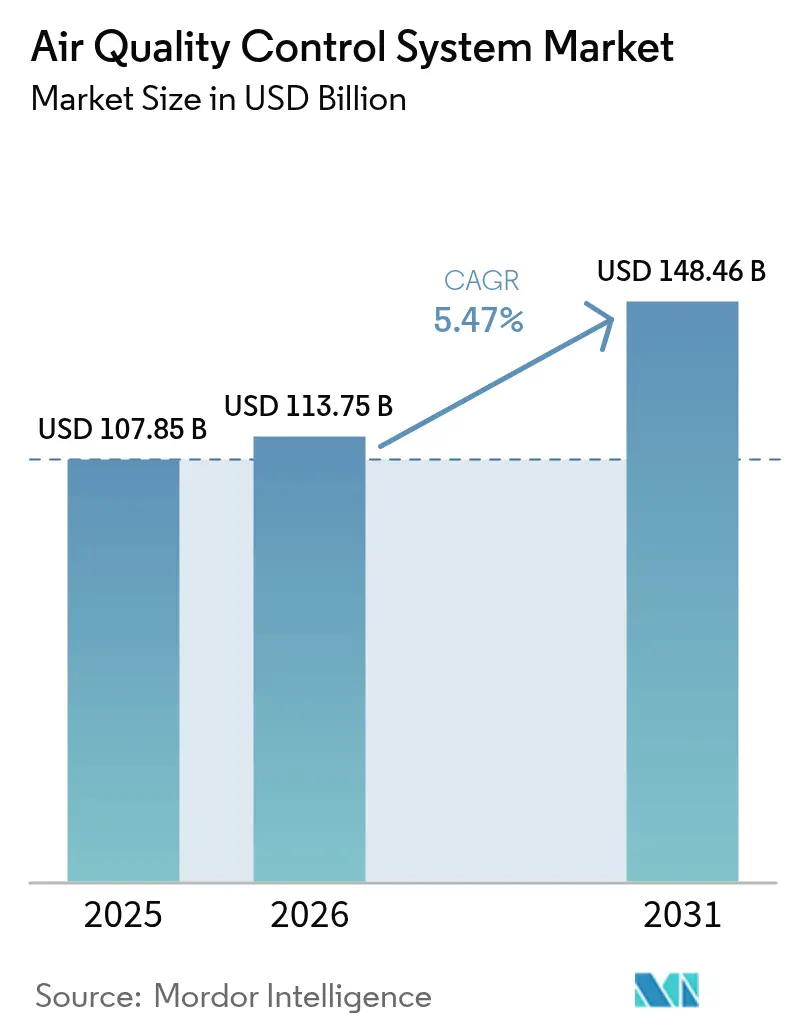
The Air Quality Control System Market size is expected to grow from USD 107.85 billion in 2025 to USD 113.75 billion in 2026 and is forecast to reach USD 148.46 billion by 2031 at 5.47% CAGR over 2026-2031.
This expansion is propelled by tightening cross-border emission standards, a wave of retrofit activity in power and heavy industry worth more than USD 50 billion, and Asia-Pacific’s coal-to-gas transition, creating immediate demand for ultra-low-NOx solutions. Flue-gas desulfurization (FGD) retains its lead as the largest product category, while fabric and ceramic filters emerge as the fastest growing. Hardware still represents the bulk of spending, yet software and analytics segments advance quickly as predictive maintenance lowers operating costs by up to 36% in carbon-capture service. New-build projects dominate volumes, but retrofit work is gaining traction as operators look to extend plant life cycles rather than fund greenfield construction.
Key Report Takeaways
- By product type, flue-gas desulfurization captured 38.60% of the air quality control system market share in 2025, whereas fabric/ceramic filters are projected to register a 5.86% CAGR to 2031.
- By component, hardware commanded 67.20% of the air quality control system market size in 2025, while software and analytics are advancing at a 7.32% CAGR.
- By installation type, new build projects represented 61.30% of 2025 revenue; retrofit and upgrade work is forecast to expand at a 6.55% CAGR to 2031.
- By application, power generation held 54.40% revenue share in 2025; the cement sector is expected to grow fastest with a 6.88% CAGR through 2031.
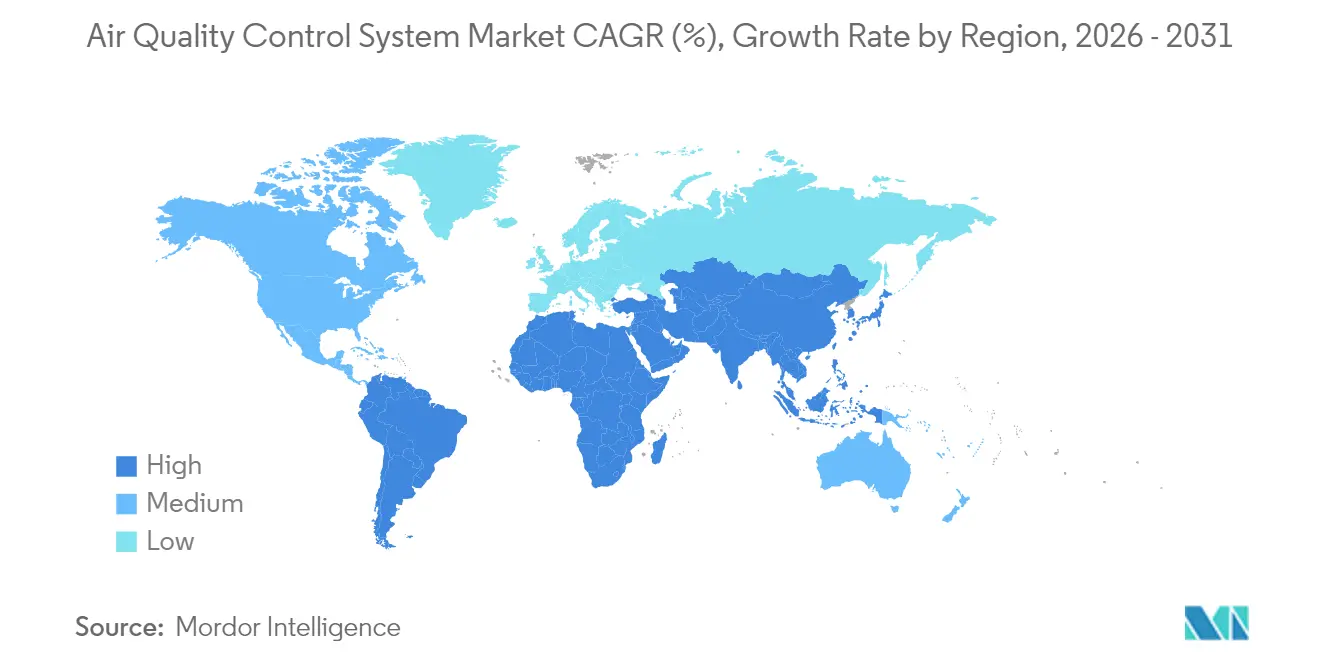
- By geography, Asia-Pacific accounted for 42.70% revenue share in 2025 and is predicted to grow at a 6.02% CAGR, outpacing all other regions.
Note: Market size and forecast figures in this report are generated using Mordor Intelligence’s proprietary estimation framework, updated with the latest available data and insights as of 2026.
Market Trends and Insights
Drivers Impact Analysis of Air Quality Control System Market*
| Driver | ( ~ ) % Impact on CAGR Forecast | Geographic Relevance | Impact Timeline |
|---|---|---|---|
| Stringent trans-continental emission caps (IMO 2020, EU IED) | +1.8% | Global, with concentrated impact in Europe & maritime corridors | Medium term (2-4 years) |
| Coal-to-gas power-mix shift in Asia driving retrofits | +1.4% | Asia-Pacific core, spill-over to emerging markets | Long term (≥ 4 years) |
| Accelerated cement capacity additions in Sub-Saharan Africa | +0.9% | Sub-Saharan Africa, secondary impact in Middle East | Medium term (2-4 years) |
| AI-enabled predictive maintenance cutting OPEX | +0.7% | Global, early adoption in North America & EU | Short term (≤ 2 years) |
| Green-hydrogen fired boilers requiring ultra-low-NOx AQCS | +0.6% | Europe & North America, pilot projects in Asia | Long term (≥ 4 years) |
| Source: Mordor Intelligence | |||
Stringent Trans-Continental Emission Caps Drive Immediate Compliance Investments
The International Maritime Organization’s 2020 sulfur limits and the European Union’s Industrial Emissions Directive have triggered a USD 50 billion compliance-driven spending cycle across shipping, power, and heavy industry.[1] International Maritime Organization, “2020 Global Sulfur Cap,” imo.org Scrubber retrofits typically reach economic break-even inside five years for more than 95% of vessels, yet the associated open-loop wash water has created EUR 680 million in external environmental costs that are steering demand toward closed-loop systems.[2]Chalmers University of Technology, “Scrubber Discharge Externalities,” chalmers.se Complementary regulation, such as the EU F-gas ban on SF6 in switchgear, is accelerating the uptake of clean-air insulated equipment, with Blue GIS technology lowering CO₂ footprints by 30% relative to legacy designs. Spill-over effects now reach cement and steel, where similar intensity targets are prompting holistic air quality control retrofits that bundle particulate, acid-gas, and trace-metal capture in one platform.
Coal-to-Gas Transition in Asia Unlocks Retrofit Opportunities
Asia-Pacific policymakers prioritize coal-plant flexibility over outright retirement, requiring sophisticated emission-control retrofits rather than decommissioning. China’s strategy allows 194-245 GW of incremental renewable penetration and trims transition costs by USD 176 billion by 2030, creating strong demand for systems that tolerate biomass co-firing and green ammonia blends. India’s mandated FGD roll-out already posts SO₂ removal efficiency above 98%, underscoring the business case for large-scale retrofits. LNG has not displaced coal materially, so asset owners are turning to multi-fuel-capable scrubbers and low-NOx burners to comply with tightening norms while dispatching coal capacity.
Accelerated Cement Capacity Additions in Sub-Saharan Africa Create Specialized Demand
Rapid clinker capacity growth across Sub-Saharan Africa spurs a niche segment for high-temperature particulate control. Regional kilns contribute roughly 8% of global CO₂ releases, yet can shave 40% of that footprint by substituting agricultural ash in cement blends. Algeria’s Djelfa relaunch, aimed at 1.8 million t annual output, is typical of new African projects specifying advanced fabric filters plus wet and dry ESPs to manage detached plume and total-organic-carbon challenges. Suppliers can command premium margins owing to harsher operating envelopes and limited local competition for deep-battery fabric filters, high-acid-gas scrubbers, and hybrid precipitators.
AI-Enabled Predictive Maintenance Reduces Operational Expenditure
Artificial intelligence now underpins predictive algorithms that shave 36% off carbon-capture operating costs by optimizing solvent circulation and absorber loading. HVAC pilots have cut downtime 75% and mean-time-to-repair 50% through self-learning fault diagnostics. Real-time IoT networks achieve 99% accuracy in temperature and humidity forecasting, feeding closed-loop controls that keep emissions within permit levels at minimal energy input. Although inference workloads increase site power demand, operators accept the trade-off because payback often arrives within two years through chemical savings and avoided penalties. Vendors that bundle AI dashboards with hardware warranties are gaining clear differentiation against traditional equipment-only offerings.
Restraints Impact Analysis of Air Quality Control System Market*
| Restraint | ( ~ ) % Impact on CAGR Forecast | Geographic Relevance | Impact Timeline |
|---|---|---|---|
| Volatile raw-material prices (stainless steel, catalysts) | -1.2% | Global, acute impact in manufacturing hubs | Short term (≤ 2 years) |
| Declining coal power pipeline in OECD economies | -0.8% | North America & Europe, secondary impact in developed Asia | Medium term (2-4 years) |
| PFAS & secondary pollution concerns for wet scrubbers | -0.4% | Global, regulatory focus in North America & EU | Long term (≥ 4 years) |
| Source: Mordor Intelligence | |||
Volatile Raw-Material Prices and Shrinking OECD Coal Pipeline Compress Equipment Margins
Prices for stainless steel, platinum, and palladium move with geopolitical disruptions in Russia and South Africa, inflating catalyst replacement costs representing up to 60% of selective catalytic reduction lifecycle spend. Simultaneously, the United States and Europe are accelerating coal-plant retirements, narrowing the addressable base for traditional scrubber and ESP installations. Combined, these factors squeeze OEM margins and lengthen buyer decision cycles. Suppliers are countering through hedged procurement, alternative catalyst recipe,s and targeting growth regions where fuel-switch retrofits keep demand robust.
PFAS and Secondary Pollution Concerns Challenge Wet Scrubber Applications
The EPA’s 2024 move to classify PFOA and PFOS as hazardous substances under CERCLA has intensely scrutinized wet-scrubber mist suppressants. Regulators now audit discharge streams for persistent fluorinated compounds that accumulate downstream, forcing owners to install separate treatment or shift toward closed-loop or dry scrubbing. Complementary restrictions appear in Europe, prompting R&D into thermally stable sorbents and high-pressure drop packed towers that avoid PFAS altogether. Despite the compliance burden, operators who adopt next-generation closed-loop absorbers can future-proof assets and cut water use, partially offsetting the upfront capital premium.
*Our forecasts treat driver/restraint impacts as directional, not additive. The impact forecasts reflect baseline growth, mix effects, and variable interactions.
Air Quality Control System Market Segment Analysis
By Type:
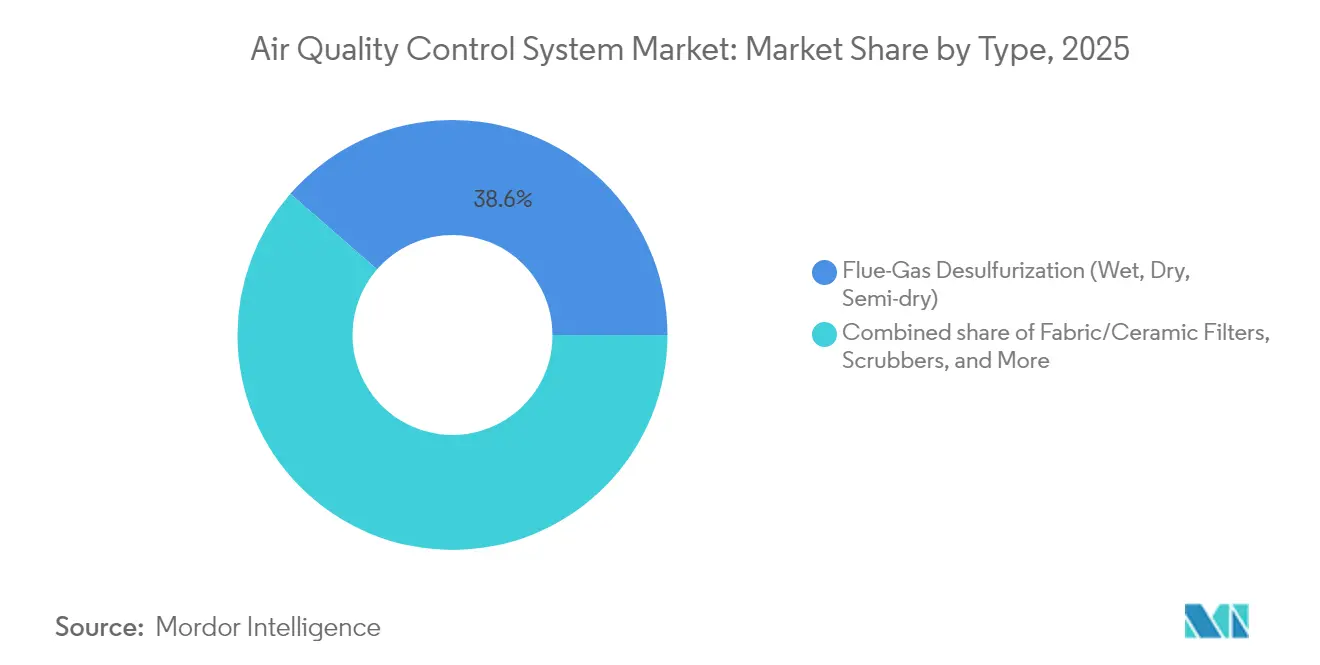
Flue-Gas Desulfurization Dominates Amid Filter InnovationFlue-Gas Desulfurization systems accounted for 38.60% of the air quality control system market 2025. Wet units achieve SO₂ removal beyond 98% in India’s latest projects, while semi-dry designs appeal where water scarcity prevails. Fabric and ceramic filters lead growth at a 5.86% CAGR, favoured for 99% particulate capture and tolerance of gas streams up to 1,800 °C. The air quality control system market size for filtration is forecast to expand steadily as cement and biomass co-firing raise particulate loads.
Product portfolios are also shifting to multi-pollutant architectures. Closed-loop scrubbers mitigate wash-water discharges flagged by EU ports, while emerging SCR variants drive NOx below 30 ppm, meeting ultra-low standards for hydrogen-ready boilers. Though smaller in value, demand for mercury and VOC control modules is rising where integrated limits apply, reinforcing vendor push toward stackable reactor trains.



By Component:
Hardware Dominance Challenged by Software GrowthHardware comprised 67.20% of 2025 revenue, reflecting the cost of reactors, ducting, and induced-draft fans. However, analytics platforms are the fastest mover at 7.32% CAGR, because predictive emission monitoring can deliver 50-80% cost savings against conventional CEMS without sacrificing compliance. Embedded digital twins lower unplanned outages and feed maintenance dashboards that trim parts inventory.
Services also gain weight as long-term operating contracts bundle parts, performance guarantees, and AI-driven insights. As a result, the air quality control system market share for software-plus-services is projected to inch higher each year, compressing the standalone hardware proportion. Suppliers that marry rugged equipment with cloud analytics are building durable switching costs for plant owners.
By Installation Type:
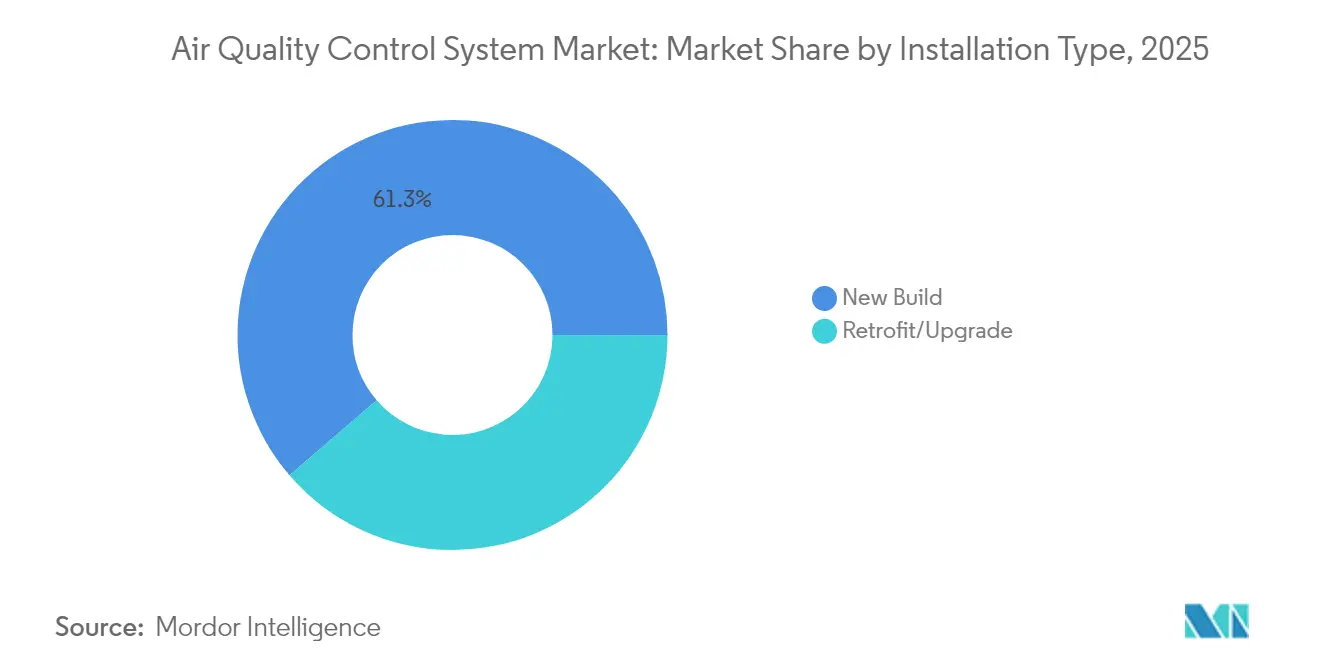
Retrofit Gains Momentum Despite New-Build DominanceNew-build projects still delivered 61.30% of 2025 turnover, fuelled by industrial expansion in Asia and the Middle East. Yet the retrofit slice is growing faster at 6.55% CAGR because upgrading an existing boiler typically demands less capital and faces fewer permitting hurdles. Babcock & Wilcox’s USD 246 million coal-to-gas conversion, covering more than 1,000 MW, illustrates the retrofit economics: fuel switch plus emission controls allow the plant to comply without complete replacement.
Retrofit scopes increasingly include carbon-capture add-ons and AI optimization that were unavailable during original commissioning. Modular reactor skids minimize outage windows, and flanged duct sections expedite tie-ins. Consequently, the air quality control system market size for retrofit packages is expected to edge closer to that of new-builds by the decade’s end, especially in OECD plants facing lifecycle extension mandates.
By Application:
Power Generation Leadership Faces Cement ChallengePower generation held 54.40% of 2025 spending owing to standardized FGD and SCR requirements for coal and combined-cycle stations. Yet the cement chain is charting the quickest rise at 6.88% CAGR, as Sub-Saharan Africa and Southeast Asia add capacity with stringent particulate and acid-gas ceilings. Emerging kiln designs with pre-calciner flue gas recirculation need tailored high-temperature bag filters and dry scrubbers, raising unit values.
Steel, chemicals and waste-to-energy form a solid second tier of demand. For example, steam generators harness off-gas heat in electric-arc furnaces, saving 22.5 kWh per tonne while curbing SO₂ and dust. Dubai’s 2 million tpy waste-to-energy plant also shows how multi-pollutant capture becomes integral to municipal infrastructure. Such diversified end-use broadens opportunities beyond utilities.
Geography Analysis
APAC Air Quality Control System Market
Asia-Pacific’s 42.70% revenue share in 2025 makes it the undisputed leader, with a forecast 6.02% CAGR through 2031. China’s decision to keep coal capacity online for grid flexibility while co-firing biomass and green ammonia drives an extensive retrofit wave for ultra-low-NOx burners and high-efficiency scrubbers. India’s FGD mandate is on track to cut 1.1 million t of SO₂ annually after recent installations reached 98% removal. Region-wide, steel and cement expansions reinforce demand for high-temperature fabric filters and dry sorbent injection, ensuring sustained order flow. Japan and South Korea add technology pull by insisting on best-in-class emission factors, spurring R&D investment by domestic OEMs.
North America and Europe Air Quality Control System Market
North America and Europe form mature yet vibrant retrofit markets. The EU Industrial Emissions Directive and the F-gas phase-out propel swap-outs of legacy switchgear and coal-plant dust collectors with clean-air GIS and SCR-plus-carbon-capture hybrids. In the United States, capacity-conversion projects mirror the Babcock & Wilcox fuel switch, pairing low-NOx burners with predictive emission monitoring to satisfy state permits without abandoning existing sites. Both regions prioritize AI-assisted maintenance and carbon-capture integration, generating high-value service contracts that offset lower volume growth.
MEA and South America Air Quality Control System Market
The Middle East and Africa present the highest upside outside Asia. Dubai’s waste-to-energy complex powers 135,000 homes while proving the case for large-scale flue-gas treatment in solid-waste applications. Sub-Saharan Africa’s clinker entrants need robust baghouses and hybrid ESPs tailored for dusty, high-alkali environments. Algeria’s Djelfa plant, for example, plans 1.8 million t of capacity with a green-cement slant. South America lags in regulatory rigor, yet mining and metals projects embed mercury and acid-gas controls to meet export-market expectations, slowly broadening the installed base.

Regulatory Landscape
Regulation continues to tighten around SOx, NOx, particulates, and hazardous air pollutants across power, industry, and maritime corridors. This is reinforcing demand for multi-pollutant control trains (FGD, SCR/SNCR, filtration, and oxidizers).
In the European Union, Directive (EU) 2024/1785 (revised Industrial Emissions Directive, IED 2.0) entered into force on 4 August 2024. It expanded the scope of regulated activities (including areas such as large-scale battery manufacturing and mining) and is driving more frequent Best Available Techniques (BAT) and BREF updates, which typically translate into faster technology refresh cycles. Ambient air quality policy is also adding pressure on permitting and compliance programs for stationary sources, with the EU Ambient Air Quality Directive 2024/2881 entering into force on 10 December 2024. Its implementation milestones include technical provisions for pollution-reduction measures by 11 June 2026 and a periodic review mechanism by 2030. In maritime emissions, IMO Resolution MEPC.392(82) entered into force on 1 March 2026, designating the Canadian Arctic and the Norwegian Sea as new Emission Control Areas under MARPOL Annex VI. That change supports continued investment in marine scrubbers and low-sulfur compliance solutions for vessels operating on these routes.
Competitive Landscape
Air quality control system market competition remains moderately fragmented, anchored by Mitsubishi Heavy Industries, GE Vernova, and Babcock & Wilcox. These incumbents leverage depth in boilers, turbines, and process engineering to cross-sell scrubbers, ESPs, and carbon-capture modules within integrated packages. Mitsubishi Heavy Industries’ CO₂MPACT™ series now features plug-and-play modules capturing up to 200 t CO₂ per day and dovetails with its hydrogen-ready gas turbines that require sub-15 ppm NOx combustion. GE Vernova strengthens domestic turbine combustion supply through its recent Woodward parts acquisition, ensuring tighter integration between burners and downstream emission gear.
Technology differentiation is intensifying. AI dashboards that predict catalyst deactivation or bag breakage are emerging as must-have add-ons rather than optional extras. ANDRITZ’s February 2025 purchase of LDX Solutions brings wet ESPs and regenerative thermal oxidizers, widening its offerings in North American pulp and waste-to-energy markets. Smaller specialists focus on single-pollutant niches—such as mercury sorbents or PFAS-free mist eliminators—pushing big players toward faster innovation cycles and selective partnering to fill portfolio gaps.
Strategic moves underline the consolidation angle. Mitsubishi Heavy Industries posted a record ¥7,071.2 billion order book in FY 2024, powered by energy-systems wins that bundle emission controls with high-efficiency turbines. Duke Energy’s early-2025 order for up to 11 GE gas turbines exemplifies regional utilities tying equipment supply to domestic manufacturing and decarbonization commitments. Capital markets reward vendors that can pair proven hardware with software ecosystems delivering measurable OPEX savings.
Air Quality Control System Industry Leaders
Mitsubishi Heavy Industries (MHPS)
General Electric (GE Vernova)
Babcock & Wilcox
Siemens Energy
Fujian Longking
- *Disclaimer: Major Players sorted in no particular order

Air Quality Control System Market Companies Covered in this Report
- Mitsubishi Heavy Industries
- General Electric
- Babcock & Wilcox
- Siemens Energy
- Thermax
- Fujian Longking
- Hamon Group
- Andritz
- Ducon Technologies
- GEA Bischoff
- Pure Air Solutions
- Tri-Mer Corporation
- Anguil Environmental Systems
- Durr
- CECO Environmental
- Airex Industries
- Albmarle Mercury Control
- KC Cottrell
- Yara Marine Technologies
- Wartsila

Market Opportunities and Future Outlook
Compliance-driven retrofit scopes are widening beyond traditional coal and heavy-industry stacks into adjacent regulated operations and new process lines. The EU IED 2.0 expansion (Directive (EU) 2024/1785, effective August 2024) brings additional industrial categories into permitting and BAT-linked emission controls. This creates whitespace for modular filtration, acid-gas control, and VOC/oxidation packages that can be deployed beyond the core power-generation installed base.
On the power side, the United States EPA finalized amendments to NSPS for stationary combustion turbines in January 2026 (40 CFR Part 60, subpart KKKKa), anchoring demand for ultra-low-NOx architectures that combine combustion controls with SCR in new-build and upgrade projects. Technology and solution design are also moving toward tighter integration of air pollution control with carbon-management and digital optimization. Predictive maintenance and analytics adoption supports higher-value recurring service contracts as plant owners target measurable OPEX reductions and more stable compliance performance, aligning with the market shift toward software and analytics. Academic progress on electrified and direct-reactive CO2 capture concepts published in 2026, including work demonstrating sustained operation and impurity tolerance over extended runs, points to an emerging capture pipeline that can influence longer-term AQCS design choices, particularly when multi-pollutant trains are being engineered with space, ducting, and controls provisions for future carbon-capture tie-ins.
Recent Industry Developments in Air Quality Control System Market
- January 2026: The US Environmental Protection Agency finalized amendments to the New Source Performance Standards (NSPS) for stationary combustion turbines (subpart KKKKa), tightening NOx requirements and reinforcing best-system pathways that include combustion controls and selective catalytic reduction. The rule update supports near-term demand for turbine-exhaust AQCS upgrades and packaged SCR solutions tied to new turbine installations and major overhauls.
- December 2025: Babcock & Wilcox was awarded a USD 40 million contract to supply advanced low-pressure Wet Gas Scrubbing (WGS) technology to a Canadian petroleum refinery, following an initial USD 10 million order. The award underscores continued refinery spending on sulfur and acid-gas control and highlights how licensed or specialized scrubbing platforms are being scaled through larger follow-on orders.
- April 2024: Babcock & Wilcox won an approximately USD 15 million contract to supply environmental equipment for an industrial facility in the Middle East. The project reflects ongoing investment in emissions-control hardware outside mature OECD power markets, supporting demand for turnkey AQCS packages in industrial expansion regions.


Air Quality Control System Market Report Scope and Research Methodology
Market Definition and Coverage
For this study, the air quality control systems market is defined as the equipment and related services used to remove or reduce air pollutants from industrial and large commercial exhaust streams, mainly to meet emissions limits and improve air quality outcomes.
Scope exclusions: We exclude ambient monitoring networks and lab-only testing instruments when they are sold as standalone solutions without an air pollution control function.
Segments Covered in This Report
- By Type
- Electrostatic Precipitators (Dry & Wet)
- Flue-Gas Desulfurization (Wet, Dry, Semi-dry)
- Scrubbers (Wet, Dry, Marine)
- Selective Catalytic and Non-Catalytic Reduction
- Fabric/Ceramic Filters
- Mercury and VOC Control Units
- By Component
- Hardware (Reactors, Ductwork, Fans)
- Software and Analytics
- Services (O&M, Retrofit)
- By Installation Type
- New Build
- Retrofit/Upgrade
- By Application
- Power Generation
- Cement
- Iron and Steel
- Chemicals and Petrochemicals
- Pulp and Paper
- Waste-to-Energy
- Others (Glass, Mining, etc.)
- By Geography
- North America
- United States
- Canada
- Mexico
- Europe
- Germany
- France
- United Kingdom
- Italy
- Russia
- Rest of Europe
- Asia-Pacific
- China
- India
- Japan
- South Korea
- ASEAN Countries
- Rest of Asia-Pacific
- South America
- Brazil
- Argentina
- Rest of South America
- Middle East and Africa
- Saudi Arabia
- United Arab Emirates
- South Africa
- Egypt
- Rest of Middle East and Africa
- North America
Data Sources, Market Sizing, and Validation
Desk Research
Desk research was used to build the first set of assumptions for demand drivers, regulatory intensity, and end-use activity across major regions. We referred to public sources such as the US EPA rules and emissions inventories, the European Environment Agency publications, UN Comtrade trade statistics, and the World Bank and IEA industrial and energy indicators to understand where pollution control upgrades are being pushed.
To make the model usable at a country and industry level, we also reviewed company annual reports, investor presentations, association websites, and credible news coverage on plant retrofits and compliance timelines. Where needed, we used paid subscriptions for company financials, patent lookups, and shipment-level trade reads to sanity check pricing bands and supplier exposure. The desk research sources listed above are illustrative only, and we also used other public references for data collection, cross-checks, and clarification.
Primary Interviews and Surveys
Primary work focused on interviews and structured surveys with system suppliers, EPC and project engineering teams, plant operators, and maintenance decision-makers, so that assumptions from desk research could be corrected where needed. We also spoke with domain experts across APAC, EMEA, and the Americas to confirm retrofit timing, typical equipment mixes by industry, and how pricing shifts when projects include installation and after-sales services.
Distribution of primary research fieldwork respondents
| Company type | Respondent position | Region |
|---|---|---|
| Top tier: 31% | CXOs: 15% | APAC: 43% |
| Mid tier: 47% | Functional/Unit leaders: 34% | EMEA: 32% |
| Smaller Players: 22% | Managers: 51% | Americas: 25% |
Market-Sizing & Forecasting
Sizing starts with a top-down build where emissions-control demand is reconstructed from industry activity and compliance needs, and then filtered by likely installation and retrofit rates across key end-use plants. To keep the output realistic, we corroborate the result with selective bottom-up checks, including sampled project values from public announcements, supplier revenue exposure by geography, and ASP times volume approximations for high-penetration technologies.
Key inputs used in the model include new-build versus retrofit shares, fuel mix and power capacity additions, cement and steel production trends, tightening timelines for SOx, NOx, particulate, and mercury controls, and typical equipment replacement cycles for filters and scrubbers. When data is thin for smaller countries, we fill gaps using peer-country proxies based on industrial structure, then adjust with interview feedback, which is also where the final totals are typically tuned. Forecasting is done using scenario analysis supported by a small set of measurable drivers, and assumptions are validated with expert views on regulation enforcement and project backlogs.
Data Validation & Update Cycle
Validation is done through multi-step checks that compare model outputs against independent signals such as large project awards, equipment shipment trends, and broad industrial production movement by region. If a country or segment shows an unusual jump, we re-check the input drivers, confirm currency timing, and re-contact a few respondents to determine whether it reflects a real shift or a data artifact.
Before sign-off, a second analyst reviews the calculations and the logic chain so that key assumptions are consistent across regions and end uses. Reports are refreshed annually, and interim updates are made when material events occur, such as new emissions standards, major plant shutdowns, or sharp commodity-driven capex changes. Right before delivery, a final pass is done to ensure clients receive the latest view that can be traced back to clear inputs.
Mordor Intelligence's Global Air Quality Control Systems Market Market Size Versus Other Published Estimates
Published market values for air quality control systems often vary because each publisher draws the scope line differently and uses different timing for currency conversion and base-year updates. In practice, the largest swings typically come from what gets counted as a system sale versus an adjacent service, and whether industrial-only demand is mixed with broader indoor or consumer use cases.
The table points to a spread that is mainly explained by scope and pricing logic. In Mordor Intelligence's model, the total reflects industrial-grade air pollution control equipment plus associated software and services, while avoiding stand-alone indoor air products that can inflate totals. Differences can also show up when another estimate assumes faster retrofit cycles or applies uniform ASP increases, even though pricing and project bundling vary by industry and region.
Benchmark comparison
| Source | Market Size | Gaps in Research Methodology |
|---|---|---|
| Mordor Intelligence | USD 113.75 B (2026) | |
| Global Consultancy A | USD 116.16 B (2025) | Uses a different base year and a wider application lens that blends ambient and indoor product categories with industrial control projects, which can lift the total even before forecasting begins. |
| Industry Publisher B | USD 115.10 B (2024) | Relies on an earlier base year and a broad definition of air quality solutions with limited visibility on retrofit timing and project bundling, which can shift the value when service and equipment lines are not separated consistently. |
Overall, the variance across sources is not just about growth expectations, it is mostly about what is included and how pricing is carried forward from the base year. Our approach stays repeatable by tying totals to plant activity, compliance triggers, and realistic upgrade cycles, and then validating the output with expert feedback and external signals.


Key Questions Answered in the Report
What is the current size of the air quality control system market?
The market reached USD 113.75 billion in 2026 and is projected to climb to USD 148.46 billion by 2031.
Which segment is growing fastest within the air quality control system market?
Fabric and ceramic filters lead growth with a 5.86% CAGR through 2031 due to their 99% particulate capture and high-temperature tolerance.
Why is Asia-Pacific the leading region for air quality control systems?
Asia-Pacific commands 42.70% market share because China and India are driving large-scale retrofit programs and new installations to comply with stringent emission limits.
How are AI and analytics influencing the air quality control system industry?
AI-enabled predictive maintenance is cutting operational expenditure by up to 36% in carbon-capture units and reducing downtime by 75% in HVAC applications.
What are the main restraints affecting market growth?
Volatile prices for stainless steel and precious-metal catalysts, alongside regulatory scrutiny of PFAS in wet scrubbers, are pressuring margins and complicating capital-spending decisions.
Which companies hold significant positions in the market?
Mitsubishi Heavy Industries, GE Vernova and Babcock & Wilcox are among the leading players, with ANDRITZ expanding its presence through acquisitions.
Page last updated on:


 Your data is secure and never sold or shared.


