
Market Overview
| Study Period | 2021 - 2031 |
|---|---|
| Market Size (2026) | USD 35.21 Billion |
| Market Size (2031) | USD 44.11 Billion |
| Growth Rate (2026 - 2031) | 4.61 % |
| Fastest Growing Market | Asia Pacific |
| Largest Market | Asia Pacific |
| Market Concentration | Medium |
Major Players *Disclaimer: Major Players sorted in no particular order Image © Mordor Intelligence. Reuse requires attribution under CC BY 4.0. | |
Air Compressor Market Analysis by Mordor Intelligence
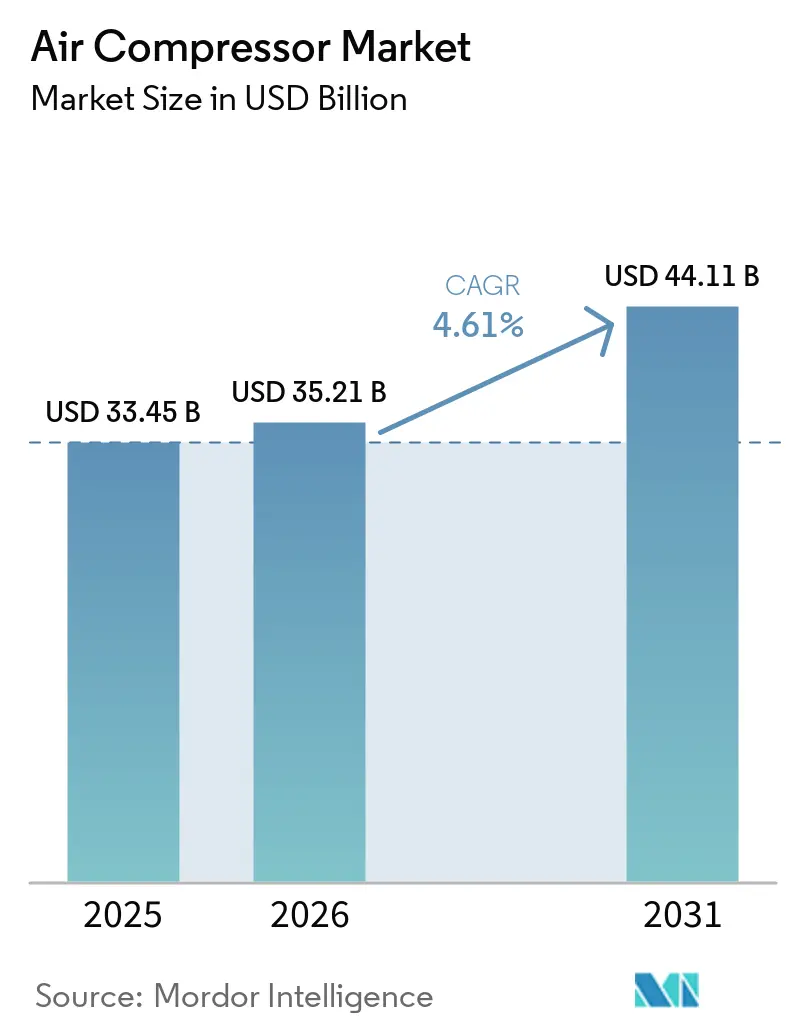
The Air Compressor Market size is projected to be USD 33.45 billion in 2025, USD 35.21 billion in 2026, and reach USD 44.11 billion by 2031, growing at a CAGR of 4.61% from 2026 to 2031.
Growth reflects three structural shifts: electrification rules that push oil-free architectures into purity-sensitive sectors, unprecedented compression demand from LNG and hydrogen build-outs, and post-pandemic manufacturing re-shoring that is lifting North American and European installations. High-capacity units above 500 kW command rising capital allocation as mega-projects in energy transition overshadow incremental upgrades in traditional factories. Technology convergence, oil-free rotary screw meeting centrifugal staging, AI-enabled predictive maintenance, and variable-speed drives continue to reshape supplier value capture toward service and software contracts. Competitive behavior is consolidating around digital offerings and bolt-on acquisitions, while raw-material price swings, grid instability in emerging economies, and a shortage of advanced rotor-design talent temper headline growth.
Key Report Takeaways
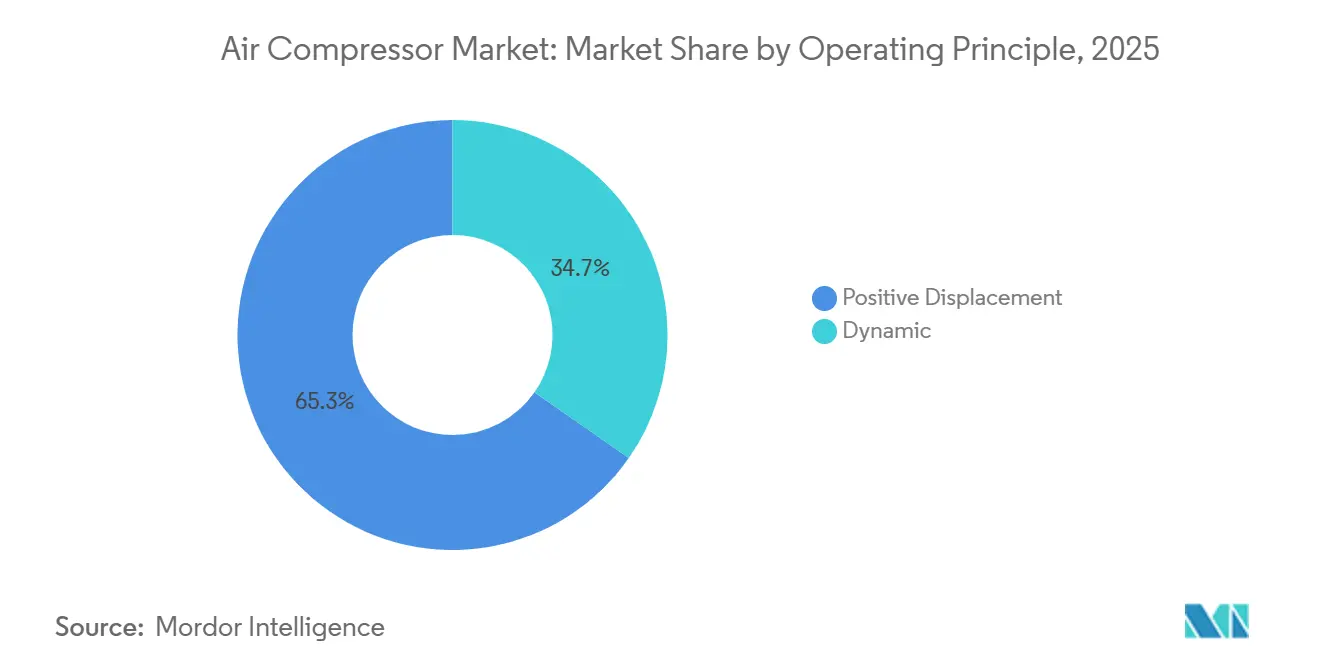
- By operating principle, positive displacement captured 65.3% of 2025 revenue, whereas dynamic compressors are set to expand at a 5.3% CAGR through 2031, the fastest within this segmentation.
- By technology, oil-flooded systems held 61.8% air compressor market share in 2025, while oil-free variants post the highest forecast growth at 5.2% CAGR to 2031.
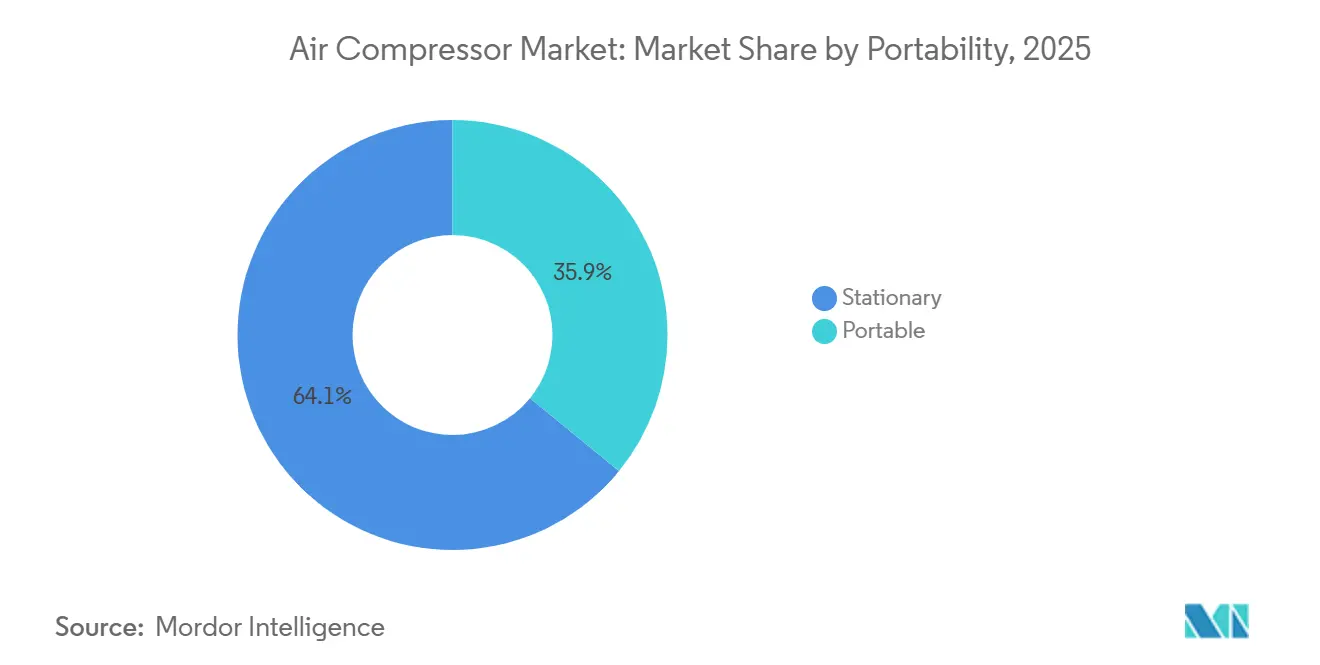
- By portability, stationary units led with 64.1% revenue share in 2025; portable units are projected to advance at a 4.9% CAGR through 2031.
- By cooling method, air-cooled designs represented 78.2% of 2025 sales, yet water-cooled offerings are slated to grow at a 5.1% CAGR on heat-recovery benefits.
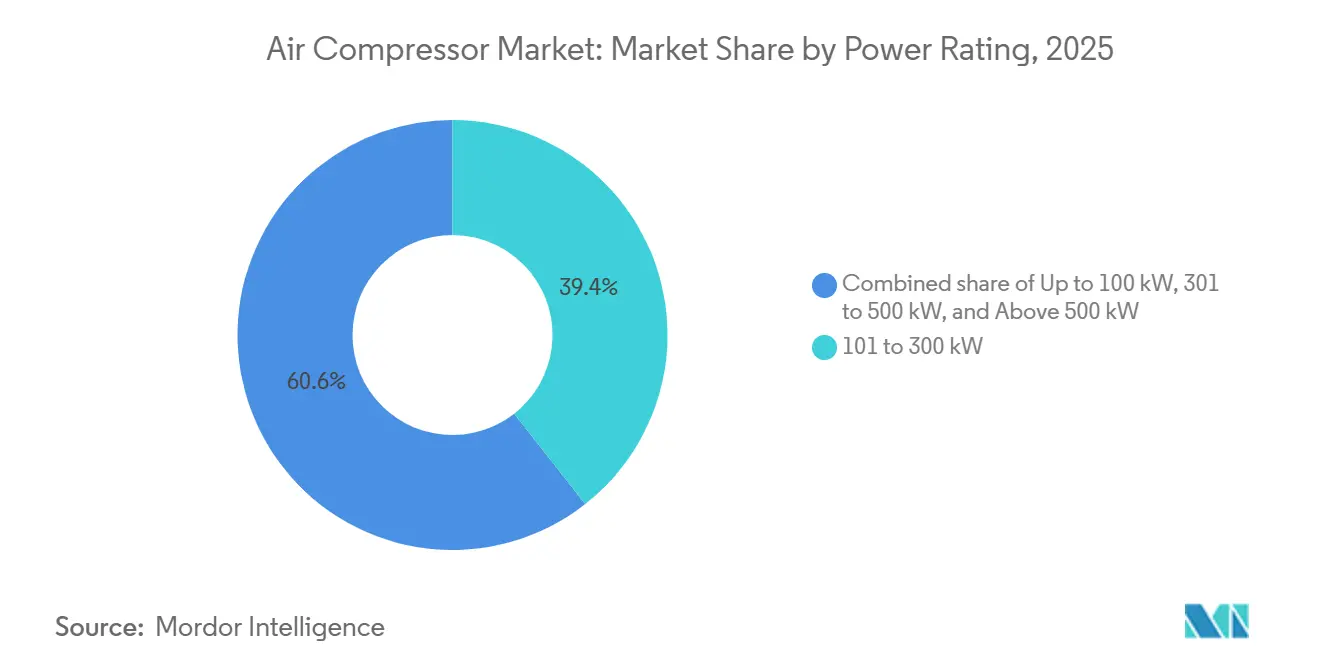
- By power rating, 101 to 300 kW compressors accounted for the largest share of 39.4% in 2025, while compressors above 500 kW are forecast to expand at a 5.8% CAGR, the strongest among all ratings, reflecting LNG, hydrogen, and CCUS mega-projects.
- By end-user, manufacturing held 42.5% revenue share in 2025, while healthcare is expected to register the fastest 7.4% CAGR during 2026-2031.
- Asia-Pacific commanded 43.7% 2025 revenue; North America and Europe together accounted for roughly 45% and will gain from re-shoring and decarbonization incentives.
- Atlas Copco, Ingersoll Rand, Siemens Energy, and Kaeser jointly controlled about 35-40% of 2025 global sales, underscoring a moderately concentrated field.
Note: Market size and forecast figures in this report are generated using Mordor Intelligence’s proprietary estimation framework, updated with the latest available data and insights as of January 2026.
Global Air Compressor Market Trends and Insights
Drivers Impact Analysis*
| Driver | (~) % Impact on CAGR Forecast | Geographic Relevance | Impact Timeline |
|---|---|---|---|
| Electrification-driven demand for oil-free compressors | +0.8% | North America, EU, APAC pharma & semiconductor hubs | Medium term (2-4 years) |
| Surging CAPEX in LNG & hydrogen infrastructure | +1.2% | Middle East, North America, Australia, EU, Asia | Long term (≥ 4 years) |
| Post-COVID re-shoring of manufacturing | +0.6% | North America & Europe | Medium term (2-4 years) |
| Mandatory energy-efficiency regulations | +0.7% | Global, strictest in EU & North America | Short term (≤ 2 years) |
| Rapid adoption of AI-enabled predictive maintenance | +0.5% | Developed markets with IIoT infrastructure | Medium term (2-4 years) |
| Emerging carbon-capture compression skids | +0.4% | EU, North America, China, Australia | Long term (≥ 4 years) |
| Source: Mordor Intelligence | |||


Electrification-driven demand for oil-free compressors
Tightening ISO 8573-1 purity rules in pharmaceuticals, semiconductors, and food packaging shift specifications from oil-flooded to oil-free designs, curbing lubricant disposal costs and aligning with lifecycle-carbon pledges. Cost-sensitive retrofits rely on upgraded filtration, creating a dual-speed adoption path. Battery-electric and hydrogen vehicle lines mandate Class Zero air, propelling oil-free growth above the overall 4.61% market CAGR. OEMs bundle oil-free hardware with energy-management software, strengthening service lock-in.
Surging CAPEX in LNG & hydrogen infrastructure
Global announcements exceed 230 GW of committed electrolyzer capacity by 2030, each gigawatt requiring sizable hydrogen compression for storage, pipeline, and ammonia synthesis.[1]International Energy Agency, “Hydrogen Projects Database 2025,” iea.org LNG export terminals likewise order multi-megawatt centrifugal trains. Honeywell’s USD 1.81 billion purchase of Air Products’ LNG equipment business reinforces an integrated compression-plus-liquefaction play. Specialized materials for high-pressure hydrogen create a profitable niche despite longer project gestation.
Post-COVID Re-Shoring of Manufacturing in North America & Europe
More than 1,800 firms announced U.S. expansions in 2024, moving semiconductor fabs, battery plants, and pharma ingredient sites stateside, each embedding multi-megawatt compressed-air stations according to the Reshoring Initiative. European EV battery corridors in Germany and France mirror the trend. Procurement surges peak between 2026-2028, favoring stationary, high-efficiency machines with predictive-maintenance packages.
Mandatory Energy-Efficiency Regulations for Industrial Equipment
The U.S. DOE’s 2024 rule requires higher integrated energy-efficiency ratios on compressors sold after January 2026, while ISO 50001 certification is now a common supplier gate in Europe.[2] U.S. Department of Energy, “Final Rule: Air Compressor Efficiency Standards,” energy.gov Variable-speed drive (VSD) units cut electricity 20-35% but cost 25-40% more upfront, spurring leasing and pay-per-use models geared to SMEs. OEMs standardize to the toughest jurisdiction, raising baseline efficiency worldwide.
Restraints Impact Analysis*
| Restraint | (~) % Impact on CAGR Forecast | Geographic Relevance | Impact Timeline |
|---|---|---|---|
| High initial cost of variable-speed & oil-free systems | -0.9% | Emerging Asia, Latin America, Africa | Short term (≤ 2 years) |
| Volatility in raw-material prices | -0.6% | Global, rare-earth supply centered in China | Medium term (2-4 years) |
| Grid-power unreliability driving diesel rentals | -0.3% | Sub-Saharan Africa, South Asia, parts of Latin America | Medium term (2-4 years) |
| OEM talent crunch for rotor-profile design | -0.2% | North America & Europe | Long term (≥ 4 years) |
| Source: Mordor Intelligence | |||
High Initial Cost of Variable-Speed & Oil-Free Systems
Variable-speed and oil-free compressors carry capital premiums of 25-50%, discouraging SME buyers in India, Southeast Asia, and Latin America. Although lifecycle savings offset cost for large users, financing gaps and weak leasing ecosystems slow diffusion. Component prices are easing with scale, yet mass-market transition remains beyond the forecast horizon.
Volatility in Raw-Material Prices (Steel, Rare-Earth Magnets)
Steel swings between USD 600-900 per tonne, and China’s NdFeB export quotas caused magnet price spikes in 2024, compressing OEM margins.[3]Financial Times, “Steel and Rare Earth Price Volatility 2025,” ft.com Mid-tier manufacturers lacking hedging tools either absorb costs or risk order deferrals when passing hikes to customers. Nearshoring fabrication and experimenting with ferrite magnets mitigate but do not erase exposure.
*Our forecasts treat driver/restraint impacts as directional, not additive. The impact forecasts reflect baseline growth, mix effects, and variable interactions.
Segment Analysis
By Operating Principle: Dynamics Gain in Process-Intensive Applications
Dynamic compressors are set to capture greater air compressor market share as LNG, hydrogen, and CCUS projects prefer their high throughput and oil-free profiles. Positive-displacement designs still dominated the air compressor market size in 2025, but centrifugal and axial units posted a 5.3% CAGR through 2031. Reciprocating machines remain vital for pressures above 300 bar, especially in hydrogen refueling. Hybrid architectures blending rotary screw and centrifugal stages illustrate the ongoing convergence.
The shift manifests geographically: Gulf LNG export terminals order multi-stage centrifugal trains, while Chinese hydrogen integrators favor oil-free screws for mid-pressure electrolyzer balance-of-plant. The industrial air compressors market size for oil-free segments is set to widen as Class 0 becomes the norm rather than the exception in critical-process industries. Reciprocating demand endures in North American CNG stations and European industrial gases. OEMs expand modular platforms that let customers scale from 5 bar to 350 bar with shared parts inventories, lowering lifecycle cost.


By Technology: Oil-Free Architectures Advance on Purity Mandates
Oil-free units, growing at a 5.2% CAGR, make inroads into pharmaceuticals, food and beverage, and semiconductors as regulatory and liability pressures tighten. Oil-flooded equipment still delivers the bulk of air across the general industry thanks to favorable capex and easy maintenance.
Advances such as water-injected screws and magnetic bearings cut lifecycle friction and expand capacity beyond 500 kW. Semiconductor cleanrooms in Taiwan and Korea now specify oil-free centrifugal machines with air bearings, while European beverage bottlers retrofit with water-sealed screws to eliminate downstream filtration. The coexistence of both technologies will persist as mining and construction continue accepting oil mist with post-filters.
By Portability: Stationary Units Dominate, Portable Climbs on Infrastructure Spend
Stationary machines accounted for nearly two-thirds of 2025 revenue and remain the backbone of fixed plants. Portable compressors, however, are advancing at 4.9% on the back of road, tunnel, and pipeline work across India, Indonesia, and sub-Saharan Africa.
Diesel trailer units dominate rentals, but battery-electric portables are surfacing in European urban zones with strict emission bylaws. Runtime limitations confine them to light duty, yet OEMs are pairing swappable battery packs with solar trickle charging to extend field hours. Stationary fleets benefit most from AI monitoring because permanent network connectivity enables real-time analytics.
By Cooling Method: Air-Cooled Simplicity Versus Water-Cooled Efficiency
Air-cooled models held 78.2% of 2025 shipments owing to lower installation costs and independence from water infrastructure. Water-cooled machines will gain 5.1% CAGR, particularly in data centers and large chemical complexes that value 10-15% higher energy efficiency and heat-recovery potential.
Heat recovered from water-cooled compressors is now fed into district-heating grids in Northern Europe, earning energy-credit revenue streams. Middle Eastern buyers favor air-cooled units to sidestep scarce water but size heat exchangers generously to combat 45 °C ambient peaks. Water-treatment overheads and freeze protection in cold climates keep air-cooled in pole position globally.
By Power Rating: Above-500 kW Units Lead on Mega-Project Demand
Compressors over 500 kW will post the strongest 5.8% CAGR, capturing budget lines in LNG liquefaction, large-scale hydrogen, and CCUS trains. Mid-range 101-300 kW systems remain dominant in automotive and F&B factories, while sub-100 kW units service small workshops.
High-power centrifugal arrays integrate with distributed control systems, enabling load-sharing that trims electricity peaks. Honeywell’s 2024-2025 acquisitions weave coil-wound heat exchangers with custom centrifugal stacks to supply turnkey LNG modules. Data-center growth in the U.S. Midwest is another catalyst; hyperscalers deploy multi-megawatt backup air systems for cooling-tower purge and pneumatic actuators.
By End-User Industry: Healthcare Surges, Manufacturing Matures
Healthcare is projected to grow at a 7.4% CAGR, outpacing all other sectors as hospitals, clinics, and dental chains expand in Asia-Pacific and Latin America. Manufacturing, although still holding 42.5% of 2025 turnover, matures as electrification reduces pneumatic tool intensity.
Medical-air systems mandate ISO 7396-1 redundancy and oil-free designs, driving upgrades in European and North American hospitals built pre-2000. Pharmaceutical plants adopt oil-free, VSD, and AI-monitored packages to safeguard sterile production. Conversely, mining and construction stay reliant on rugged oil-flooded portables, a segment less amenable to digital services.
Geography Analysis
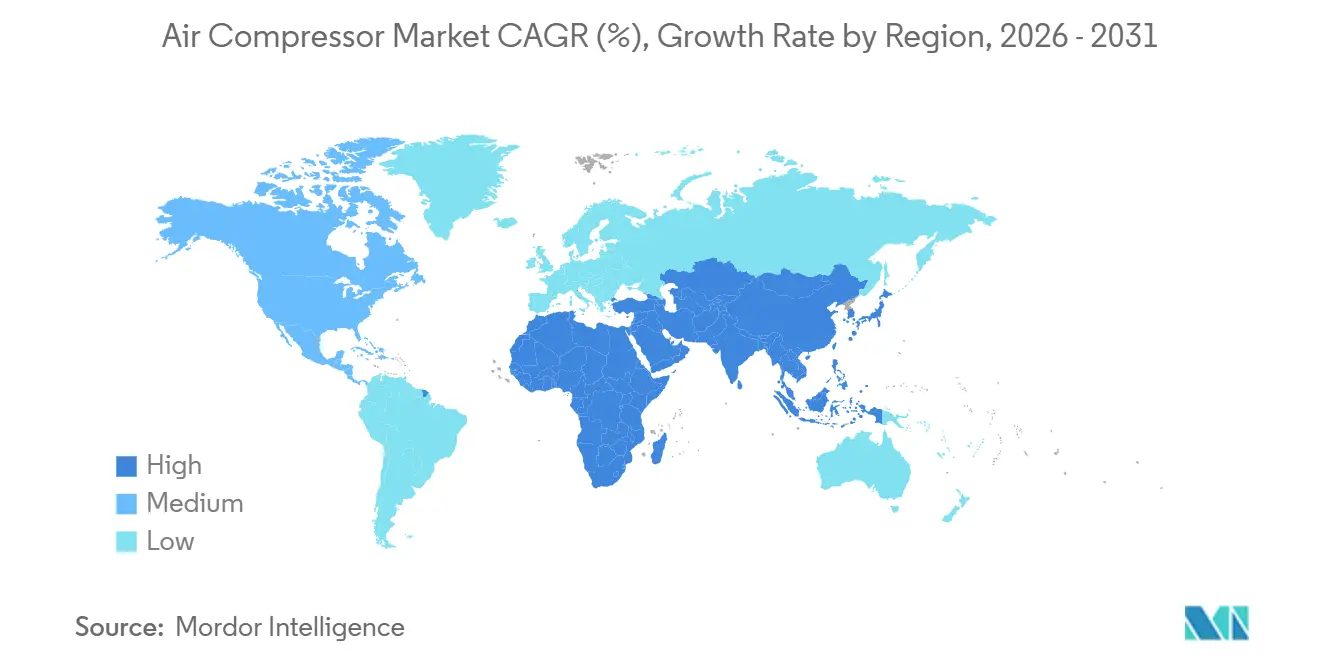
Asia-Pacific anchored 43.7% of the air compressor market in 2025 and is forecast to log a 5.0% CAGR through 2031 on China’s hydrogen build-out and India’s infrastructure blitz. China scales electrolyzer output toward 165 GW per year, embedding vast centrifugal and screw demand, while India’s highways and metro rail drive portable rentals. Japan and South Korea emphasize ultra-clean oil-free compressors for chips and fuel-cell vehicles, paying a premium for magnetic bearings and silicon-carbide VSD drives.
North America controlled about one-quarter of 2025 revenue as re-shoring, LNG terminals on the Gulf Coast, and hyperscale data centers multiply stationary installations. Section 45Q tax credits stimulate CCUS projects in the U.S. Midwest, pulling orders for multi-stage CO₂ compression. Canada leverages hydrogen strategy funding to retrofit Alberta oil-sands operations with low-carbon hydrogen, requiring high-pressure reciprocating units. Mexico’s nearshoring inflows spur mid-size stationary purchases and diesel portables for rapid plant construction.
Europe held a roughly 20% share, led by Germany, France, and the Nordics, pushing green-hydrogen and CCUS pilots.[4]European Union Clean Energy Technology Observatory, “CCUS Funding Landscape 2025,” op.europa.eu EU ISO 50001 procurement rules accelerate VSD adoption. Eastern Europe attracts EV battery production, embedding oil-free specifications into gigafactory designs. The region also pioneers water-cooled compressors linked to district-heating loops, improving project ROI.
South America, plus the Middle East and Africa, made up about 10% of the 2025 spend. Brazil’s pre-salt fields and Argentina’s lithium mines underpin heavy-duty portable demand, while Qatar and UAE LNG export expansions specify large centrifugal trains. Africa’s grid unreliability sustains diesel portables for mining and construction. Weak IIoT coverage delays AI-based maintenance adoption in these regions.

Regulatory Landscape
Energy-efficiency rules are tightening around packaged compressor performance and test-method compliance, with the United States a near-term anchor. Under the US Department of Energy (DOE) Energy Conservation Program, minimum efficiency requirements under 10 CFR 431.345 became mandatory for covered air compressor equipment, with enforcement tied to manufacturer certification and civil penalties for noncompliance; DOE also updated related test-procedure rules through Federal Register actions in 2025, which affects how OEMs demonstrate compliance for each basic model.
Global buyers also point to international standards that shape procurement specifications across jurisdictions. ISO 22484:2024 (published November 2024) sets a performance test code for electric-driven low-pressure air compressor packages, supporting comparability of efficiency claims and reinforcing the shift toward variable-speed, higher-efficiency architectures when bids are evaluated on lifecycle energy cost and auditability.
Competitive Landscape
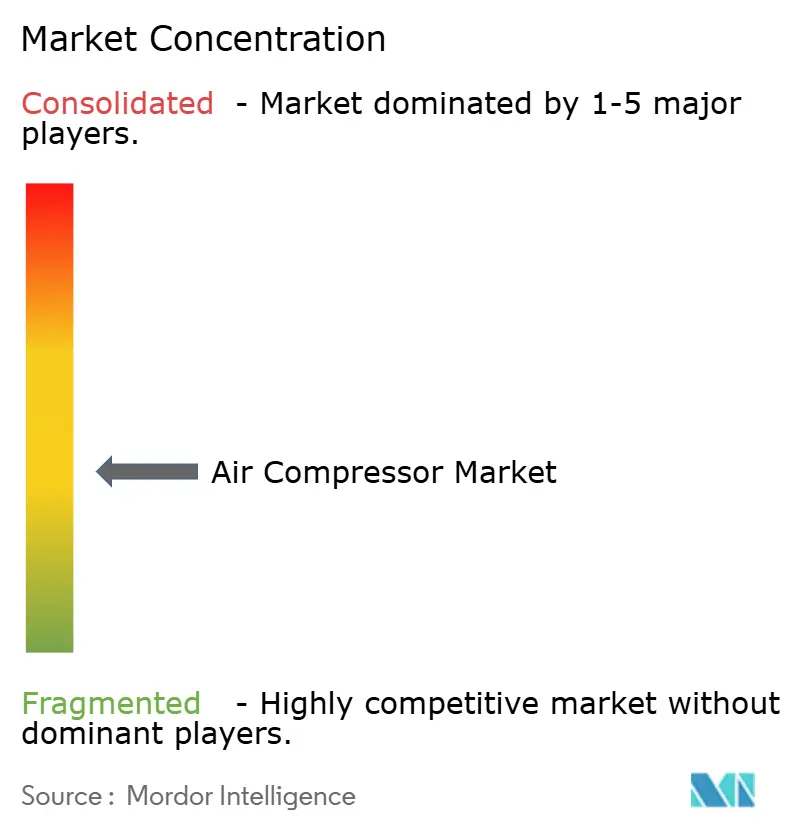
The air compressor market exhibits moderate concentration: Atlas Copco, Ingersoll Rand, Siemens Energy, and Kaeser jointly control an estimated 35-40% global revenue. Atlas Copco executed 15 service-network acquisitions during 2024-2025, extending reach in Brazil, Europe, and Asia and embedding SMARTLINK analytics into legacy fleets. Honeywell spent USD 3.97 billion acquiring Sundyne and an LNG equipment unit, carving an integrated compression-liquefaction niche that aligns with its Forge digital suite. Siemens’ 2024 purchase of ebm-papst industrial drives strengthens its mechatronics play, potentially substituting pneumatics with electric actuators in intralogistics.
Chinese challengers such as Kaishan leverage cost efficiencies and domestic hydrogen demand to win contracts in price-sensitive markets. Software specialists ABB and AspenTech offer vendor-agnostic predictive-maintenance platforms, commoditizing hardware and shifting profits to analytics. Competitive vectors coalesce around data ownership, energy-performance guarantees, and lifecycle service bundling rather than headline equipment cost.
Air Compressor Industry Leaders
Atlas Copco Group
Ingersoll Rand Inc.
Hitachi Global Air Power (Sullair)
Gardner Denver Industries
Kaeser Kompressoren SE
- *Disclaimer: Major Players sorted in no particular order

Market Opportunities and Future Outlook
Near-term whitespace is concentrated in compliance-led retrofit and replacement cycles where operators need measurable, auditable energy performance rather than incremental hardware swaps. The US DOE minimum efficiency framework (10 CFR 431.345) and related test-procedure updates are pushing plants to adopt integrated controls and higher-efficiency drive trains, including advanced VSDs and permanent-magnet motors, with system-level optimization to meet required isentropic efficiency thresholds while limiting production risk during upgrades.
A second opportunity area is software-led optimization and heat-integration that reduces specific energy consumption under real operating profiles, expanding the service and controls revenue pool for OEMs and platform vendors. Published 2026 research on data-driven load forecasting and compressor scheduling reports a 9.26% reduction in specific energy consumption in nonlinear industrial air systems using higher-quality operating datasets, and 2026 thermodynamic work on intermediate-stage waste-heat utilization in multi-stage centrifugal compression highlights further efficiency gains through heat recovery and stage optimization. These findings support continued demand for telemetry-ready compressors, digital twins, and engineered heat-recovery packages, particularly in large stationary installations where continuous monitoring and control changes translate into lower electricity cost and improved emissions accounting.
Recent Industry Developments
- May 2026: Atlas Copco acquired LVC Solutions N.V., a Belgian compressed air distributor based in Genk. The deal expands Atlas Copco’s local sales and service footprint in a mature European market where uptime-driven service contracts and fleet connectivity upgrades are key differentiators.
- July 2025: Hitachi Global Air Power launched the Sullair OFE1550 oil-free electric portable air compressor, positioning it around zero-emissions operation and Class 0 air quality for job sites. The launch broadens the addressable market for portable compressors in indoor, noise-sensitive, and emissions-restricted environments where diesel units face operating constraints.
- March 2024: Hitachi Global Air Power introduced the Sullair TS 190-260 Series two-stage rotary screw air compressors aimed at improving energy efficiency for industrial compressed-air stations. The release supports lifecycle-cost selling and provides an upgrade pathway for plants targeting lower electricity consumption without moving to more complex compressor architectures.


Research Methodology Framework and Report Scope
Market Definition and Coverage
This market covers the revenue generated from air compressors sold for industrial, commercial, and construction uses, including stationary and portable units, across major regions. It includes common technologies such as positive displacement and dynamic compressors, and it counts sales at the equipment level.
Scope exclusions: The sizing does not count compressed air treatment accessories, plant air piping, and standalone service labor unless it is bundled with compressor equipment sales.
Segmentation Overview
- By Operating Principle
- Positive Displacement
- Reciprocating
- Rotary Screw
- Rotary Vane
- Dynamic
- Centrifugal
- Axial
- Positive Displacement
- By Technology
- Oil-Flooded
- Oil-Free
- By Portability
- Stationary
- Portable
- By Cooling Method
- Air-Cooled
- Water-Cooled
- By Power Rating
- Up to 100 kW
- 101 to 300 kW
- 301 to 500 kW
- Above 500 kW
- By End-User Industry
- Manufacturing
- Oil and Gas
- Power Generation
- Chemicals and Petrochemicals
- Mining and Construction
- Food and Beverage
- Healthcare
- Others
- By Geography
- North America
- United States
- Canada
- Mexico
- Europe
- Germany
- United Kingdom
- France
- Italy
- NORDIC Countries
- Russia
- Rest of Europe
- Asia Pacific
- China
- India
- Japan
- South Korea
- ASEAN Countries
- Rest of Asia Pacific
- South America
- Brazil
- Argentina
- Rest of South America
- Middle East and Africa
- Saudi Arabia
- United Arab Emirates
- South Africa
- Egypt
- Rest of Middle East and Africa
- North America
Data Sources, Market Sizing, and Validation
Desk Research
Desk work starts with building a fact base on where compressors are used and what drives replacement and new installs. We rely on public sources such as the US Energy Information Administration for industrial energy signals, the US Census Bureau for manufacturing activity, Eurostat for industrial output trends, and UN Comtrade for trade flows that help sanity-check shipment direction by region. For product context, we also review standards and guidance from organizations such as ISO and ASME, along with peer reviewed engineering journals that describe efficiency classes and duty-cycle behavior.
On top of that, company annual reports, investor presentations, and credible industry press are used to map product portfolios and track pricing and efficiency claims over time. For gaps like private company scale, we selectively use paid subscriptions for company financials and intelligence, patent databases, and shipment level import and export datasets. These inputs help validate directionality rather than replace analyst judgment. The sources listed here are illustrative only, and many other public references were used for data collection, cross-checking, and clarifying assumptions.
Primary Interviews and Surveys
Primary work is used to test what we built from public data, especially around mix shifts between oil-free and oil-flooded units, portable demand tied to construction cycles, and how energy-efficiency upgrades influence buying timing. We interview and survey a spread of manufacturers, distributors, service partners, and large end users across APAC, EMEA, and the Americas, so assumptions on pricing, utilization, and replacement cycles get validated in real operating conditions.
Distribution of primary research fieldwork respondents
| Company type | Respondent position | Region |
|---|---|---|
| Top tier: 32% | CXOs: 12% | APAC: 42% |
| Mid tier: 54% | Functional/Unit leaders: 28% | EMEA: 31% |
| Smaller Players: 14% | Managers: 60% | Americas: 27% |
Market-Sizing & Forecasting
Sizing is built using top-down and bottom-up logic, with the demand pool reconstructed from industry activity and then cross-checked using supplier and channel signals. We first link compressor demand to measurable drivers like industrial production indices, construction output, and plant expansion activity, and then allocate that demand across compressor categories using split factors informed by desk research and interviews. We then convert the implied unit demand by region and major use cases into a revenue view by applying realistic average selling prices.
To keep the model grounded, we use practical inputs such as the share of portable versus stationary installations, the penetration of oil-free compressors in food, beverage, healthcare, and electronics, typical power rating mix (for example, up to 100 kW versus higher bands), and replacement cycles that vary by duty intensity and maintenance practices. Bottom-up checks are applied through sampled price points, distributor feedback on order books, and selective rollups of visible supplier revenues in compressors, which helps us adjust for double counting and for imported equipment that does not match local production trends. Where data is thin, the gap is handled using proxy indicators like trade growth, regional manufacturing capex direction, and interview-led mix assumptions, and then those proxies are tested again with at least two independent signals.
Forecasting uses a multivariate regression setup because demand moves with more than one driver, and scenario analysis is used to stress-test energy-cost sensitivity and construction-cycle swings. Expert inputs help lock the forward path for variables like industrial output growth, efficiency regulation pull, and the pace of oil-free adoption, and those variable paths shape the revenue curve.
Data Validation & Update Cycle
Validation is handled through a set of checks that compare model outputs against independent market signals, and then inconsistencies are investigated before sign-off. We review unusual jumps in ASP, regional trade mismatches, and share splits that drift too far from what interviews and public filings suggest, and then the assumptions are reworked until the story and numbers align. When a material variance remains, follow-up outreach is triggered with respondents closest to that part of the value chain.
The report is refreshed on an annual cycle, and interim updates are made when major events can change demand, such as energy price shocks, large infrastructure programs, or regulation updates on efficiency and emissions. Before delivery, a final analyst review is performed so clients get an updated view that matches the latest available public releases and primary feedback.
Mordor Intelligence's Air Compressor Market Size Compared Against Other Published Estimates
Published numbers for the air compressor market can differ even when the topic name looks the same, because the included product basket and the timing of assumptions are not consistent across sources. In our checks, most gaps come from how adjacent items are treated, which year is used as the anchor, and how price and mix shifts are carried into the forecast.
Compressed air treatment equipment such as dryers and filters sits outside the market scope used in Mordor Intelligence here, which removes a common add-on revenue bucket that some estimates appear to keep inside their totals. Differences also come from whether portable units are counted only as compressor equipment or combined with engine and rental value, and from how oil-free adoption is priced over time as efficiency standards tighten. Currency conversion timing and refresh cadence can further widen the spread, especially when industrial production and construction cycles change direction quickly.
Benchmark comparison
| Source | Market Size | Gaps in Research Methodology |
|---|---|---|
| Mordor Intelligence | USD 35.21 B (2026) | |
| Industry Publisher A | USD 26.70 B (2024) | Uses an earlier base year, and the scope signals suggest a broader packaged view in some cuts, which can shift totals when portable demand and power-band mix are changing year to year. |
| Global Research Publisher B | USD 27.75 B (2025) | Anchors the estimate in 2025 and may apply a different pricing progression across lubrication types and power ranges, which can compress the starting value even if the long-run growth rate looks similar. |
Looking across the three figures, the spread is mainly explained by what is counted as part of an air compressor sale, plus the choice of base year and how mix and pricing are moved forward. By keeping inclusions tied to equipment revenue and then validating the totals with trade, activity indicators, and interview feedback, the final number stays traceable to clear drivers and repeatable steps.


Key Questions Answered in the Report
How large is the global air compressor market in 2026?
The air compressor market size is estimated at USD 35.21 billion in 2026, tracking the 4.61% CAGR toward USD 44.11 billion by 2031.
Which segment is growing fastest within air compressors?
Healthcare demand for medical-air systems is expanding at roughly 7.4% CAGR, outpacing every other end-user.
Why are oil-free compressors gaining traction?
Stricter purity rules in pharmaceuticals, semiconductors, and food processing mandate Class Zero air, pushing oil-free architectures that avoid hydrocarbon contamination.
What role does hydrogen play in future compressor demand?
Committed electrolyzer capacity exceeding 230 GW by 2030 will require multi-megawatt hydrogen compression, making it a key long-term growth driver.
How are suppliers differentiating beyond hardware?
Leading OEMs bundle AI-enabled predictive maintenance and performance-guarantee contracts, shifting revenue toward software and lifecycle services.
Which regions show the highest growth potential?
Asia-Pacific leads in absolute growth, while North America benefits from re-shoring and CCUS incentives, and Europe drives demand through hydrogen and efficiency regulations.
Page last updated on:


 Your data is secure and never sold or shared.


