
Industrial Air Pollution Control Solutions Market Size and Share
Market Overview
| Study Period | 2021 - 2031 |
|---|---|
| Market Size (2026) | USD 88.18 Billion |
| Market Size (2031) | USD 116.46 Billion |
| Growth Rate (2026 - 2031) | 5.72 % |
| Fastest Growing Market | Asia Pacific |
| Largest Market | Asia Pacific |
| Market Concentration | Medium |
Major Players *Disclaimer: Major Players sorted in no particular order Image © Mordor Intelligence. Reuse requires attribution under CC BY 4.0. | |
Industrial Air Pollution Control Solutions Market Analysis by Mordor Intelligence
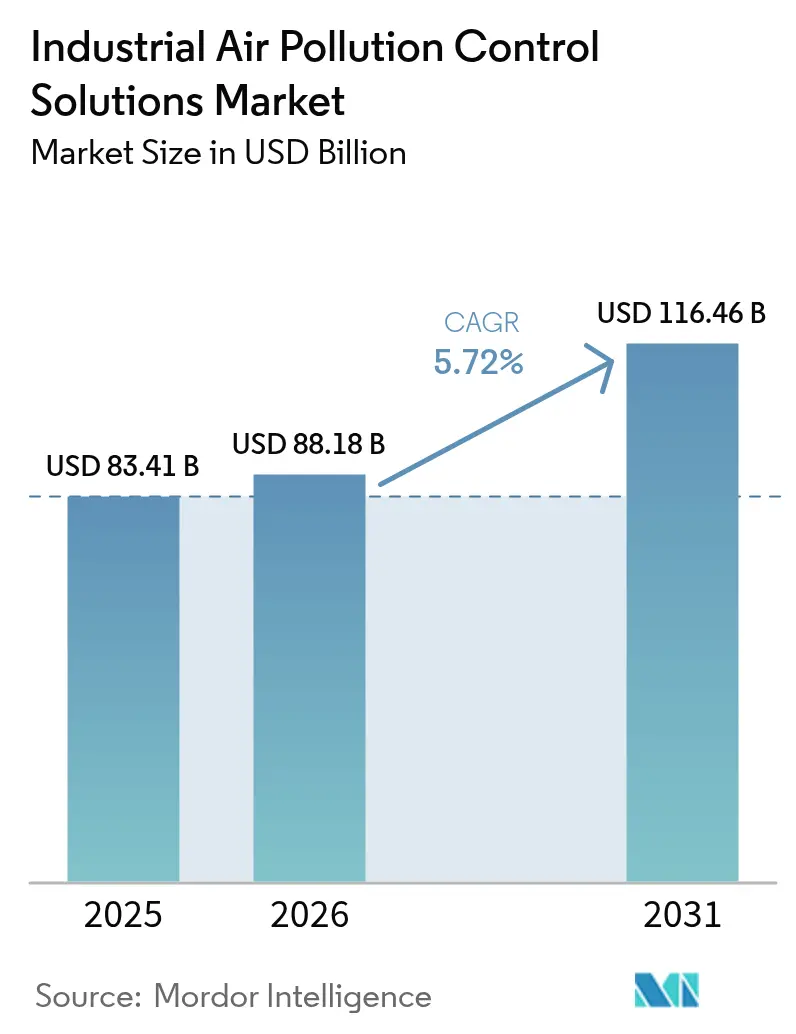
The Industrial Air Pollution Control Solutions Market size market is expected to grow from USD 83.41 billion in 2025 to USD 88.18 billion in 2026 and is forecast to reach USD 116.46 billion by 2031 at 5.72% CAGR over 2026-2031.
Momentum is anchored in synchronized policy tightening, particularly across Asia-Pacific, North America, and Europe, and in the rapid diffusion of hybrid technologies that bundle particulate, sulfur oxide, and nitrogen oxide abatement within one footprint. Large utility retrofits, the build-out of waste-to-energy assets, and the growing adoption of AI-aided optimization platforms have combined to pull forward capital spending, while modular packages enable smaller industrial users to comply without lengthy outages. In parallel, net-zero industrial clusters are transitioning from single-pollutant upgrades to integrated emission control solutions, accelerating replacement demand for legacy equipment. These shifts and a widening base of predictive-maintenance service contracts give the industrial air pollution control solution market a stable multiyear growth runway despite cyclical swings in heavy-industry output.
Key Report Takeaways
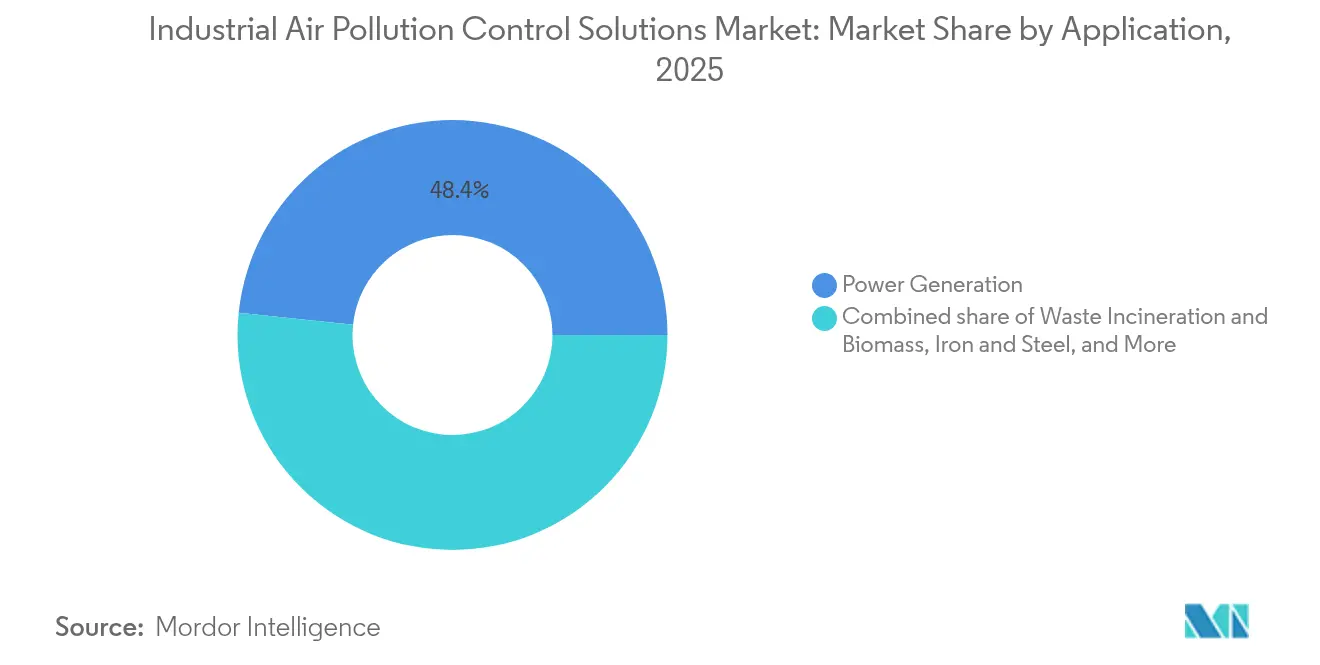
- By technology, electrostatic precipitators held 34.62% of the industrial air pollution control solution market share in 2025, whereas selective catalytic reduction systems are projected to outpace the field at a 7.79% CAGR through 2031.
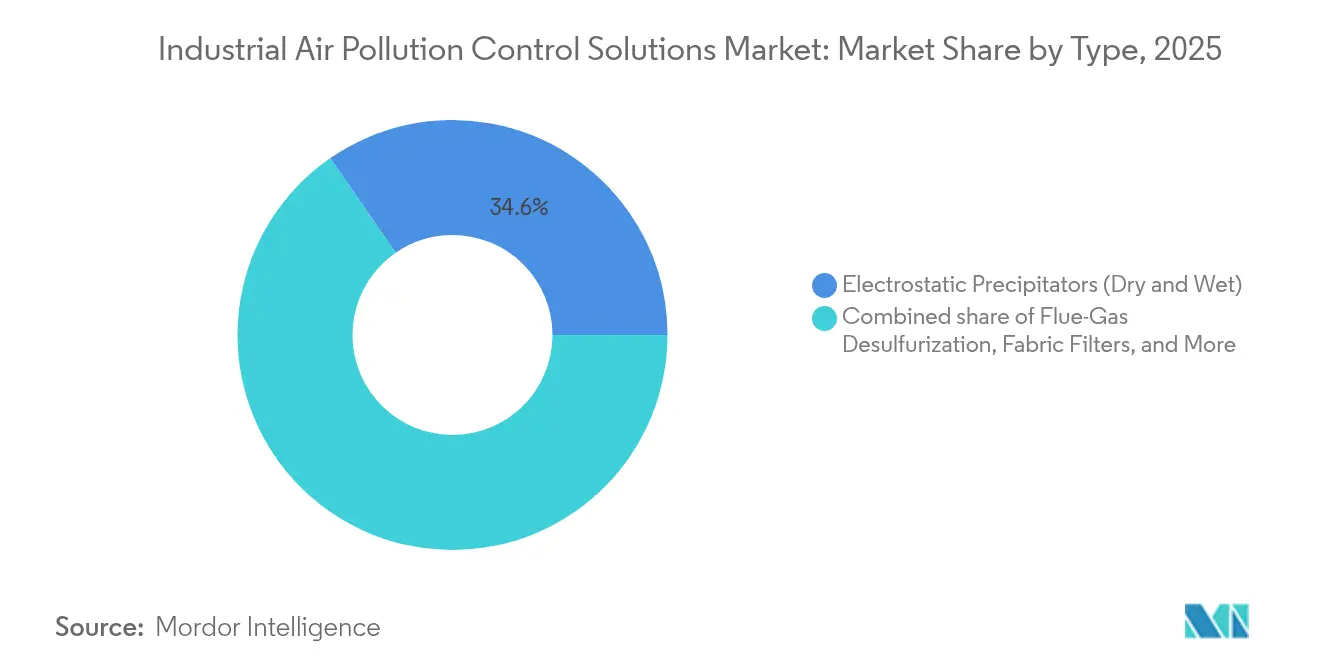
- By application, power generation accounted for 48.35% of the industrial air pollution control solution market demand in 2025, while waste-to-energy and biomass units are forecast to expand at a 7.12% CAGR during 2026-2031.
- By geography, Asia-Pacific commanded 48.70% of the industrial air pollution control solution market in 2025 and is set to rise at a 6.18% CAGR through 2031.
Note: Market size and forecast figures in this report are generated using Mordor Intelligence’s proprietary estimation framework, updated with the latest available data and insights as of 2026.
Global Industrial Air Pollution Control Solutions Market Trends and Insights
Drivers Impact Analysis*
| Driver | (~) % Impact on CAGR Forecast | Geographic Relevance | |
|---|---|---|---|
| Stricter multi-sector emission regulations | +1.8% | Global, with concentrated impact in EU, North America, and China | Short term (≤ 2 years) |
| Rising public-health awareness in emerging economies | +1.2% | APAC core, spill-over to MEA and Latin America | Medium term (2-4 years) |
| Efficiency gains from next-gen catalysts & digital twins | +0.9% | Global, with early adoption in North America and Northern Europe | Medium term (2-4 years) |
| Continued build-out of coal-to-gas & waste-to-energy plants in APAC | +1.1% | APAC, particularly China, India, and ASEAN countries | Long term (≥ 4 years) |
| AI-enabled predictive maintenance lowers compliance risk | +0.6% | Global, with premium adoption in developed markets | Medium term (2-4 years) |
| Net-zero industrial clusters adopting modular APC packages | +0.7% | North America, EU, with pilot projects in APAC | Long term (≥ 4 years) |
| Source: Mordor Intelligence | |||
Stricter Multi-Sector Emission Regulations
The European Union’s revised Industrial Emissions Directive entered into force in August 2024, obliging industrial sites to trim key pollutants by up to 40% versus 2020 levels. Parallel tightening in the United States now targets deeper NOx cuts from new stationary turbines, with draft rules slated to eliminate 2,659 tons of NOx annually by 2032. Convergence between EU and U.S. thresholds creates a de facto global compliance floor that drives advance orders for high-selectivity SCR reactors, wet ESP systems, and hybrid modules. Enforcement is equally visible in Asia: South Korea’s expanded permitting regime now covers 1,013 industrial facilities, versus 400 four years earlier, contributing to record-low national PM2.5 readings in 2024(1)Anadolu Agency, “What’s Behind South Korea’s Air Quality Breakthrough?,” aa.com.tr . Cement and steel operators have responded by bundling sulfur, nitrogen, and dust controls into single EPC contracts, signaling a clear shift away from piecemeal retrofits. Collectively, these measures raise the addressable pool of installations and pull forward spending into the early part of the forecast window.
Rising Public-Health Awareness in Emerging Economies
India’s National Clean Air Programme now seeks 40% particulate reductions across more than 100 cities by 2026, a target backed by an environmental-technology market worth USD 23 billion and expanding at 7.5% annually(2)United States Department of Commerce, “India – Environmental Technology,” trade.gov . Thailand followed with cabinet-level approval of a dedicated air-quality management bill in 2024. Health-economics studies in China suggest stricter particulate controls could avert 218,000 premature deaths by 2030, fuelling local support for end-of-pipe investments. Corporate buyers also capture tangible productivity benefits; sensors installed across industrial zones indicate that a 10 µg/m³ drop in PM2.5 lifts worker output enough to add 1% to plant-level profitability, a finding that has moved boardroom discussions from compliance risk to margin enhancement. Carbon-pricing schemes in Singapore and Indonesia embed these health benefits into cap-and-trade balances, turning cleaner air into a tradable asset, further enlarging the industrial air pollution control solution market.
Efficiency Gains from Next-Gen Catalysts & Digital Twins
CORMETECH’s METEOR catalyst slashes NOx, CO, VOC, and THC emissions in the same housing, marking a step-change in multi-pollutant abatement. AI-enabled digital twins are now paired with SCR reactors and electrostatic precipitators to fine-tune power supply, electrode rapping, and ammonia flow, often cutting energy input by 8-12% while keeping outlet concentrations below regulated thresholds. Field pilots on ocean-going vessels demonstrate real-time predictive monitoring that flags deviations before they trigger regulatory breaches. On the particulate front, switched-integrated-rectifier ESP designs achieve 0.5 mg/Nm³ outlet dust, while adaptive pulse-jet controllers extend filter-bag life by 30%. High-temperature catalytic filters that reclaim waste heat are now emerging in chemicals and non-ferrous metallurgy, shifting the cost calculus from pure compliance to positive energy payback. These performance leaps persuade operators with tight abatement budgets to migrate from single-pollutant devices to integrated systems, expanding average revenue per project for equipment suppliers.
Continued Build-Out of Coal-to-Gas & Waste-to-Energy Plants in APAC
China announced enhanced financial incentives for coal plants that trim emission intensity 20% by 2025 and 50% by 2027, ensuring a multiyear retrofit pipeline. The region also hosts the world’s largest oxy-fuel cement-sector CCUS unit, now operating at full scale and showcasing 95% CO₂ capture. Parallel demand stems from USD 246 million coal-to-gas conversions, such as Babcock & Wilcox’s North American project that still uses APAC-sourced catalyst beds. ASEAN countries add momentum via escalating waste-energy mandates, requiring ultra-low dioxin, NOx, and acid-gas emissions at new incinerators. Given heterogeneous feedstocks, operators increasingly specify modular packages with bypass capability, a niche in which the industrial air pollution control solution market has few incumbents and strong margin potential.
Restraints Impact Analysis*
| Restraint | (~) % Impact on CAGR Forecast | Geographic Relevance | Impact Timeline |
|---|---|---|---|
| High capex & opex of advanced APC installations | -1.4% | Global, with acute impact in cost-sensitive emerging markets | Short term (≤ 2 years) |
| Retirement of coal-fired assets in OECD markets | -0.8% | North America, EU, with selective impact in developed APAC | Medium term (2-4 years) |
| Supply-chain volatility for vanadium & other catalyst materials | -0.6% | Global, with concentrated impact on SCR system deployments | Short term (≤ 2 years) |
| Shift toward in-process abatement cuts end-of-pipe demand | -0.5% | Global, with early adoption in advanced manufacturing sectors | Long term (≥ 4 years) |
| Source: Mordor Intelligence | |||
High Capex & Opex of Advanced APC Installations
Comprehensive retrofits can command USD 50-200 million per site, with sorbent, reagent, and electricity outlays lifting annual operating costs 10-15%. Premium SCR stacks that integrate digital-twin software price 30-40% above legacy units, putting them out of reach for many mid-tier smelters and ceramics plants. Financing gaps in developing countries thus prolong equipment replacement cycles. The sector is pivoting to modular skids and lease-operate-transfer models, but capital frictions still shave nearly 1.5 percentage points off the otherwise addressable CAGR. Public-private loan guarantees, such as the U.S. Department of Energy’s USD 77 million Project Tundra package, help close large utility deals, yet smaller enterprises remain underserved(3)U.S. Department of Energy, “Project Tundra Final Environmental Assessment,” netl.doe.gov. Until asset-based financing becomes commonplace, the industrial air pollution control solution market will trail its theoretical demand potential in cost-sensitive regions.
Retirement of Coal-Fired Assets in OECD Markets
The U.S. Energy Information Administration reports that 9.5% of domestic coal capacity opted for retirement rather than investing in post-2024 mercury and toxics retrofits(4)U.S. Energy Information Administration, “Coal-Fired Power Plant Operators Compliance Strategies,” eia.gov. Europe shows the same pattern as carbon prices push older units off the grid. Every GW of shuttered capacity erases roughly USD 25-45 million in potential control-equipment orders, directly trimming addressable revenue. That said, remaining fleets often commit to larger, multi-pollutant overhauls to secure license extensions, partially offsetting lost volume. Some utilities adopt hybrid strategies—co-firing biomass or hydrogen—thereby requiring new catalytic filters capable of wider temperature windows. Service providers also monetize decommissioning, residue treatment, and asset-transfer work, cushioning the downside but not fully replacing the lost greenfield pipeline.
*Our forecasts treat driver/restraint impacts as directional, not additive. The impact forecasts reflect baseline growth, mix effects, and variable interactions.
Segment Analysis
By Type: Selective Catalytic Reduction Systems Accelerate Multi-Pollutant Adoption
Electrostatic precipitators commanded a 34.62% industrial air pollution control solution market share in 2025, confirming their status as the workhorse for particulate removal. While replacement activity for high-frequency power supplies and switched-integrated rectifiers keeps the installed base current, the growth spotlight has shifted to SCR systems, which are advancing at a 7.79% CAGR in response to NOx ceiling reductions in China, the EU, and several U.S. states. Suppliers differentiate through improved vanadium-titania formulations that withstand higher sulfur and dust loads, reducing ammonia slip and maintenance cycles. Hybrid units that couple SCR reactors upstream of wet ESP stages shrink total footprint by up to 25%, a decisive advantage in plants with little spare space. Fabric filters continue to gain share in cement kilns and secondary lead smelters seeking sub-5 mg/Nm³ particulate limits, while flue-gas desulfurization retrofits remain indispensable for aging coal stacks. Advanced catalytic filtration, capable of tackling dust, SO₂, and NOx in one pass, exemplifies the market’s march toward integrated designs and underpins the rising average price per megawatt capacity.
The industrial air pollution control solution market size for SCR equipment alone is projected to climb from USD 25.22 billion in 2026 to USD 36.69 billion by 2031, reflecting both new-build demand and end-of-life replacement at utilities and petrochemical refineries. Concurrently, activated-carbon injection and dry-sorbent dosing systems see renewed uptake in mercury-control retrofits, albeit from a lower base. Plasma and UV oxidizers remain niche but grow in semiconductor fabs and specialized VOC streams where conventional thermal oxidizers would risk product contamination. Collectively, these technology trends underscore a shift from single-pollutant optimization toward holistic abatement, positioning vendors with broad portfolios for superior wallet share across customer accounts.



By Application: Waste-to-Energy Plants Outpace Traditional Power Generation
Power generation held 48.35% of the industrial air pollution control solution market demand in 2025, thanks to the continued predominance of coal and lignite in many national grids. Retrofitting flue-gas desulfurization and adding catalytic layers inside existing SCR arrays form the bulk of near-term orders. Yet the fastest-growing niche lies in waste-to-energy and biomass combustion, which is slated to expand at a 7.12% CAGR through 2031 as municipalities pivot to circular-economy frameworks. Modern waste-incinerator lines require simultaneous control of dioxins, heavy metals, acid gases, and nitrogen oxides, making them fertile ground for hybrid catalytic-filter trains that fuse dust, acid-gas, and NOx capture in one vertical.
The industrial air pollution control solution market size for the waste-to-energy segment is forecast to rise from USD 9.75 billion in 2026 to USD 13.75 billion by 2031. Cement and lime kilns adopt oxy-fuel combustion with post-combustion CO₂ capture, demanding ultra-robust baghouse fabrics and wet-scrubber metals that resist acidic conditions. Iron and steel complexes experimenting with hydrogen-based direct-reduced iron processes require high-temperature catalytic filtration rather than conventional bag filters. Chemical and petrochemical operators, facing broad pollutant spectra, increasingly demand modular secondary-combustion chambers combined with SCR and wet ESP polishing stages. These shifts diversify the customer base and mitigate dependence on large coal projects.
Geography Analysis
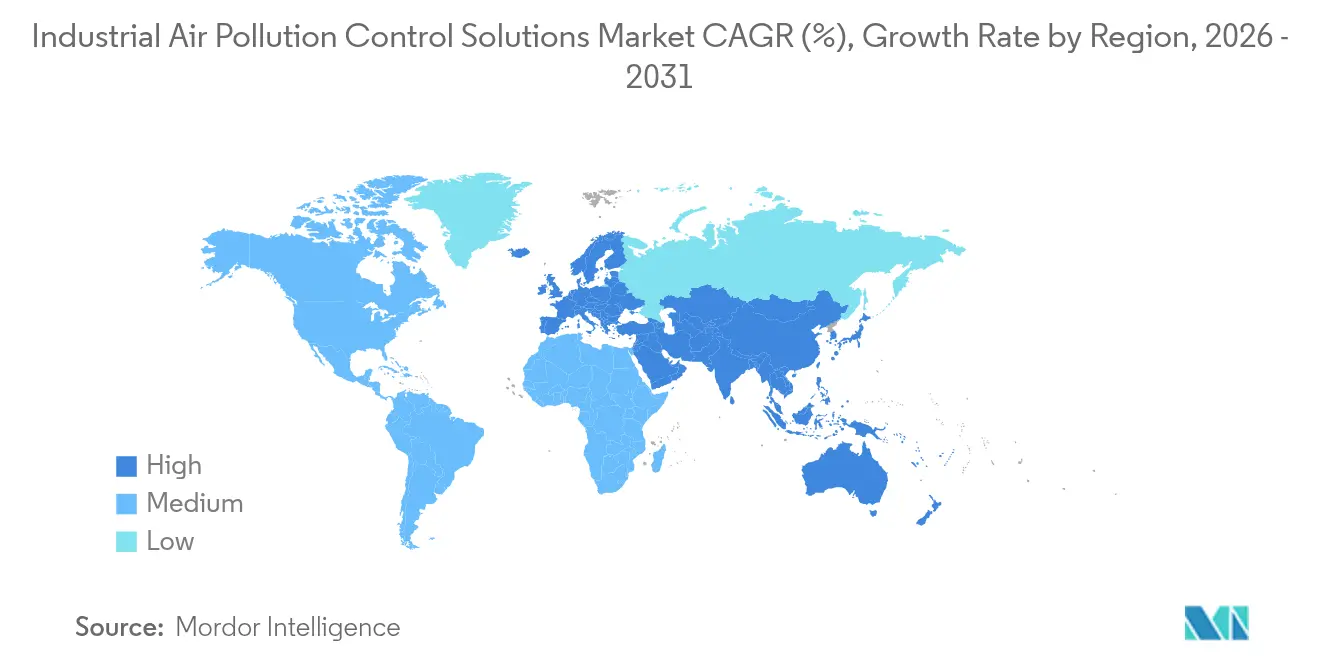
Asia-Pacific claims 48.70% of the industrial air pollution control solution market revenue in 2025 and sustains the steepest trajectory at a 6.18% CAGR through 2031. Beijing’s fiscal incentives for 50% coal-emission-intensity cuts by 2027, India’s USD 23 billion environmental-tech sector expanding 7.5% annually, and South Korea’s successful PM2.5 crackdown drive aggregate demand. Japan’s Green-Transformation road map funnels capital toward steel, chemicals, and cement retrofits, while ASEAN carbon-pricing frameworks turn emission limits into financial liabilities that industrial operators must hedge via rapid equipment upgrades. The region also hosts the largest pipeline of new waste-to-energy facilities, intensifying demand for integrated hybrid systems.
North America represents a mature but profitable arena focused on equipment upgrades and lifecycle-service contracts. Proposed federal NOx standards for turbines and substantial coal-to-gas conversions sustain a stream of SCR, baghouses, and wet-scrubber orders. Large CCUS retrofits, such as the USD 77 million Project Tundra undertaking, further enlarge the scope of integrated solutions. Canada’s carbon-capture tax credits push cement and fertilizer plants toward high-capacity wet ESP and hybrid catalytic filters. Mexico’s growing industrial corridors present pockets of demand for cost-effective dry-sorbent injection packages.
Europe keeps the policy vanguard through the 2024 Industrial Emissions Directive, extending coverage to metal mining and battery production. German cement plants piloting 95% CO₂ capture units and Finnish waste-to-energy plants specifying full-stream carbon capture highlight the region’s appetite for cutting-edge hybrid solutions. South America sees budding orders from Brazilian steel and cement producers, while the Middle East & Africa demand centers on flue-gas conditioning for refinery and gas-processing facilities, including South Africa’s CO₂-scrubber retrofit at Duvha Power Station.

Regulatory Landscape
Regulation is tightening through both cross-sector frameworks and highly specific source-category rules. In the European Union, the revised Industrial Emissions Directive (Directive (EU) 2024/1785) entered into force in August 2024 and expands permitting scope, including activities such as large-scale battery manufacturing and mining. Member States face a national transposition deadline in July 2026, which is expected to reinforce BAT-anchored upgrades across multiple industries.
In the United States, the EPA has continued updating Clean Air Act standards through Federal Register final actions that affect control-technology selection and retrofit timing. In January 2026, EPA finalized amendments to the New Source Performance Standards (NSPS) for stationary combustion turbines (40 CFR part 60, subpart KKKKa), updating NOx performance standards and subcategories based on BSER. EPA also finalized additional sector MACT updates in March 2026 (for example, Polyether Polyols Production and Chemical Manufacturing Area Sources), strengthening LDAR and performance-testing requirements that expand demand for monitoring, oxidation, and capture systems alongside core particulate and NOx controls.
Competitive Landscape
The industrial air pollution control solution market is moderately fragmented: roughly 10 global suppliers cover 60-65% of installed capacity, yet scores of regional specialists remain. Consolidation accelerated in 2025 when ANDRITZ closed its USD 100 million acquisition of LDX Solutions, adding wet ESP and regenerative oxidizer lines and bolstering its one-stop shop credentials. Hybrid-system prowess differentiates leaders; CORMETECH’s METEOR catalyst tackles four pollutants simultaneously, while Dürr’s catalytic-filter elements fuse dust capture with De-NOx and De-SOx functions. Digitalization is the second battleground: vendors equip baghouses and SCR units with AI controllers that cut energy draw and predict filter-bag failure, locking customers into recurring software fees.
White-space growth emerges around modular skids for net-zero industrial parks. The World Economic Forum has mapped 20 clusters seeking integrated solutions, a niche where flexible lease-operate models trump traditional EPC bids(6)World Economic Forum, “Transitioning Industrial Clusters,” weforum.org. Disruptors from South Korea and Japan explore filter-free electrostatic purifiers for ultrafine particles, offering maintenance-free alternatives in indoor and niche industrial settings. At the same time, service-heavy strategies gain ground: OEMs guarantee stack performance, supply reagents and run the data layer, generating annuity streams that smooth revenue volatility. Facing input-cost swings in vanadium and rare-earth elements, some catalyst firms are forging supply alliances with upstream miners to secure price stability and safeguard margins.
Industrial Air Pollution Control Solutions Industry Leaders
Mitsubishi Hitachi Power Systems Ltd
Thermax Ltd
Babcock & Wilcox Enterprises Inc
General Electric Company
Fujian Longking Co. Ltd.
- *Disclaimer: Major Players sorted in no particular order


Market Opportunities and Future Outlook
White space is widening for operators that need multi-pollutant packages capable of reducing outage time and simplifying compliance documentation across multiple rulesets. The U.S. EPA issued several industrial and energy-adjacent final rules in early 2026, including NSPS updates for stationary combustion turbines (January 2026), confirmation of MATS for coal- and oil-fired utility steam generating units (February 2026), and MACT updates for Chemical Manufacturing Area Sources and Polyether Polyols Production (March 2026), plus NSPS OOOOb technical amendments for crude oil and natural gas (April 2026). This cadence supports opportunities for OEMs and service providers that bundle core abatement hardware (SCR, wet scrubbing, fabric filtration, sorbent injection) with continuous monitoring, LDAR workflows, and digital reporting to lower compliance risk and shorten verification cycles.
A second opportunity area is integration with carbon management projects, where air pollution control and carbon capture readiness are increasingly specified together at large emitting assets. Industrial decarbonization roadmaps and CCUS programs (for example, the Texas Carbon Management Roadmap published in January 2026 and national-level CCUS roadmaps such as Denmark's 2026 edition) point to capture-system buildouts sitting downstream of particulate, acid-gas, and NOx control, which raises the value of hybrid trains that protect solvents and compressors from contaminants. For suppliers, this creates room to move from one-time equipment sales into multi-year performance contracts covering reagent supply, condition-based maintenance, and emissions-data platforms, aligning with the market shift toward AI-enabled optimization and predictive maintenance described in the report context.
Recent Industry Developments
- July 2026: Mitsubishi Power announced a contract to supply boilers for heavy oil to natural gas fuel conversion at thermal power plants in Saudi Arabia. Fuel-switch projects typically trigger concurrent upgrades in NOx and particulate control train design and commissioning scope, lifting demand for integrated emissions solutions that match new combustion profiles.
- December 2025: Babcock & Wilcox was awarded a USD 40 million contract to provide advanced wet gas scrubbing technology at a Canadian petroleum refinery. The award signals sustained refinery spending on high-performance scrubbing as emissions limits tighten, and it strengthens the company's installed base for follow-on aftermarket and performance-service revenue.
- December 2024: Trane Technologies acquired BrainBox AI to expand its AI-driven building and HVAC efficiency platform. While centered on built environments, the deal reinforces the broader shift toward AI-enabled optimization and data-layer control, which is also accelerating adoption of predictive maintenance and digital tuning in industrial emissions control systems.


Research Methodology Framework and Report Scope
Market Definition and Coverage
This market covers the revenue generated from equipment and integrated solutions that reduce or remove air pollutants from industrial exhaust streams before release to the atmosphere, across new builds and retrofits.
Scope exclusions: It does not count ambient air monitoring devices, indoor air purifiers, or general ventilation and HVAC systems that are not designed for industrial emission control.
Segmentation Overview
- By Type
- Electrostatic Precipitators (Dry and Wet)
- Flue-Gas Desulfurization (Wet, Dry, Semi-Dry)
- Selective Catalytic Reduction (SCR) and Denitrification
- Fabric Filters (Baghouse, Cartridge)
- Hybrid and Multi-pollutant Systems
- Activated Carbon and Sorbent Injection
- Others (Oxidizers, UV, Plasma)
- By Application
- Power Generation
- Cement and Lime
- Iron and Steel
- Chemicals and Petrochemicals
- Waste Incineration and Biomass
- Pulp and Paper
- Others (Pharmaceuticals, Food and Beverage)
- By Geography
- North America
- United States
- Canada
- Mexico
- Europe
- Germany
- France
- United Kingdom
- Italy
- Russia
- Rest of Europe
- Asia Pacific
- China
- India
- Japan
- South Korea
- ASEAN Countries
- Rest of Asia Pacific
- South America
- Brazil
- Argentina
- Rest of South America
- Middle East and Africa
- Saudi Arabia
- United Arab Emirates
- South Africa
- Rest of Middle East and Africa
- North America
Data Sources, Market Sizing, and Validation
Desk Research
Desk work starts with mapping where industrial emissions come from and how control technologies are typically specified in plant projects. We used public sources such as the US EPA air program pages and emissions inventories, the European Environment Agency datasets, UN Comtrade trade statistics for relevant equipment flows, and IEA and World Bank industry and power indicators to sanity-check activity trends.
We also reviewed company annual reports, investor presentations, and reputable press coverage to understand project timing, pricing direction, and replacement cycles for key systems. Where needed, a paid subscription for company financials and a patent database were used to improve coverage of smaller suppliers and to spot technology shifts that can affect adoption assumptions. These examples are not exhaustive, and many other public documents and sources were also used for data collection, validation, and clarification.
Primary Interviews and Surveys
Primary work was used to stress-test the desk assumptions around average system values, retrofit intensity, and the split between particulate and gas control demand across key end users. We spoke with a mix of equipment manufacturers, engineering and project stakeholders, and industrial buyers across major regions, so our totals reflect how projects are specified and purchased in practice.
Distribution of primary research fieldwork respondents
| Company type | Respondent position | Region |
|---|---|---|
| Top tier: 35% | CXOs: 12% | APAC: 42% |
| Mid tier: 49% | Functional/Unit leaders: 28% | EMEA: 36% |
| Smaller Players: 16% | Managers: 60% | Americas: 22% |
Market-Sizing & Forecasting
Our model uses a top-down build that reconstructs spending from industrial activity and compliance drivers, and then it is cross-checked against selective bottom-up approximations from supplier mix and sampled pricing. For each major industry and region, demand is tied to indicators such as industrial production and capacity additions, thermal power and process plant retrofits, cement and metal output trends, and the timing and stringency of emission limits that trigger upgrades.
Pricing and value capture are handled with practical inputs, including typical system ASP ranges by technology group, the share of projects that are retrofit versus new build, the portion of multi-pollutant systems in the mix, and service and parts intensity during installed-base replacement cycles. When direct datapoints are missing for smaller countries, we fill gaps by indexing to output proxies and trade flows, then adjust using expert feedback so the result stays realistic.
Forecasts are primarily derived through scenario analysis that links expected industrial production paths and policy enforcement momentum to adoption and replacement rates. The scenario weights are reviewed with interview inputs so we do not overstate sudden step-changes, and short-term volatility is aligned with observable capex cycles.
Data Validation & Update Cycle
Validation is done through multiple checks so the final number is not driven by a single assumption. We compare the market outputs against independent signals such as major end-user capex direction, equipment shipment patterns in trade statistics, and the implied installed-base refresh rate, and then any large variances are reviewed before sign-off.
If a technology or region shows an unusual jump, analysts re-check the driver series, re-run sensitivity tests on ASP and adoption, and reconnect with sources when the change looks event-driven. The report is refreshed annually, and interim updates are made when material events occur, such as major regulatory shifts or large project pipeline changes. Before delivery, a final review pass is completed so clients receive the latest updated view.
Mordor Intelligence's Industrial Air Pollution Control Solution Market Sizing Compared With Other Published Estimates
Published market values for air pollution control often look inconsistent because the scope is not defined the same way, even when the topic name sounds similar. The year chosen, the industries counted, and how pricing is treated for large one-time projects can all shift the final number by a meaningful margin.
Some published figures roll transportation-related controls and broader environmental systems into the total, and others mix a wider set of emission sources like power and non-industrial uses. In Mordor Intelligence, the count is limited to industrial air pollution control solutions and their related spending across key industrial applications, which keeps the model tied to plant-level demand drivers and practical replacement cycles.
Benchmark comparison
| Source | Market Size | Gaps in Research Methodology |
|---|---|---|
| Mordor Intelligence | USD 88.18 B (2026) | |
| Global Consultancy A | USD 86.18 B (2025) | Uses a broader air pollution control framing that can include non-industrial emission sources, and the base year choice differs, which changes the inflation and project-cycle timing baked into the value. |
| Industry Publisher B | USD 110.12 B (2026) | Often aggregates a wider set of systems and may apply higher blended ASP progression across technologies, which can lift totals when large turnkey projects and premium configurations are averaged in. |
The spread in the table mainly comes from what is counted as part of the market and how project values are annualized across years. By tying demand to observable industrial output signals, policy-driven retrofit waves, and realistic ASP bands, our estimate stays traceable to clear inputs and can be repeated when assumptions change.


Key Questions Answered in the Report
What is the current industrial air pollution control solution market size?
The market was valued at USD 88.18 billion in 2026 and is projected to climb to USD 116.46 billion by 2031.
Which segment is growing the fastest within the industrial air pollution control solution market?
Waste-to-energy and biomass facilities form the fastest-expanding application, advancing at a 7.12% CAGR over 2026-2031.
Why are selective catalytic reduction systems gaining share?
SCR demand rises because global NOx limits are tightening and new catalyst formulations now enable multi-pollutant removal, propelling the segment at an 7.79% CAGR.
How significant is Asia-Pacific for future growth?
Asia-Pacific already accounts for 48.70% of global revenue and is set to grow at 6.18% annually, driven by Chinese, Indian and ASEAN retrofit programs.
What is the chief barrier to wider adoption of advanced emission control technologies?
High upfront capital and operating costs, especially for integrated hybrid units, remain the primary adoption hurdle, trimming the market’s CAGR by an estimated 1.4 percentage points.
How is digitalization reshaping the competitive landscape?
AI-enabled predictive maintenance and digital-twin optimization cut energy costs and extend component life, giving suppliers with strong software offerings a durable competitive edge.
Page last updated on:





