Market Overview
| Study Period | 2021 - 2031 |
|---|---|
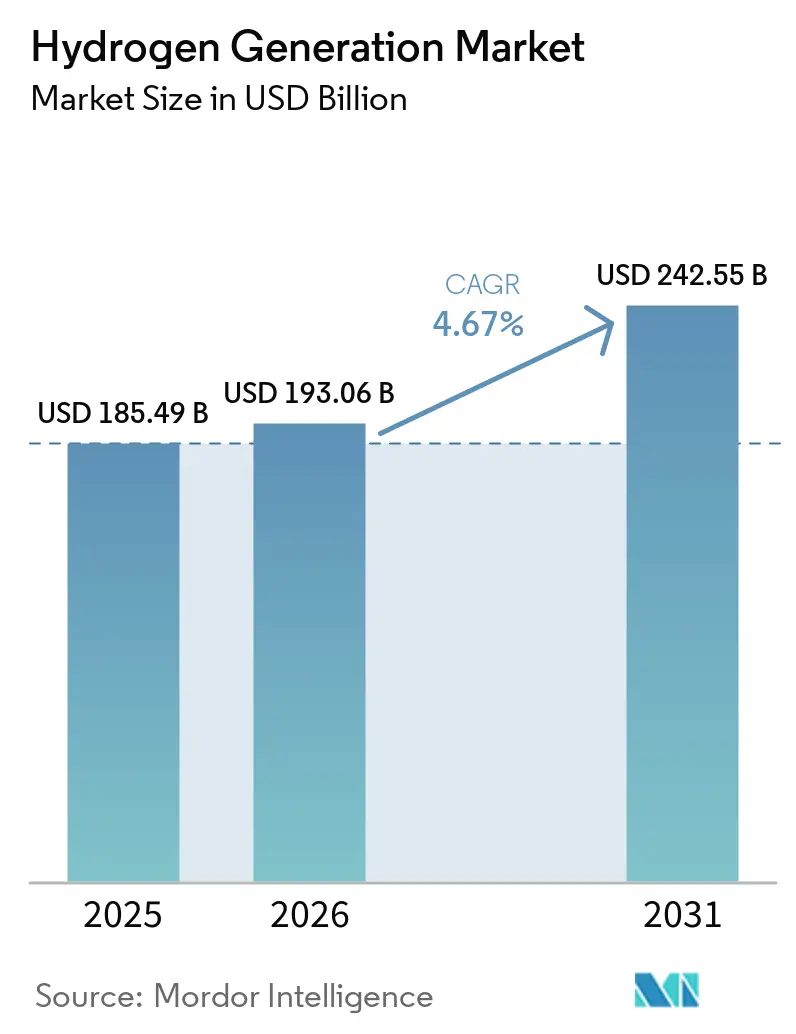
| Market Size (2026) | USD 193.06 Billion |
| Market Size (2031) | USD 242.55 Billion |
| Growth Rate (2026 - 2031) | 4.67% CAGR |
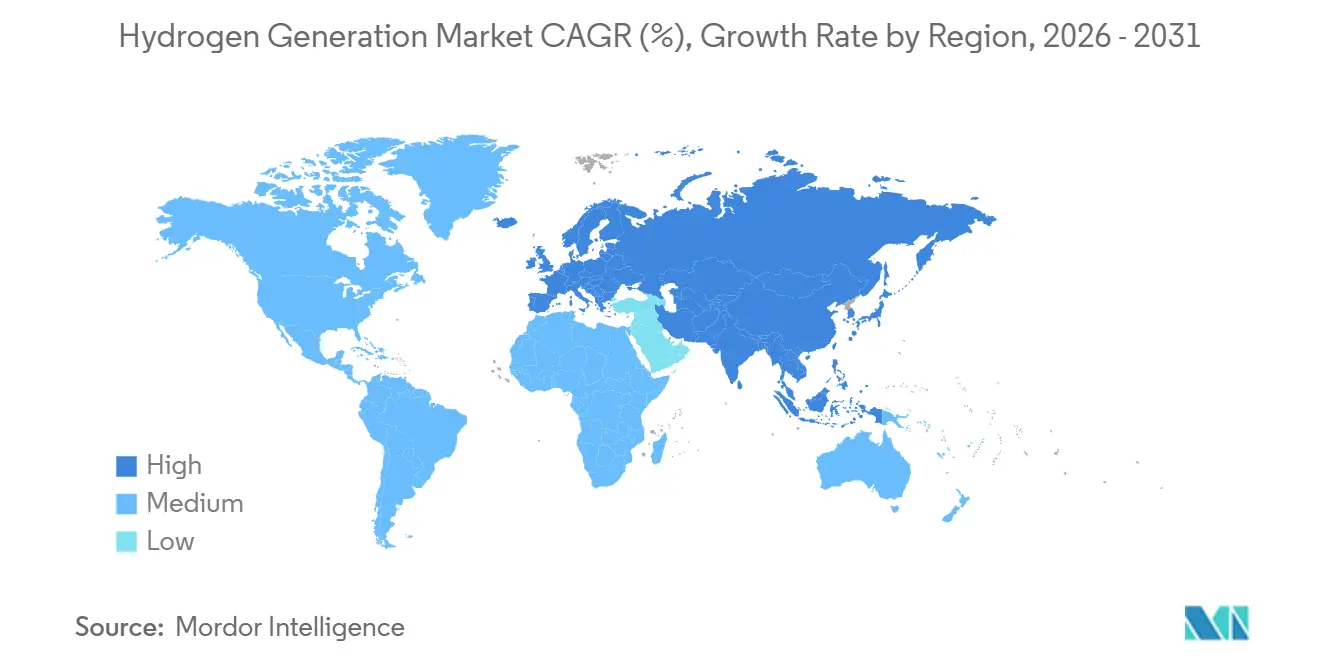
| Fastest Growing Market | Asia-Pacific |
| Largest Market | Asia Pacific |
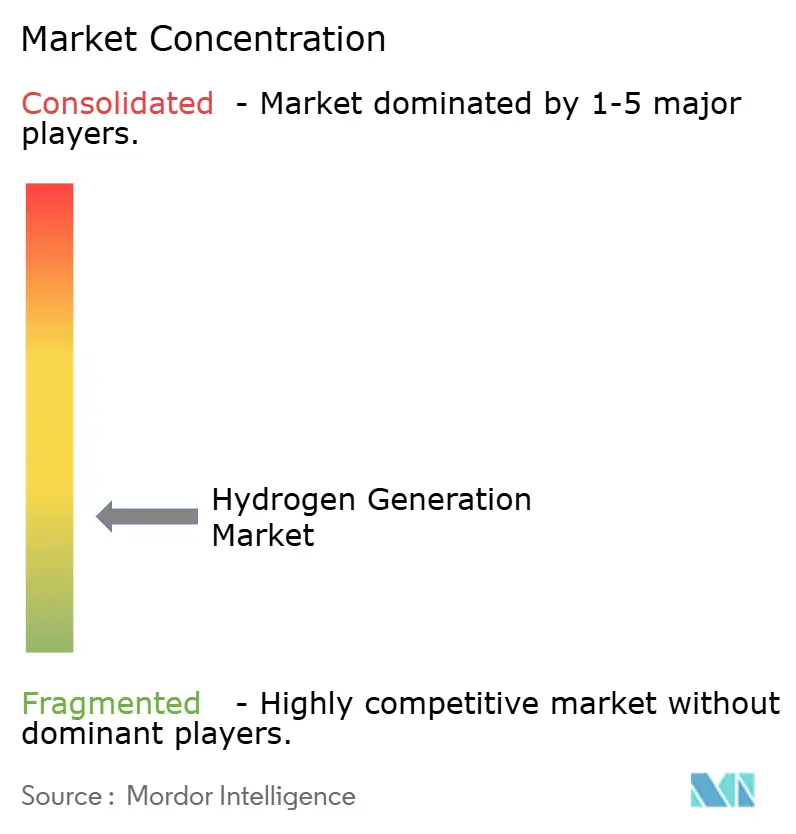
| Market Concentration | Low |
Major Players
*Disclaimer: Major Players sorted in no particular order Image © Mordor Intelligence. Reuse requires attribution under CC BY 4.0. |
|
Hydrogen Generation Market Analysis by Mordor Intelligence
The Hydrogen Generation Market size was valued at USD 185.49 billion in 2025 and is estimated to grow from USD 193.06 billion in 2026 to reach USD 242.55 billion by 2031, at a CAGR of 4.67% during the forecast period (2026-2031).
A still-dominant grey supply chain delivers inexpensive output, yet policy-backed green routes are scaling quickly as tax credits and renewable-fuel quotas reshape project economics. Electrolyzer costs are retreating while utility-scale solar and wind contracts in the Middle East and Australia provide low-priced electricity that accelerates investment. Asia-Pacific commands the bulk of demand, but the European Union’s additionality rules and the United States Section 45V credit are turning those regions into early adopters of low-carbon supply. Competition is widening beyond industrial-gas incumbents as electrolyzer manufacturers, renewable developers, and oil-and-gas producers race to secure long-term off-take agreements.
Key Report Takeaways
- By source, grey hydrogen held 97.62% of the hydrogen generation market share in 2025, while green hydrogen is expected to advance at a 34.30% CAGR through 2031.
- By technology, steam methane reforming led with 61.90% share of the hydrogen generation market size in 2025, and electrolysis is projected to expand at a 10.44% CAGR to 2031.
- By application, chemical processing captured 50.05% revenue share in 2025; transportation fuel applications are expected to grow at a 19.89% CAGR through 2031.
- By geography, Asia-Pacific accounted for 54.54% of the hydrogen generation market size in 2025 and is projected to grow at a 5.85% CAGR over 2026-2031.
Note: Market size and forecast figures in this report are generated using Mordor Intelligence’s proprietary estimation framework, updated with the latest available data and insights as of 2026.
Global Hydrogen Generation Market Trends and Insights
Drivers Impact Analysis*
| Driver | (~) % Impact on CAGR Forecast | Geographic Relevance | Impact Timeline |
|---|---|---|---|
| EU RFNBO Mandate Accelerating Green Hydrogen Off-take Agreements | 1.20% | Europe and North Africa | Medium term (2-4 years) |
| IRA & U.S. Section 45V Tax Credits Boosting Domestic Electrolyser Build-out | 1.50% | United States and Canada | Short term (≤2 years) |
| China Coal-to-Hydrogen Blending Policy Sustaining Grey & Blue Projects | 0.80% | China and ASEAN | Long term (≥4 years) |
| Middle-East Ammonia Export Hubs Creating Demand for GW-scale Green Hydrogen | 1.10% | United Arab Emirates and Saudi Arabia | Medium term (2-4 years) |
| Nordic Steelmakers HySustain Programs | 0.40% | Sweden, Finland, Norway | Medium term (2-4 years) |
| Japan–Australia Liquefied Hydrogen Supply Chain | 0.30% | Japan and Australia | Long term (≥4 years) |
| Source: Mordor Intelligence | |||


EU RFNBO Mandate Accelerating Green Hydrogen Off-take Agreements
The Renewable Fuels of Non-Biological Origin regulation took effect in 2024 and is accelerating growth in the hydrogen generation market by forcing European refineries to buy certified renewable hydrogen. Ten-year supply contracts signed in 2025 underwrote more than 1.2 GW of Iberian electrolyzer capacity at pricing near EUR 4.50 (USD 4.90) per kilogram. Additionality rules prohibit unbundled certificates, so developers are co-locating solar and wind farms, shifting renewable capacity away from power markets and lifting summer baseload prices by 8% in southern Europe. North African exporters are negotiating equivalence standards that could open a Mediterranean pipeline by 2027. Early movers, therefore, gain a pricing premium, but higher power costs tighten margins for the local industry.
IRA & U.S. Section 45V Tax Credits Boosting Domestic Electrolyser Build-out
Section 45V offers up to USD 3.00 per kilogram for near-zero-emission hydrogen, creating a decade of guaranteed revenue and triggering multi-gigawatt announcements in the hydrogen generation market. A USD 4.5 billion Louisiana complex will pair 1.5 GW of electrolysis with offshore wind and targets a 2028 start-up.[1]Air Products, “Section 45V Louisiana Complex Announcement,” airproducts.com Four DOE-backed hubs totaling 800 MW of capacity received conditional loan guarantees in 2025. Guidance allows retrofitted steam-methane reformers to access lower-tier credits, spurring 2.3 Mt per year of carbon-capture projects.[2]U.S. Department of the Treasury, "Section 45V Tax Credit Guidance," home.treasury.gov The 2033 sunset date remains a refinancing risk for investors.
China Coal-to-Hydrogen Blending Policy Sustaining Grey & Blue Projects
A February 2025 directive lets gas grids carry up to 30% coal-gasification hydrogen if 60% of carbon is captured, supporting the hydrogen generation market. Sinopec’s new 300 kt per year Inner Mongolia plant integrates capture that stores 180 kt of CO₂ each year.[3]Sinopec, “Inner Mongolia Blue Hydrogen Plant,” sinopec.com The rule keeps coal assets running at USD 1.10–1.40 per kilogram, roughly half the cost of imported green hydrogen. Provincial subsidies cover 40% of capture-equipment capital expense, delaying a mass shift to electrolysis. Lower capture thresholds than Europe will, however, limit export eligibility.
Middle-East Ammonia Export Hubs Creating Demand for GW-scale Green Hydrogen
Low solar power prices of USD 0.015–0.020 per kWh allow projects like the 2.2 GW NEOM plant to produce hydrogen at USD 2.50 per kilogram, strengthening the hydrogen generation market before transport. The facility reached mechanical completion in 2026 and will feed 1.2 Mt per year of ammonia bound for Asia under 30-year off-take deals. A 1 GW Masdar-TotalEnergies project follows the same model in Abu Dhabi. Ammonia shipment avoids cryogenic hydrogen and lands in Japan near USD 450 per tonne, under-pricing domestic steam-methane reforming by 15%.
Restraints Impact Analysis*
| Restraint | (~) % Impact on CAGR Forecast | Geographic Relevance | Impact Timeline |
|---|---|---|---|
| Scarcity of Tier-1 Renewable PPAs for GW-scale Electrolysis in Europe | –0.9% | Germany and Netherlands | Short term (≤2 years) |
| U.S. Gulf-Coast Water-Stress Constraints on PEM Deployment | –0.5% | Texas and Louisiana | Medium term (2-4 years) |
| High CO₂ Capture Costs for Existing SMR Units in South Korea | –0.3% | South Korea | Medium term (2-4 years) |
| Limited Hydrogen Pipeline Codes & Safety Permits in Caribbean Islands | –0.1% | Caribbean Region | Long term (≥4 years) |
| Source: Mordor Intelligence | |||
Scarcity of Tier-1 Renewable PPAs for GW-scale Electrolysis in Europe
Only 2.1 GW of dedicated renewable PPAs closed in 2025 against an 8.4 GW project pipeline. Approval timelines for wind farms stretched beyond four years, and grid connections in the North Sea corridor suffered multi-year queues. RWE postponed its 300 MW electrolyzer after failing to lock a 15-year offshore PPA below EUR 0.045 per kWh. Without additionality compliance, output loses RFNBO eligibility, diverting orders to the Middle East and Australia. Nel reported 60% of its 2025 order intake originated outside Europe, compared to 40% two years earlier.
U.S. Gulf-Coast Water-Stress Constraints on PEM Deployment
PEM stacks need 9 L of deionized water per kilogram of hydrogen. Harris County capped new industrial withdrawals above 500,000 gallons per day in 2025, delaying three projects totaling 600 MW. Plug Power added a USD 120 million seawater desalination unit that lifted levelized costs by USD 0.35 per kilogram. Seasonal water scarcity forced the Sabine River Authority to cut allocations by 20% in August 2025. Alkaline units consume marginally less water but face slower ramp times, so developers may migrate projects to the Great Lakes or Pacific Northwest, where hydropower is abundant.
*Our forecasts treat driver/restraint impacts as directional, not additive. The impact forecasts reflect baseline growth, mix effects, and variable interactions.
Segment Analysis
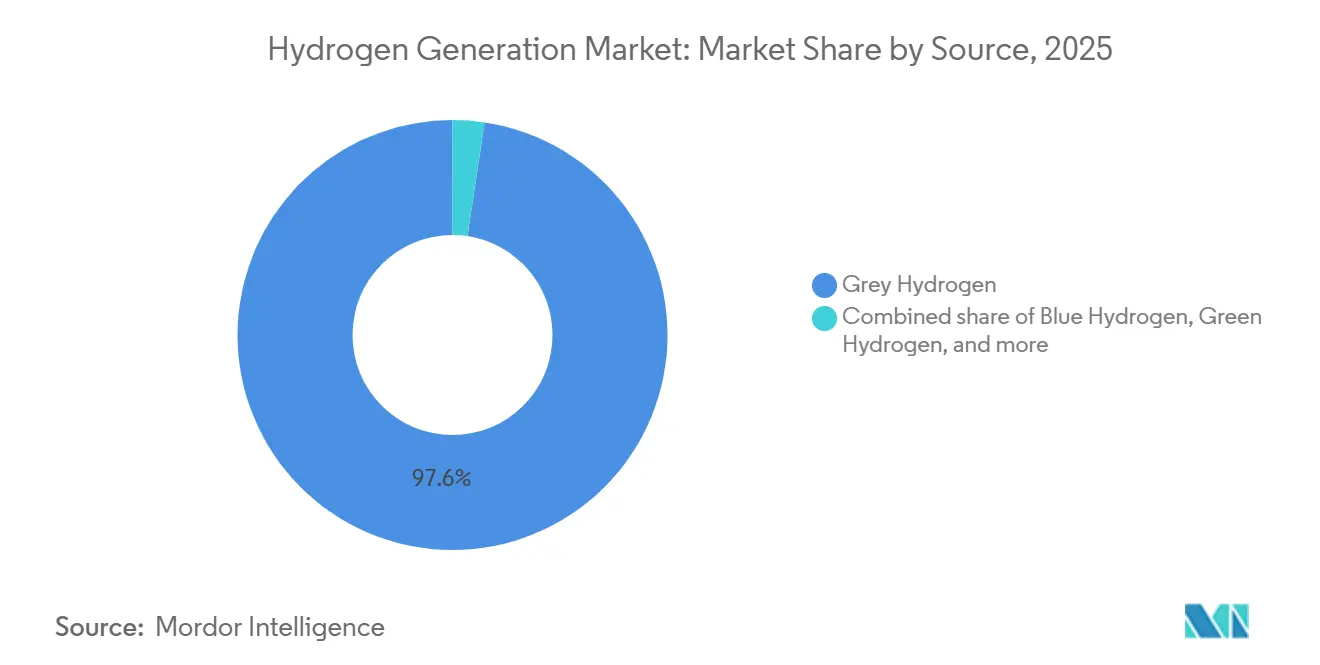
By Source: Grey Dominance Faces Green Disruption
Grey hydrogen accounted for 97.62% of global volume in 2025, underscoring entrenched cost advantages that keep delivered prices near USD 1.20 per kilogram in gas-rich regions. Yet green output is soaring at 34.30% CAGR through 2031 as electrolyzer capital costs fall and renewable power prices drop. Blue hydrogen occupies a narrow transitional niche because carbon-capture retrofits push production costs toward USD 2.20 per kilogram, still below green but significantly above grey. Turquoise hydrogen remains pilot-scale, while pink hydrogen from nuclear-powered electrolysis is emerging in France and Canada as a baseload option.
Growth trajectories differ sharply by geography. Europe is on track for a 2030 grey-to-green crossover under the RFNBO mandate, while Asia-Pacific may not pivot until the early 2030s because China’s coal-gasification fleet keeps costs low. Middle Eastern exporters could reach cost parity by 2028 thanks to solar electricity below USD 0.02 per kWh. Without capture readiness, many refineries constructed before 2015 face stranded-asset risk and may switch to merchant green hydrogen rather than invest more than USD 100 million per 100 kt capacity in upgrades.


By Technology: Electrolysis Gains as SMR Holds
Steam methane reforming held 61.90% of global capacity in 2025 because of low capital intensity around USD 600 per kW. Electrolysis is growing at 10.44% CAGR, led by alkaline units in projects above 100 MW that demonstrated 67% system efficiency for Shell’s Holland Hydrogen I installation. PEM technology supports distributed production and fast load-following, though stack life averages 40,000 hours NEL ASA. Solid-oxide systems reached 85% electrical efficiency in a 2025 South Korea pilot by using waste heat from steel off-gas.
Coal gasification still supplies 18% of global hydrogen but faces rising capture costs and air-quality limits. Hybrid plants now pair small electrolyzers with reformers, enabling operators to blend low-carbon hydrogen when renewable power prices dip, a strategy that produced lifecycle emissions of 2 kg CO₂ per kg at a blended cost near USD 2.20 per kg in a 2025 Texas demonstration.
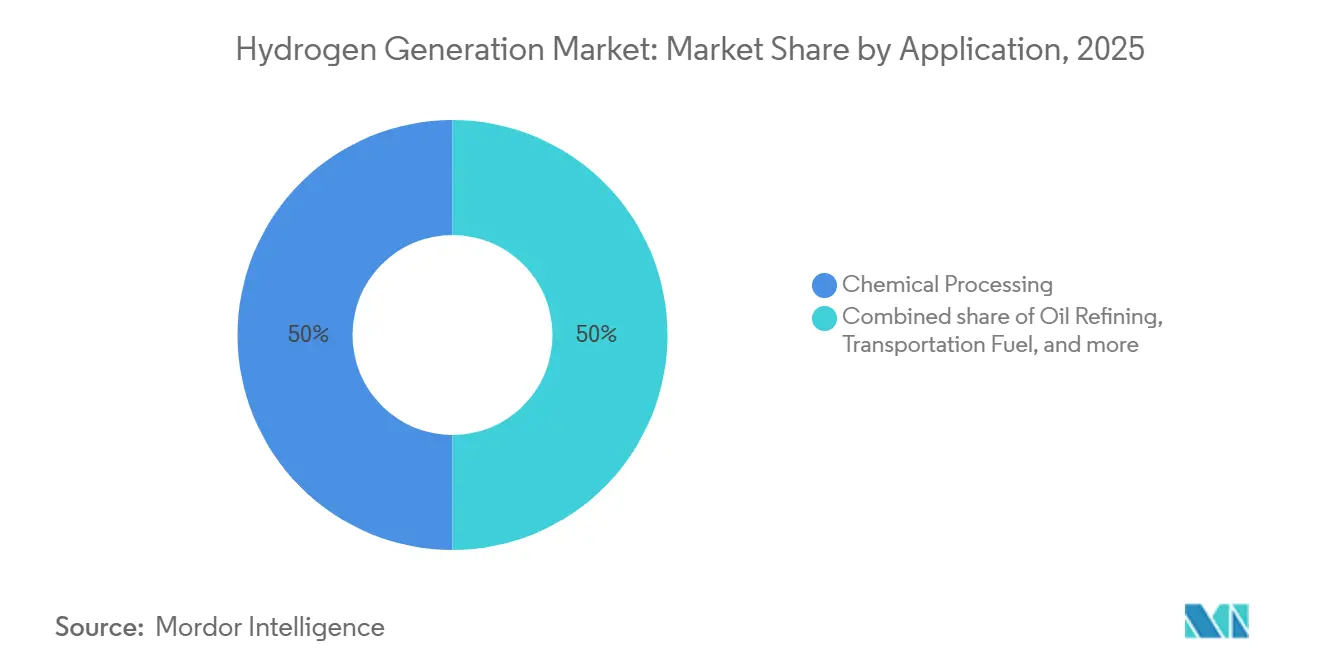
By Application: Chemicals Anchor, Transport Accelerates
Chemical processing absorbed 50.05% of demand in 2025, anchored by ammonia synthesis and methanol production. Transportation fuel is the fastest-growing use case at 19.89% CAGR, as 4,200 fuel-cell trucks entered U.S. and European fleets in 2025 and maritime carriers ordered ammonia-fueled vessels for delivery in 2027. Oil refining’s share is plateauing because gasoline demand is falling, while hydrogen-based direct-reduced iron lines in Sweden and Finland lift steel’s future share. Power generation trials in Japan and South Korea use turbines burning hydrogen blends and prepare for 100% combustion by 2027.
Demand is bifurcating between low-priced bulk chemicals that tolerate residual CO₂ and premium transportation and steel segments that pay for zero-carbon attributes. That split creates two price tiers in the hydrogen generation market and challenges merchant suppliers to balance contract portfolios.
Geography Analysis
Asia-Pacific led the hydrogen generation market size with 54.54% demand in 2025. China commissioned 18 GW of coal-gasification capacity and installed 1.1 GW of electrolyzers, while India consumed 7.2 Mt, supported by a USD 2.3 billion subsidy to build 5 GW of capacity by 2030.[4]Ministry of New and Renewable Energy, India, “National Green Hydrogen Mission,” mnre.gov.in South Korea relies on long-term import contracts covering 500 kt per year of liquefied hydrogen and ammonia. Australia has 22 GW of projects in feasibility stages, focusing on exports aligned with iron-ore decarbonization.
Europe is converting grey to green supply under RFNBO rules. Germany installed 680 MW of electrolyzers in 2025 and targets 10 GW by 2030, yet permitting delays for wind projects slow scale-up. The Netherlands is building 2 GW of import terminals in Rotterdam. Spain and Portugal issued 3.8 GW of permits for export lines to northern Europe, while the United Kingdom is banking on blue hydrogen for industrial clusters. Nordic countries use hydrogen to decarbonize steel, and Russia pivots toward domestic offtake as sanctions curb exports.
North America is split between Gulf Coast clusters and distributed projects in the Midwest and Pacific Northwest. The US hydrogen generation market gained momentum as Section 45V catalyzed 420 MW of electrolyzers in 2025, mainly in Texas and Louisiana, with Canada leveraging hydropower in Quebec to supply local refineries. Mexico remains nascent but explores export opportunities to California. The Middle East exploits low renewable costs, commissioning 3.2 GW in 2025. South America’s Chile and Brazil, and Africa’s Egypt and Morocco, pursue export-led strategies but remain sub-gigawatt today.

Competitive Landscape
Hydrogen Generation Market is semi fragmented. Linde bought ITM Power’s 24 MW division in 2025 to secure PEM stacks and vertical integration. Air Products committed more than USD 15 billion to mega-projects in Saudi Arabia, Egypt, and the United States. Nel, Plug Power, Cummins, and Siemens Energy increased aggregate order backlogs to over 6 GW, driven by Middle Eastern and Australian utility-scale contracts.
Chinese electrolyzer suppliers Longi and Sungrow undercut Western prices by up to 40%, accelerating consolidation among European OEMs. Distributed production is a white-space opportunity: Enapter deployed 50 modular units at Australian mines that replaced diesel generators. Monolith Materials validated turquoise hydrogen economics through carbon-black co-product sales, breaking even at USD 2.00 per kg. M&A momentum continued when Siemens Energy bought 45% of H2 Green Steel in November 2025 to lock in electrolyzer demand. Technology race now centers on efficiency and durability, with Bloom Energy’s solid-oxide units reaching 85% efficiency and Cummins PEM stacks recording 50,000-hour life.
Hydrogen Generation Industry Leaders
-
Linde plc
-
Air Liquide
-
Air Products & Chemicals
-
Sinopec
-
Nel ASA
- *Disclaimer: Major Players sorted in no particular order

Recent Industry Developments
- February 2026: Power2X acquired Netherlands-based hydrogen developer HyCC to accelerate clean hydrogen and e-molecule projects in Northern and Western Europe. This acquisition strengthens Power2X’s project pipeline, delivery capabilities, and green hydrogen infrastructure development, supporting decarbonization efforts and hydrogen deployment across the region.
- September 2025: Electric Hydrogen acquired Ambient Fuels and partnered with Generate Capital to establish global project financing for large-scale hydrogen generation and e-fuel infrastructure. This strategic initiative accelerates the deployment of electrolyzers and renewable hydrogen production while enhancing financial and project development capabilities worldwide.
- July 2025: Enertrag acquired land in Prenzlau, Germany, to develop a 130 MW green hydrogen production facility powered by renewable energy. The facility will focus on electrolysis-based hydrogen generation to supply the industrial and mobility sectors, contributing to Germany’s hydrogen infrastructure and renewable energy integration.
- March 2025: Saudi Aramco finalized its acquisition of a 50% stake in Air Products Qudra’s Blue Hydrogen Industrial Gases Company joint venture. This acquisition expands Aramco’s hydrogen production capacity and enhances its role in the low-carbon hydrogen supply chain for industrial and energy applications across the region.


Global Hydrogen Generation Market Report Scope
Hydrogen generation refers to the process of producing hydrogen gas, typically from hydrogen-containing compounds or sources. There are several methods for hydrogen generation, each with its own set of advantages and drawbacks.
The hydrogen generation market scope includes:
By Source
| Grey Hydrogen |
| Blue Hydrogen |
| Green Hydrogen |
| Turquoise Hydrogen |
| Pink Hydrogen |
By Technology
| Steam Methane Reforming (SMR) |
| Coal Gasification |
| Auto-Thermal Reforming (ATR) |
| Partial Oxidation (POX) |
| Electrolysis (Alkaline Electrolysis, Proton Exchange Membrane (PEM), Solid Oxide Electrolysis (SOE)) |
By Application
| Oil Refining |
| Chemical Processing (Ammonia, Methanol) |
| Iron and Steel (DRI, H₂-BF) |
| Transportation Fuel (FCEV, Marine, Aviation) |
| Power and Energy Storage |
| Residential and Commercial Heating |
By Geography
| North America | United States |
| Canada | |
| Mexico | |
| Europe | United Kingdom |
| Germany | |
| France | |
| Spain | |
| Nordics | |
| Turkey | |
| Russia | |
| Rest of Europe | |
| Asia-Pacific | China |
| India | |
| Japan | |
| South Korea | |
| ASEAN Countries | |
| Australia | |
| Rest of Asia-Pacific | |
| South America | Brazil |
| Argentina | |
| Rest of South America | |
| Middle East and Africa | United Arab Emirates |
| Saudi Arabia | |
| Egypt | |
| South Africa | |
| Rest of Middle East and Africa |
| By Source | Grey Hydrogen | |
| Blue Hydrogen | ||
| Green Hydrogen | ||
| Turquoise Hydrogen | ||
| Pink Hydrogen | ||
| By Technology | Steam Methane Reforming (SMR) | |
| Coal Gasification | ||
| Auto-Thermal Reforming (ATR) | ||
| Partial Oxidation (POX) | ||
| Electrolysis (Alkaline Electrolysis, Proton Exchange Membrane (PEM), Solid Oxide Electrolysis (SOE)) | ||
| By Application | Oil Refining | |
| Chemical Processing (Ammonia, Methanol) | ||
| Iron and Steel (DRI, H₂-BF) | ||
| Transportation Fuel (FCEV, Marine, Aviation) | ||
| Power and Energy Storage | ||
| Residential and Commercial Heating | ||
| By Geography | North America | United States |
| Canada | ||
| Mexico | ||
| Europe | United Kingdom | |
| Germany | ||
| France | ||
| Spain | ||
| Nordics | ||
| Turkey | ||
| Russia | ||
| Rest of Europe | ||
| Asia-Pacific | China | |
| India | ||
| Japan | ||
| South Korea | ||
| ASEAN Countries | ||
| Australia | ||
| Rest of Asia-Pacific | ||
| South America | Brazil | |
| Argentina | ||
| Rest of South America | ||
| Middle East and Africa | United Arab Emirates | |
| Saudi Arabia | ||
| Egypt | ||
| South Africa | ||
| Rest of Middle East and Africa | ||


Key Questions Answered in the Report
How large is the hydrogen generation market in 2026?
The hydrogen generation market size stands at USD 193.06 billion in 2026.
What CAGR is expected for global hydrogen production through 2031?
The market is projected to expand at a CAGR of 4.67% between 2026 and 2031.
Which region leads global hydrogen demand?
Asia-Pacific holds 54.54% of demand and is growing at a 5.85% CAGR.
What technology is growing fastest within hydrogen production?
Electrolysis capacity is increasing at a 10.44% CAGR, led by falling stack costs and renewable-power integration.
Which application segment shows the highest growth rate?
Transportation fuel uses of hydrogen are advancing at a 19.89% CAGR through 2031.
How does the U.S. Section 45V credit influence project economics?
Section 45V provides up to USD 3.00 per kilogram for low-emission hydrogen, enabling multi-gigawatt electrolysis projects and shortening payback periods below 10 years.
Page last updated on:


