Market Overview
| Study Period | 2021 - 2031 |
|---|---|
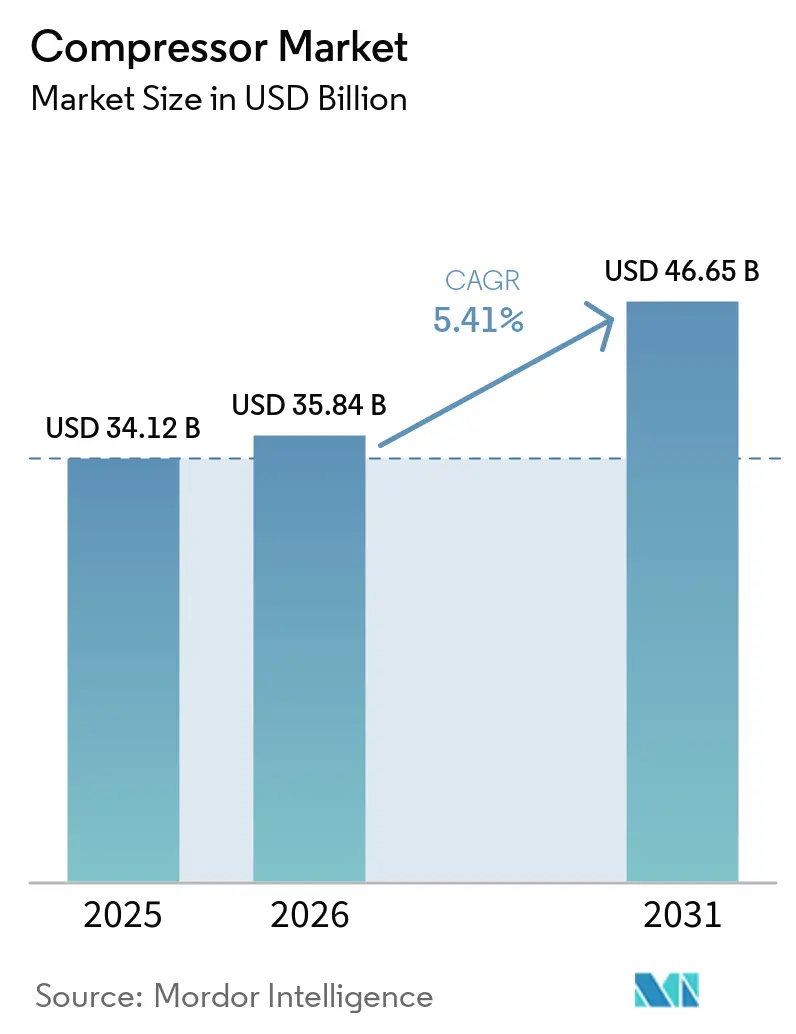
| Market Size (2026) | USD 35.84 Billion |
| Market Size (2031) | USD 46.65 Billion |
| Growth Rate (2026 - 2031) | 5.41% CAGR |
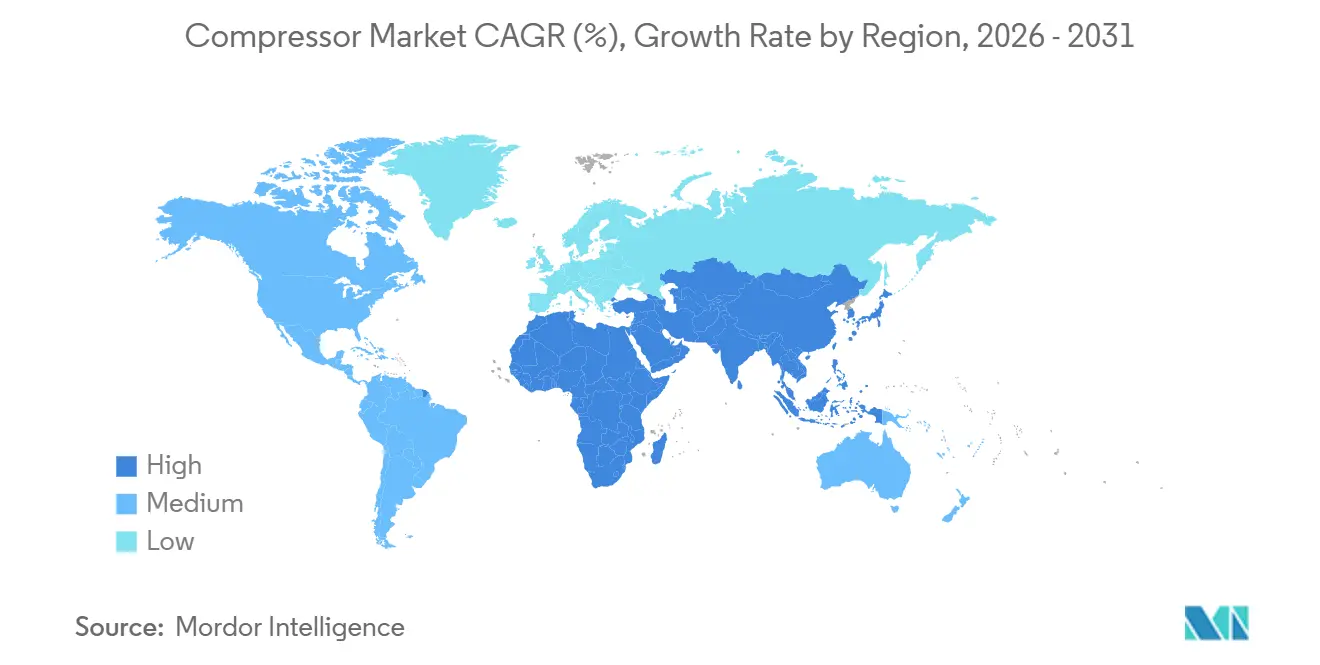
| Fastest Growing Market | Asia Pacific |
| Largest Market | Asia Pacific |
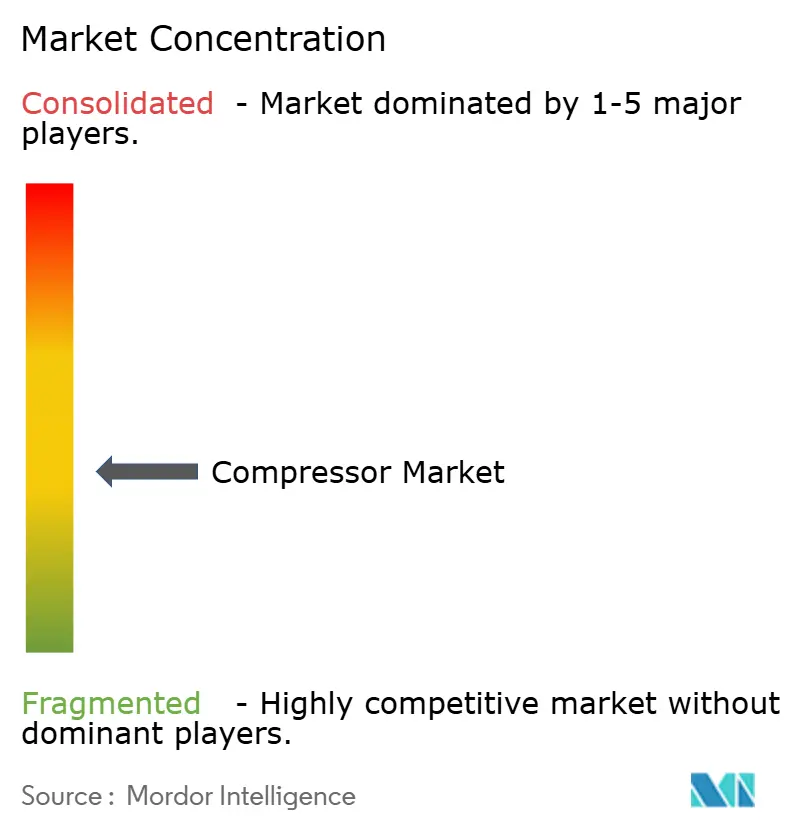
| Market Concentration | Medium |
Major Players *Disclaimer: Major Players sorted in no particular order Image © Mordor Intelligence. Reuse requires attribution under CC BY 4.0. | |
Compressor Market Analysis by Mordor Intelligence
The Compressor Market size is expected to increase from USD 34.12 billion in 2025 to USD 35.84 billion in 2026 and reach USD 46.65 billion by 2031, growing at a CAGR of 5.41% over 2026-2031.
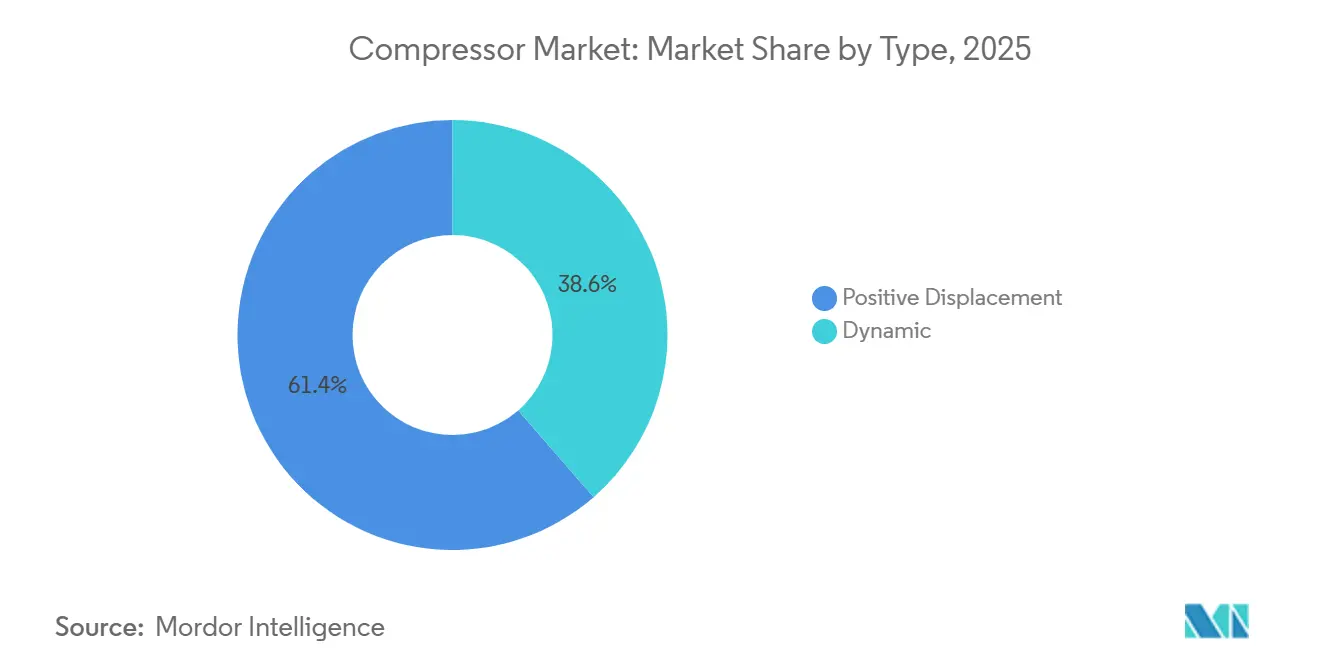
Positive displacement designs retained the leading 61.4% compressor market share in 2025, yet dynamic architectures are registering the fastest 5.8% expansion as LNG liquefaction and petrochemical mega-projects favor centrifugal efficiency. Stationary fleets deliver 70.5% of global revenue, but trailer-mounted diesel-electric hybrids are widening adoption at a 6.5% growth rate as construction, mining, and micro-grid developers seek mobile uptime and lower on-site emissions. Asia-Pacific, already holding 39.1% of 2025 demand, is advancing 6.1% yearly thanks to Chinese and Indian electrolyzer parks that need above-300-bar hydrogen compression. Macro policy levers, from the European Union’s 2025 minimum-efficiency thresholds to the United States’ upcoming oil-free air standards, continue to tilt specifications toward variable-speed, oil-free, and sensor-rich offerings.
Key Report Takeaways
- By type, positive displacement captured 61.4% of the compressor market share in 2025, whereas dynamic compressors are forecast to post the fastest 5.8% CAGR through 2031.
- By portability, stationary units accounted for 70.5% of the compressor market size in 2025, while portable offerings will accelerate at a 6.5% CAGR to 2031.
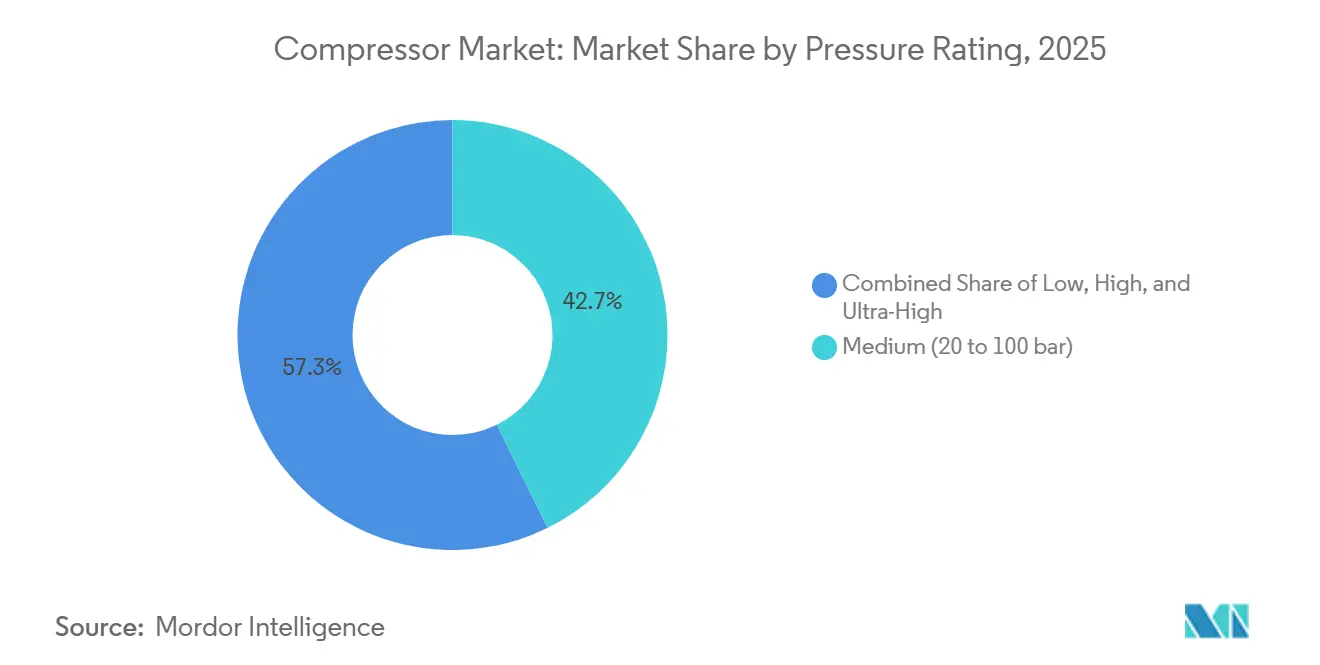
- By pressure, medium-pressure units commanded 42.7% of 2025 revenue; low-pressure alternatives are projected to advance at a 7.3% CAGR over the outlook.
- By end-user, oil and gas led with 34.3% of 2025 turnover; manufacturing is poised for a 6.2% CAGR on factory automation and ISO 50001 compliance.
- By geography, Asia-Pacific held 39.1% of global sales in 2025 and is expanding at a 6.1% CAGR to 2031, driven by LNG terminals and green-hydrogen projects, reinforcing growth across the compressor industry.
Note: Market size and forecast figures in this report are generated using Mordor Intelligence’s proprietary estimation framework, updated with the latest available data and insights as of January 2026.
Global Compressor Market Trends and Insights
Drivers Impact Analysis*
| Driver | (~) % Impact on CAGR Forecast | Geographic Relevance | Impact Timeline |
|---|---|---|---|
| Expansion of natural-gas infrastructure & LNG trade | 1.2% | Middle East, North America, Australia; spillover to APAC import terminals | Medium term (2-4 years) |
| Rapid industrial automation in APAC manufacturing | 1.4% | China, India, ASEAN core (Vietnam, Thailand, Indonesia) | Short term (≤ 2 years) |
| Stricter global energy-efficiency & oil-free-air mandates | 0.9% | EU, North America, select APAC markets (Japan, South Korea) | Long term (≥ 4 years) |
| Hydrogen value-chain demand for high-pressure compression | 0.8% | Europe, Middle East, select North America hubs (California, Texas) | Long term (≥ 4 years) |
| Distributed renewables & micro-grid on-site air systems | 0.5% | Global, with early traction in island nations and remote mining sites | Medium term (2-4 years) |
| IoT-enabled predictive-maintenance pull-through upgrades | 0.7% | Global, led by North America and Western Europe | Short term (≤ 2 years) |
| Source: Mordor Intelligence | |||
Expansion of Natural-Gas Infrastructure & LNG Trade
Qatar’s North Field South and East phases will add 64 million tpa of LNG by 2029, each train requiring >40 MW centrifugal machines.[1]QatarEnergy, “North Field Expansion Facts,” qatarenergy.qa The United States lifted LNG exports to 11.6 bcf/d in 2025, with Golden Pass deploying six frame-7 compressors per train. Australia’s Scarborough and Browse FLNG ventures are pioneering subsea compression by 2027, extending reservoir life. Vietnam and Bangladesh regas terminals are installing high-uptime skids that guarantee 98% availability in humid tropics. Central Asian pipelines are retrofitting Soviet-era reciprocating units with variable-speed centrifugal designs, cutting fuel-gas consumption by 20% and aligning with Paris pledges, supporting demand across the compressor industry.
Rapid Industrial Automation in APAC Manufacturing
China recorded robotic penetration at 68% of large factories in 2025, up from 52% two years prior, amplifying compressed-air refresh cycles across the compressor industry. India’s Production-Linked Incentive attracted USD 14 billion by early 2025, with EMS majors ordering oil-free rotary screws to avoid solder-paste defects. Vietnam’s USD 44 billion garment exports swapped belt-driven pistons for direct-drive permanent-magnet units to satisfy buyers’ energy audits. Thailand’s Eastern Economic Corridor automotive suppliers installed ISO 8573-1 Class 1 networks for paint booths in 2025. Indonesia’s 1.8 million-tonne nickel processing volume depends on 150-bar reciprocating fleets for conveying and kiln combustion.
Stricter Global Energy-Efficiency & Oil-Free-Air Mandates
The EU’s 2025 thresholds ban fixed-speed oil-flooded models above 50 kW, forcing compressor industry OEM lineups toward variable-speed, oil-free paths.[2]European Commission, “Recast Energy Efficiency Directive,” europa.eu The U.S. DOE’s pending rule will require oil-free certification in federally funded healthcare and food sites from mid-2026. Japan’s Top Runner expansion set benchmarks that reward heat-recovery add-ons in 2025. South Korea’s Green New Deal earmarked KRW 2.3 trillion for audits, with compressors supplying 18% of gains. ISO 50001:2024 elevated compressed-air systems to mandatory measurement boundaries, accelerating sensor deployments.
Hydrogen Value-Chain Demand for High-Pressure Compression
Germany’s H2Global auction allotted EUR 900 million for imports, and Hamburg terminals selected 450-bar reciprocating systems. California’s Advanced Clean Fleets rule catalyzed 87 hydrogen stations running 900-bar cascades. Saudi Arabia’s NEOM will compress 650 t/day green gas to 80 bar for ammonia by 2026. Burckhardt shipped its first 350-bar diaphragm model in March 2025 for European electrolyzers highlighting innovation across the compressor industry. The DOE’s Hydrogen Shot pegs compression at 10–15% of delivered cost, spurring linear-motor R&D.
Restraints Impact Analysis*
| Restraint | (~) % Impact on CAGR Forecast | Geographic Relevance | Impact Timeline |
|---|---|---|---|
| High capital & operating (energy) costs | -0.6% | Global, acute in regions with elevated electricity tariffs (Europe, Japan) | Short term (≤ 2 years) |
| Volatile raw-material & rare-earth magnet pricing | -0.4% | Global, supply-chain exposure in China-dependent OEMs | Medium term (2-4 years) |
| Shift to decentralized electric / pneumatic alternatives | -0.3% | North America, Europe; early adoption in automotive and electronics | Long term (≥ 4 years) |
| Regulatory squeeze on legacy oil-lubricated fleets | -0.2% | EU, North America, select APAC markets (Japan, South Korea) | Medium term (2-4 years) |
| Source: Mordor Intelligence | |||
High Capital & Operating Costs
A 500 kW oil-flooded screw running 6,000 h yearly at USD 0.12/kWh burns USD 360,000 in electricity, rivaling purchase price within 18 months. European tariffs at EUR 0.18/kWh in Q1 2025 caused many plants to favor leak repairs over new installs. Hydrogen units above 300 bar show a capex of USD 3,000–5,000/kW versus USD 800–1,200 for 7-bar machines, constraining uptake to subsidized pilots. SMEs across India and ASEAN face loan tenors capped at 3 years, while VSD conversions need 5–7 years to pay back. Electric actuators now outcompete pneumatics in many clamp-and-eject tasks, shrinking low-pressure demand.
Volatile Raw-Material & Rare-Earth Magnet Pricing
Neodymium-iron-boron magnets rose 35% in 2024-2025 after Chinese export quotas, inflating oil-free motor bills across the compressor industry. Hot-rolled coil volatility dented OEM margins by up to 3 points, forcing quarterly price resets. Copper at USD 9,200/t drove exploration of aluminum windings that sacrifice 8–10% efficiency. Semiconductor controller shortages doubled VSD lead times to 26 weeks in early 2025. Siemens Energy co-invested in a Texas rare-earth refinery to hedge China risk, start-up slated for 2027.
*Our forecasts treat driver/restraint impacts as directional, not additive. The impact forecasts reflect baseline growth, mix effects, and variable interactions.
Segment Analysis
By Type: Dynamic Designs Gain Traction in Mega-Projects
Dynamic units, chiefly centrifugal and axial, are projected to advance 5.8% CAGR through 2031, accelerating beyond the wider market even though they held only 38.6% revenue share in 2025.[3]Siemens Energy, “Centrifugal Compressor Portfolio,” siemens-energy.com Positive displacement designs still delivered most of the compressor market size at 61.4%, serving applications from 7-bar paint shops to 900-bar hydrogen stations. Reciprocating machines dominate above-300-bar services, hitting isentropic efficiency above 85%, while rotary screws remain the workhorse for general industry because of 30–40% lower capex than oil-free peers.
Rotary screws face mounting regulatory and contamination pressure in pharma and food lines, pivoting demand toward water-injected or dry-screw alternatives. Centrifugals excel in continuous-duty flows exceeding 10,000 m³/h, whereas axial variants, though niche, are penetrating wind-tunnel testing and CCS projects needing >100,000 m³/h at modest pressure lift. Rotary vanes, under 5% of unit sales, sustain mobile dental and vet services where sub-60 dB noise is valued. Combined, product proliferation keeps competitive differentiation high across the compressor market.


By Portability: Stationary Fleets Anchor Industrial Base
Stationary installations commanded 70.5% of the 2025 compressor market share because large plants integrate multi-megawatt banks feeding hundreds of drops through fixed piping.[4]Atlas Copco, “Oil-Free Screw Technology,” atlascopco.com Portable sets are accelerating 6.5% yearly as infrastructure builds in emerging regions, demand mobility, and hybrid power. Trailer hybrids pairing 375 kW diesels with 200 kWh batteries trim fuel 25% and allow silent night work under urban ordinances.
Stationary fleets capture energy-recovery benefits, reclaiming up to 90% input power as process heat or hot water, justifying a 15–20% capex premium in food and district-heating applications. Portable models contend with EU Stage V engine costs that add USD 8,000–12,000 per unit, nudging fleets toward battery-electric alternatives. Rental houses now link telematics to cut theft and lift utilization beyond 70%, reinforcing service differentiation in the compressor market.
By Pressure Rating: Low-Pressure Segments Accelerate
Medium-pressure (20–100 bar) equipment supplied 42.7% of 2025 turnover in the compressor industry, yet low-pressure offerings below 20 bar will post the leading 7.3% CAGR as F&B, pharma, and electronics favor oil-free air quality. High-pressure units between 100–300 bar remain stable, tied to gas-turbine starts and industrial gas filling. Ultra-high-pressure designs above 300 bar, though small today, may triple capacity by 2030 on hydrogen refueling and CCS wells.
Centrifugal blowers at 0.5–1.5 bar are displacing PD machines in wastewater aeration, saving energy 30% for municipalities across the compressors market. Medium-pressure reciprocating retrofits in the Permian are swapping gas engines for electric drives to curb methane slip. Diaphragm technology isolates process gas from lube oil, gaining traction in electrolyzers whose membranes are hypersensitive to hydrocarbons. Material innovations such as nickel-alloy liners and CFRP rings are critical once pressures top 400 bar, adding 50–70% to unit cost.
By End-User: Manufacturing Outpaces Traditional Oil & Gas
Oil and gas accounted for 34.3% of 2025 totals, but manufacturing is positioned for a 6.2% CAGR, buoyed by reshoring, automation, and ISO 50001 audits that prioritize variable-speed oil-free platforms. Power generation sees incremental gains from gas-turbine peakers that balance renewable intermittency. Chemicals and petrochemicals continue to deploy high-pressure process gas services in ethylene and ammonia lines, especially across new Middle East complexes.
HVAC-R upgrades in GCC district-cooling plants feature variable-speed centrifugals that shave peak loads 18–25%. EV battery gigafactories require ultra-dry air below –40 °F dew point, steering specifications to multi-stage desiccant dryers and oil-free screws. F&B processors migrating to ISO 8573-1 Class 0 designs trade 25–35% higher capex for zero recall risk. Healthcare facilities meet USP moisture and oil vapor limits via redundant dryers and medical-grade oil-free packages, a trend reinforcing service revenues within the compressor market.
Geography Analysis
Asia-Pacific’s 39.1% 2025 share and 6.1% CAGR through 2031 arise from automation, LNG terminals, and green-hydrogen ambitions driving growth in the compressors market across China, India, and ASEAN. China’s robot density soared to 392 units per 10,000 workers in 2025, expanding compressed-air grids across coastal provinces. India’s USD 14 billion electronics PLI funnel stimulated oil-free installs at Foxconn and Pegatron lines. Southeast Asia’s USD 120 billion garment exports now stipulate direct-drive PM machines to meet Nike and Adidas audits. Japan and South Korea retrofit semiconductor fabs with Class 0 centrifugal blowers, lifting yields 2–3 points.
North America, near 25% of 2025 sales in the compressors market, benefits from LNG build-outs, hydrogen pilots, and CHIPS Act fabs, yet faces rig-count volatility in shale basins. LNG exports hit 11.6 bcf/d in 2025, with frame-7 centrifugal banks at Golden Pass and Plaquemines. California’s fleet rule drives 900-bar station demand, while Canada funds electric reciprocating retrofits in the oil sands via CAD 750 million grants. Mexico’s 340 new plants under nearshoring added centralized air networks compliant with Detroit OEM expectations.
Europe’s roughly 22% stake in the compressors market reflects aggressive replacement of oil-lubricated fleets compelled by the 2025 efficiency recast. H2Global’s EUR 900 million contracts in 2024 secure 450-bar units for Hamburg and Wilhelmshaven. Eastern European suppliers installing oil-free fleets satisfy Western OEM Scope 3 audits, while Nordic wind-plus-pneumatic storage prototypes eye gigawatt-hour scale by 2028.

Competitive Landscape
The top five vendors, Atlas Copco, Ingersoll Rand, Siemens Energy, Baker Hughes, and Howden, control roughly 40% of the compressor market, leaving regional specialists to address niche pressures and verticals. Atlas Copco’s AIRConnect subscriptions rose 28% in 2025, adding USD 85 million high-margin revenue that cushions equipment cyclicality. White-space persists in >300-bar hydrogen compression, where Burckhardt and Ariel leverage diaphragm and labyrinth seals to counter material limits. Chinese challengers Fusheng and Kaishan seized 18% of APAC portable sales by undercutting prices 25–30% and extending 24-month terms.
Technology rivalry centers on oil-free stages, magnetic bearings, and digital twins. Siemens Energy’s Sensformer cuts LNG bearing overhauls by 33%, offering differentiated lifecycle economics. Patent activity in magnetic bearings climbed 34% during 2024-2025, spearheaded by Ingersoll Rand, Danfoss, and SKF. Regulatory credentials like ISO 8573-1 Class 0 and FDA Part 11 command 15–20% premiums in pharma and F&B tenders, insulating pricing power inside the compressor market.
Compressor Industry Leaders
Atlas Copco AB
Siemens Energy AG
Gardner Denver Holdings Inc.
Kaeser Kompressoren SE
Ingersoll Rand plc
- *Disclaimer: Major Players sorted in no particular order

Recent Industry Developments
- December 2025: Atlas Copco has unveiled the XAS 58 and XAS 78 portable air compressors. These new models cater to construction and industrial jobs where space is at a premium. They boast a compact and lightweight design (weighing under 750kg for easy towing) and come equipped with a robust HardHat® canopy.
- July 2025: Hitachi Global Air Power unveiled the Sullair OFE1550. This new, zero-emission, oil-free portable electric air compressor delivers 1550 CFM of Class 0 oil-free air at 125 PSI. Tailored for purity-critical sectors such as food and beverage, the OFE1550 boasts a durable TEFC motor, an intuitive touch screen, and simplified maintenance.
- February 2025: Elgi Equipments, a leader in the compressor market, has launched its STABILISOR technology, redefining industrial air compression. Unveiled on February 8th, 2025, it addresses instability, inefficiency, and wear-and-tear from fluctuating air demands.
- April 2024: The Srikail gas field in Cumilla signed a contract to receive three wellhead compressors with a capacity of 10 million cubic feet per day, along with related infrastructure, owing to a deal inked by Bangladesh Petroleum Exploration and Production Company Ltd and SC Euro Gas Systems SRL, Romania.


Research Methodology Framework and Report Scope
Market Definitions and Key Coverage
Our study defines the global compressor market as the sale of new, factory-built positive-displacement and dynamic compressors used to raise gas pressure across industrial, energy, and process applications. Units supplied as part of complete packaged systems are included, yet vacuum pumps and turbo-expanders are outside the frame.
Scope Exclusion: Rentals and aftermarket services are excluded to keep the baseline tied only to original equipment sales.
Segmentation Overview
- By Type
- Positive Displacement
- Reciprocating
- Rotary Screw
- Rotary Vane
- Dynamic
- Centrifugal
- Axial
- Positive Displacement
- By Portability
- Stationary
- Portable
- By Pressure Rating
- Low (Up to 20 bar)
- Medium (20 to 100 bar)
- High (100 to 300 bar)
- Ultra-High (Above 300 bar)
- By End-User
- Oil and Gas
- Power Generation
- Manufacturing and Industrial
- Chemicals and Petrochemicals
- HVAC-R and Building Services
- Automotive and Transportation
- Food and Beverage
- Healthcare and Pharmaceuticals
- By Geography
- North America
- United States
- Canada
- Mexico
- Europe
- Germany
- France
- United Kingdom
- Italy
- Spain
- NORDIC Countries
- Russia
- Turkey
- Rest of Europe
- Asia-Pacific
- China
- India
- Japan
- South Korea
- ASEAN Countries
- Australia and New Zealand
- Rest of Asia-Pacific
- South America
- Brazil
- Argentina
- Colombia
- Rest of South America
- Middle East and Africa
- Saudi Arabia
- United Arab Emirates
- Qatar
- South Africa
- Nigeria
- Egypt
- Rest of Middle East and Africa
- North America
Detailed Research Methodology and Data Validation
Primary Research
Mordor analysts interviewed compressor OEM executives, EPC contractors, and midstream operators across Asia, North America, and the Gulf to validate utilization trends, duty cycles, and price bands. End-user surveys in power and discrete manufacturing tested purchase criteria and replacement intervals, sharpening model coefficients.
Desk Research
We began with public data sets from organizations such as the US Energy Information Administration, Eurostat, and China's National Bureau of Statistics to size energy-linked demand pools. Trade flow records from UN Comtrade, patent counts via Questel, and installation tallies released by the International Gas Union mapped technology dispersion and export intensity. Company 10-Ks, investor decks, and reputable trade journals supplied average selling price signals. Subscription sources include D&B Hoovers for producer revenues and Dow Jones Factiva for volume-weighted news-filled residual gaps. This list is illustrative; many additional references informed our evidence base.
Market-Sizing & Forecasting
A top-down build starts with industrial value added, natural-gas throughput, and refinery capacity, which are then converted into compressor intensity ratios derived from field interviews. Results are cross-checked with selective bottom-up snapshots, sampled OEM shipments, and channel checks before reconciliation. Key variables include pipeline kilometer additions, industrial production index, average plant load factors, compressor mean time between overhauls, and region-specific ASP trajectories. We project forward through multivariate regression, pairing statistically significant drivers with consensus growth ranges gathered during primary research. Where bottom-up samples diverge, gaps are prorated using historical replacement cycles.
Data Validation & Update Cycle
Outputs pass anomaly filters, peer review, and a senior analyst sign-off. Models refresh annually, with interim updates triggered by policy shifts or sizable supply-chain announcements; a last-minute sense check precedes every client delivery.
Why Mordor's Compressor Baseline Commands Reliability
Published 2025 estimates differ widely because firms slice the market by product family, lubrication, or service inclusion, and they refresh at unequal cadences.
Key gap drivers include narrower 'air-only' scopes, omission of dynamic compressors, differing ASP escalation logic, and less frequent model updates, all of which compress or inflate totals relative to our balanced build.
Benchmark comparison
| Market Size | Anonymized source | Primary gap driver |
|---|---|---|
| USD 34.12 B (2025) | Mordor Intelligence | - |
| USD 27.75 B (2025) | Global Consultancy A | Excludes pipeline booster and refinery process units |
| USD 18.96 B (2025) | Trade Journal B | Focuses only on packaged air systems below 1 MW, uses list prices without regional weighting |
These comparisons show that when scope breadth, variable choice, and update frequency are harmonized, our figure sits midway between stripped-down and over-aggregated counts, giving decision-makers a dependable, transparent starting point.


Key Questions Answered in the Report
How large is the compressor market in 2026?
The compressor market size reached USD 35.84 billion in 2026, expanding toward USD 46.65 billion by 2031 at a 5.41% CAGR.
Which compressor technology is growing fastest?
Dynamic configurations, notably centrifugal and axial machines, are forecast to expand at a 5.8% CAGR through 2031 thanks to LNG and petrochemical mega-projects.
Why is Asia-Pacific leading demand?
The region’s share is 39.1% on the back of automation upgrades, LNG import infrastructure, and large-scale green-hydrogen parks in China and India.
How are regulations shaping product design?
The EU’s 2025 efficiency rules and the U.S. move to oil-free mandates are steering specifications toward variable-speed, oil-free, sensor-equipped units.
Which end-user vertical shows the highest growth potential?
Manufacturing and general industry are set for a 6.2% CAGR as factories retrofit for ISO 50001 compliance and automation.
Page last updated on:


