Noble Gas Market Size and Share
Market Overview
| Study Period | 2021 - 2031 |
|---|---|
| Market Volume (2026) | 6.24 Billion cubic meters |
| Market Volume (2031) | 7.60 Billion cubic meters |
| Growth Rate (2026 - 2031) | 4.03% CAGR |
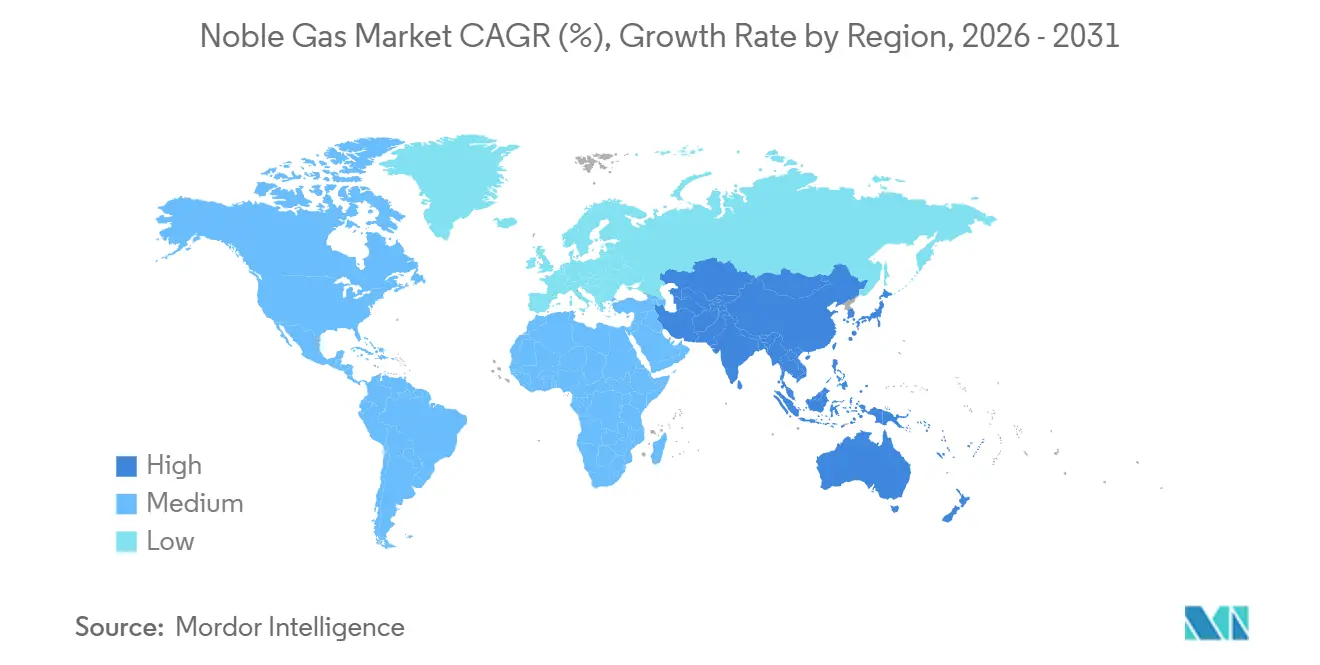
| Fastest Growing Market | Asia Pacific |
| Largest Market | Asia Pacific |
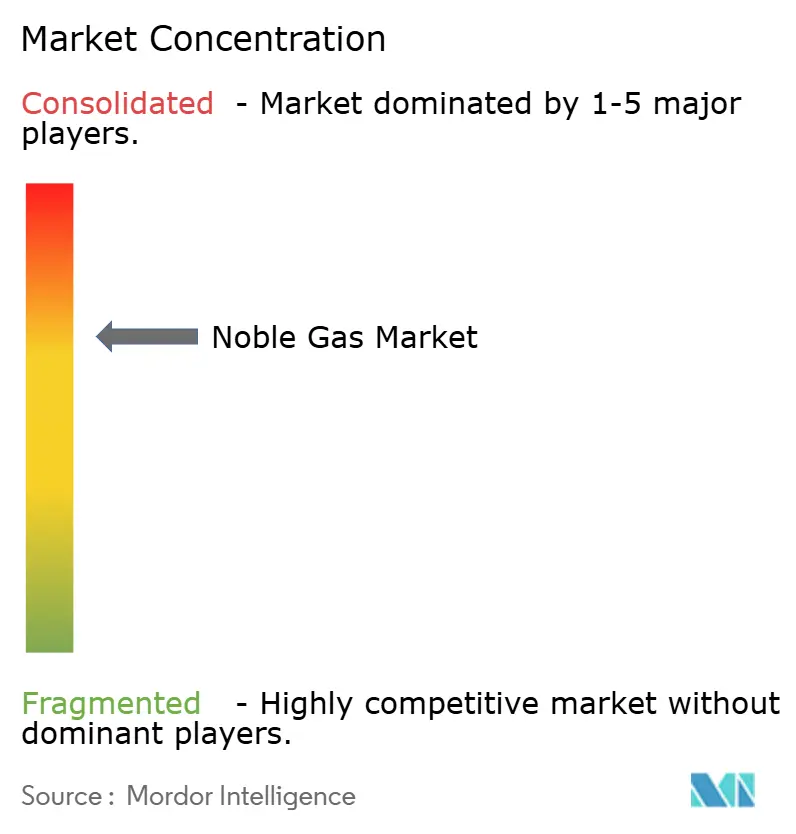
| Market Concentration | Medium |
Major Players *Disclaimer: Major Players sorted in no particular order Image © Mordor Intelligence. Reuse requires attribution under CC BY 4.0. | |

Noble Gas Market Analysis by Mordor Intelligence
The Noble Gas Market size is estimated at 6.24 billion cubic meters in 2026, and is expected to reach 7.60 billion cubic meters by 2031, at a CAGR of 4.03% during the forecast period (2026-2031). Momentum stems from semiconductor-grade neon demand in Asia-Pacific, the return of argon-heavy welding activity in steel and automotive plants, and greenfield helium discoveries in Africa and Canada. High-purity requirements for MRI magnets, additive-manufacturing atmospheres, and ion-propulsion xenon continue to elevate purity specifications, further tightening supply. Integrated industrial-gas majors are responding with on-site generation, long-term take-or-pay contracts, and modular liquefaction units, while exploration juniors secure offtake deals before first production to lock in downstream customers. Elevated electricity prices in Europe, helium price volatility, and export-control measures constitute the chief headwinds that temper the noble gas market trajectory. Strategic collaboration between gas producers and end users around recycling technologies and carbon-intensity goals is, therefore, becoming a decisive competitive lever.
Key Report Takeaways
- By type, argon commanded 56.12% of the noble gas market share in 2025, while neon is advancing at a 7.12% CAGR through 2031.
- By geography, Asia-Pacific captured 51.12% of the noble gas market size in 2025 and is expanding at a 5.64% CAGR over the forecast window.
Note: Market size and forecast figures in this report are generated using Mordor Intelligence’s proprietary estimation framework, updated with the latest available data and insights as of January 2026.
Global Noble Gas Market Trends and Insights
Drivers Impact Analysis*
| Drivers | (~) % Impact on CAGR Forecast | Geographic Relevance | Impact Timeline |
|---|---|---|---|
| Rising healthcare demand for ultra-high-purity helium | +0.8% | Global, with concentration in North America, Europe, and Japan | Medium term (2-4 years) |
| Resurgence of steel and automotive welding activity | +1.2% | Asia-Pacific core, spill-over to North America and Europe | Short term (≤ 2 years) |
| Expansion of semiconductor fabs in Asia-Pacific | +1.5% | Taiwan, South Korea, China, with secondary impact in Japan and Singapore | Long term (≥ 4 years) |
| Rapid uptake of additive-manufacturing shielding atmospheres | +0.6% | North America and Europe, early adoption in China | Medium term (2-4 years) |
| Exploration of low-carbon, primary-helium fields in Africa and Canada | +0.5% | Global supply impact, with production concentrated in South Africa, Tanzania, and Canada | Long term (≥ 4 years) |
| Source: Mordor Intelligence | |||
Rising Healthcare Demand for Ultra-High-Purity Helium
Global installations of MRI systems, which still rely on substantial helium volumes to maintain superconducting magnets at a chilly 4.2 Kelvin, have been growing, driven by an aging population's increasing need for imaging procedures[1]World Health Organization, “Global MRI Installations,” who.int. While Philips' BlueSeal magnet has successfully slashed helium consumption, a significant portion of the installed base still comprises legacy equipment, ensuring a meaningful helium demand persists. Hospitals in the United States and Germany, reacting to rising spot quotes, extended their replenishment contracts to longer terms, aiming for price stability. Meanwhile, Japan's portable MRI prototypes embarked on clinical trials, hinting at a potential demand shift. Yet, with cryogen-free designs still in their infancy, the healthcare sector remains a cornerstone for helium industry demand within the noble gas market.
Resurgence of Steel and Automotive Welding Activity
In 2024, China produced a high quantity of crude steel, restoring pre-pandemic throughput and accelerating argon uptake for shielded welding[2]World Steel Association, “Crude Steel Production 2024,” worldsteel.org. Electric-vehicle battery-pack fabrication needs argon purities above 99.996%, and Tesla’s Shanghai plant alone consumed a portion of China’s merchant supply. European automakers have shifted to laser-arc hybrid welding that co-uses helium to deepen weld penetration, adding to consumption across Germany, France, and Spain in 2024. Fabricators favored multi-year agreements indexed to power costs to mitigate European electricity price spikes. Robust welding dynamics therefore reinforce argon’s dominant role within the noble gas market.
Expansion of Semiconductor Fabs in Asia-Pacific
TSMC allocated a budget for 2024-2025, aiming to expand its 3 nm and 2 nm production lines. Each of these fabs will require neon each month for excimer-laser lithography. Meanwhile, Samsung rolled out an ambitious strategy extending through 2030. In a strategic move, Samsung has also implemented neon recycling, capturing a significant portion of its feedstock and thereby reducing its dependence on unpredictable imports. Air Liquide has activated on-site plants at TSMC’s Kaohsiung campus in 2024, locking in long-term contracts to buffer against price fluctuations. Additionally, Posco’s Gwangyang plant, which began operations in 2025, is now producing high-purity neon domestically, cutting South Korea's reliance on imports. Collectively, these investments not only heighten end-use intensity but also bolster Asia-Pacific's dominance in the noble gas market.
Rapid Uptake of Additive-Manufacturing Shielding Atmospheres
In 2024, GE Aerospace's Alabama facility utilized argon, cementing its status as the preferred shielding gas for laser powder-bed fusion printers. These printers, essential for aerospace and medical implants, mandate inert environments with oxygen levels below 100 ppm. In a strategic move, GE inked a deal with Air Products, incorporating telemetry-based inventory controls. Meanwhile, the demand for helium blends is on the rise, as they're increasingly specified for thin-wall titanium parts to expedite cooling in additive workflows. In a notable trend, integrated gas majors are now bundling fixed-price gas supplies with printer sales. This strategy not only enables OEMs to capitalize on service agreements but also ensures stringent gas purity guarantees. Furthermore, this model pre-allocates incremental argon volume, offering a strategic edge ahead of spot markets and bolstering demand visibility in the noble gas market.
Restraints Impact Analysis*
| Restraints | (~) % Impact on CAGR Forecast | Geographic Relevance | Impact Timeline |
|---|---|---|---|
| Helium and neon price volatility | -0.9% | Global, with acute impact in North America, Europe, and Asia-Pacific semiconductor hubs | Short term (≤ 2 years) |
| Energy-intensive cryogenic separation costs | -0.7% | Europe and North America, where electricity tariffs are elevated | Medium term (2-4 years) |
| Tightening export controls on critical gases | -0.5% | United States, China, and Russia, with downstream effects in import-dependent regions | Long term (≥ 4 years) |
| Source: Mordor Intelligence | |||
Helium and Neon Price Volatility
In 2024-2025, the United States' helium spot prices fluctuated due to outages at the Cliffside storage site and reduced exports from Russia. Neon prices experienced sharper spikes when Ukraine halted production. Chinese suppliers stepped in, commanding premium prices until new capacity became operational in 2025. While major semiconductor companies shielded themselves through volume-commitment contracts, smaller OEMs faced margin pressures, leading to a slowdown in capital expenditures. This heightened volatility not only dampens discretionary consumption but also increases working-capital requirements, moderating short-term growth in the noble gas market.
Energy-Intensive Cryogenic Separation Costs
In the noble gas market, European demand faces a persistent drag due to soaring power costs. Cryogenic units are feeling the pinch as German power tariffs surged over the years, notably squeezing merchant margins. In response, Linde undertook a retrofitting of waste-heat recovery at its Leuna complex, achieving a commendable reduction in electricity use. However, the company is contending with payback periods extending beyond five years. This economic reality has led operators in Belgium and the Netherlands to close down inefficient plants, resulting in a tighter regional supply. Consequently, this has spurred the establishment of multi-year contracts that include energy pass-through clauses.
*Our forecasts treat driver/restraint impacts as directional, not additive. The impact forecasts reflect baseline growth, mix effects, and variable interactions.
Segment Analysis
By Type: Argon Dominates, Neon Accelerates
Argon held 56.12% of the noble gas market volume in 2025, reflecting entrenched use in metal-inert-gas and tungsten-inert-gas welding across global steel and automotive plants. China’s surge in electric-vehicle output and battery-pack fabrication lifted argon demand, and India’s capacity expansions under the Production-Linked Incentive scheme sustained elevated off-take through 2025. The noble gas market size attributed to argon is forecast to continue expanding in absolute terms, although its share erodes gradually as neon growth outpaces it.
Neon is projected to grow at a 7.12% CAGR through 2031, the fastest among noble gases, as extreme ultraviolet lithography triples gas consumption per wafer compared with deep ultraviolet tools. Helium demand rose modestly, constrained by North American field depletion and price swings that pushed end users toward recycling. Krypton enjoyed incremental pull from insulating-glass standards, while xenon benefited from a robust satellite launch cadence. Despite these shifts, argon remains the anchor of the noble gas market, whereas neon represents the principal growth lever driving rebalancing across the portfolio.


Geography Analysis
Asia-Pacific accounted for 51.12% of the noble gas market volume in 2025 and is tracking a 5.64% CAGR to 2031, bolstered by semiconductor fab build-outs, steel capacity expansions, and accelerating electric-vehicle production. In 2025, chipmakers advanced to 3 nm nodes, leading Taiwan and South Korea to increase neon consumption. Meanwhile, in 2024, India witnessed significant volume growth, thanks to new air-separation units launched by Air Liquide in Gujarat. Dominating the scene, China accounted for a substantial share of global argon consumption.
In 2025, North America maintained a steady share but is shifting from a domestic helium surplus to a reliance on imports, as traditional reservoirs in Kansas and Texas dwindle. Meanwhile, exploration companies in Alberta and Saskatchewan are racing to bridge the gap. In a significant move, Air Products has committed USD 500 million in Louisiana, focusing on helium recovery from Gulf Coast gas streams. Europe grapples with high power costs and an aging cryogenic infrastructure. These challenges limit supply flexibility, leading industry giants Linde and Messer to prioritize retrofitting existing facilities over establishing new ones. South America and the Middle East are buoyed by Brazil's steel production and Saudi Arabia's petrochemical initiatives. This localized demand is further bolstered by Gulf Cryo's expanded network across the GCC.

Competitive Landscape
The noble gas market is moderately consolidated. Players' vertically integrated models pair production, liquefaction, and distribution with proprietary cylinders, telemetry, and gas management software, raising switching costs for end users. Smaller entrants such as First Helium and Pulsar Helium inverted conventional project finance by pre-selling volumes to electronics OEMs, a tactic that secures revenue visibility and accelerates field development. Compliance with ISO 9001 and ISO 14001 has become a baseline rather than a differentiator, yet suppliers that can certify lower carbon intensity enjoy preferential access to aerospace and pharmaceutical customers seeking Scope 3 reductions.
Noble Gas Industry Leaders
Linde plc
Air Liquide
Air Products and Chemicals Inc.
Messer North America, Inc.
TAIYO NIPPON SANSO CORPORATION
- *Disclaimer: Major Players sorted in no particular order

Recent Industry Developments
- September 2025: Messer North America, Inc. signed a long-term SPA with QatarEnergy for 3 million m³ of high-purity helium annually, sourced from Ras Laffan, enhancing supply security for downstream customers.
- July 2025: Linde plc commissioned one of the world’s largest helium storage caverns in Beaumont, Texas, with 3 billion ft³ capacity, bolstering reliability amid global supply swings.


Global Noble Gas Market Report Scope
Noble gases are odorless, colorless gases with very low chemical reactivity at standard conditions. Naturally occurring noble gases are helium, neon, argon, krypton, xenon, and radon. The noble gas market is segmented by type and geography. By type, the market is segmented into helium, krypton, argon, neon, xenon, and radon. The report also covers the market size and forecasts for the noble gas market in 20 countries across the major regions. For each segment, the market sizing and forecasts have been done based on volume (cubic meters).
| Helium | Healthcare |
| Electronics | |
| Welding Cover Gas | |
| Lifting Gas | |
| Controlled Atmospheres | |
| Leak Detection | |
| Breathing Mixtures | |
| Analytical Gas | |
| Other Applications/End-user Industries | |
| Krypton | Construction (Insulating Glass) |
| Lighting | |
| Excimer Lasers | |
| Other Applications/End-user Industries | |
| Argon | Protective Gas for Welding |
| Electronics and Semiconductor | |
| Lighting | |
| Other Applications/End-user Industries | |
| Neon | Electronics (Lasers) |
| Display Components | |
| Lighting | |
| Other Applications/End-user Industries | |
| Xenon | Lighting |
| Satellites | |
| Healthcare (Anesthetics) | |
| Electronics (Photolithiography) | |
| Electronics (Lasers) | |
| Plasma/AMOLED Screens | |
| Other Applications/End-user Industries | |
| Radon |
| Asia-Pacific | China |
| India | |
| Japan | |
| South Korea | |
| ASEAN Countries | |
| Rest of Asia-Pacific | |
| North America | United States |
| Canada | |
| Mexico | |
| Europe | Germany |
| Belgium | |
| United Kingdom | |
| Italy | |
| France | |
| Spain | |
| Russia | |
| Netherlands | |
| Rest of Europe | |
| South America | Brazil |
| Argentina | |
| Rest of South America | |
| Middle-East and Africa | Saudi Arabia |
| South Africa | |
| Rest of Middle-East and Africa |
| By Type | Helium | Healthcare |
| Electronics | ||
| Welding Cover Gas | ||
| Lifting Gas | ||
| Controlled Atmospheres | ||
| Leak Detection | ||
| Breathing Mixtures | ||
| Analytical Gas | ||
| Other Applications/End-user Industries | ||
| Krypton | Construction (Insulating Glass) | |
| Lighting | ||
| Excimer Lasers | ||
| Other Applications/End-user Industries | ||
| Argon | Protective Gas for Welding | |
| Electronics and Semiconductor | ||
| Lighting | ||
| Other Applications/End-user Industries | ||
| Neon | Electronics (Lasers) | |
| Display Components | ||
| Lighting | ||
| Other Applications/End-user Industries | ||
| Xenon | Lighting | |
| Satellites | ||
| Healthcare (Anesthetics) | ||
| Electronics (Photolithiography) | ||
| Electronics (Lasers) | ||
| Plasma/AMOLED Screens | ||
| Other Applications/End-user Industries | ||
| Radon | ||
| By Geography | Asia-Pacific | China |
| India | ||
| Japan | ||
| South Korea | ||
| ASEAN Countries | ||
| Rest of Asia-Pacific | ||
| North America | United States | |
| Canada | ||
| Mexico | ||
| Europe | Germany | |
| Belgium | ||
| United Kingdom | ||
| Italy | ||
| France | ||
| Spain | ||
| Russia | ||
| Netherlands | ||
| Rest of Europe | ||
| South America | Brazil | |
| Argentina | ||
| Rest of South America | ||
| Middle-East and Africa | Saudi Arabia | |
| South Africa | ||
| Rest of Middle-East and Africa | ||


Key Questions Answered in the Report
What is the projected volume of the noble gas market in 2031?
The noble gas market is forecast to reach 7.60 billion cubic meters by 2031, representing a 4.03% CAGR from 6.24 billion cubic meters in 2026.
Which segment currently dominates noble gas demand?
Argon dominates with a 56.12% share of global volume in 2025, primarily due to welding applications in steel and automotive production.
Why is neon demand growing faster than other noble gases?
Extreme ultraviolet lithography at advanced semiconductor nodes triples neon consumption per wafer, driving a 7.12% CAGR for neon through 2031.
How are price fluctuations affecting helium supply agreements?
Volatile helium pricing encouraged MRI providers and electronics OEMs to secure multi-year, fixed-volume contracts that shift price risk to suppliers.
Which region leads noble gas consumption today?
Asia-Pacific leads with 51.12% of global volume in 2025 and is expanding at a forecast 5.64% CAGR through 2031.
What technological advances are changing the competitive landscape?
Energy-efficient cryogenic distillation and on-site neon recycling are key innovations that reduce operating costs and secure supply for semiconductor fabs.
Page last updated on:


