Laser-induced Breakdown Spectroscopy Market Size and Share
Market Overview
| Study Period | 2019 - 2030 |
|---|---|
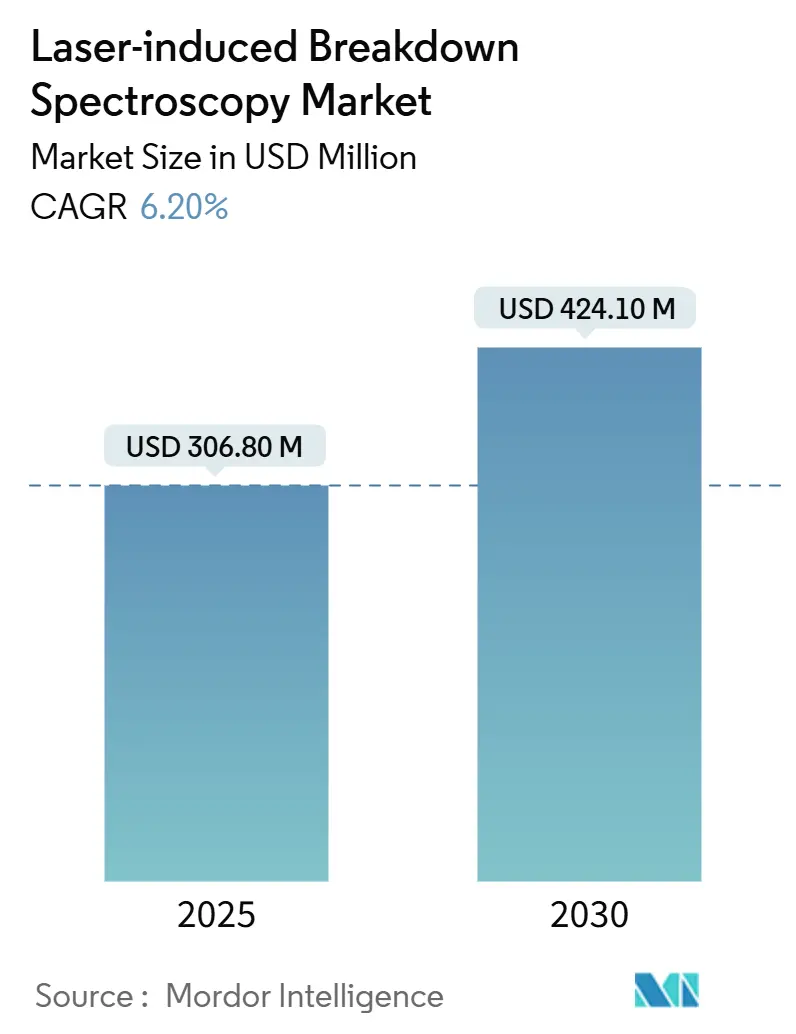
| Market Size (2025) | USD 306.80 Million |
| Market Size (2030) | USD 424.10 Million |
| Growth Rate (2025 - 2030) | 6.20% CAGR |
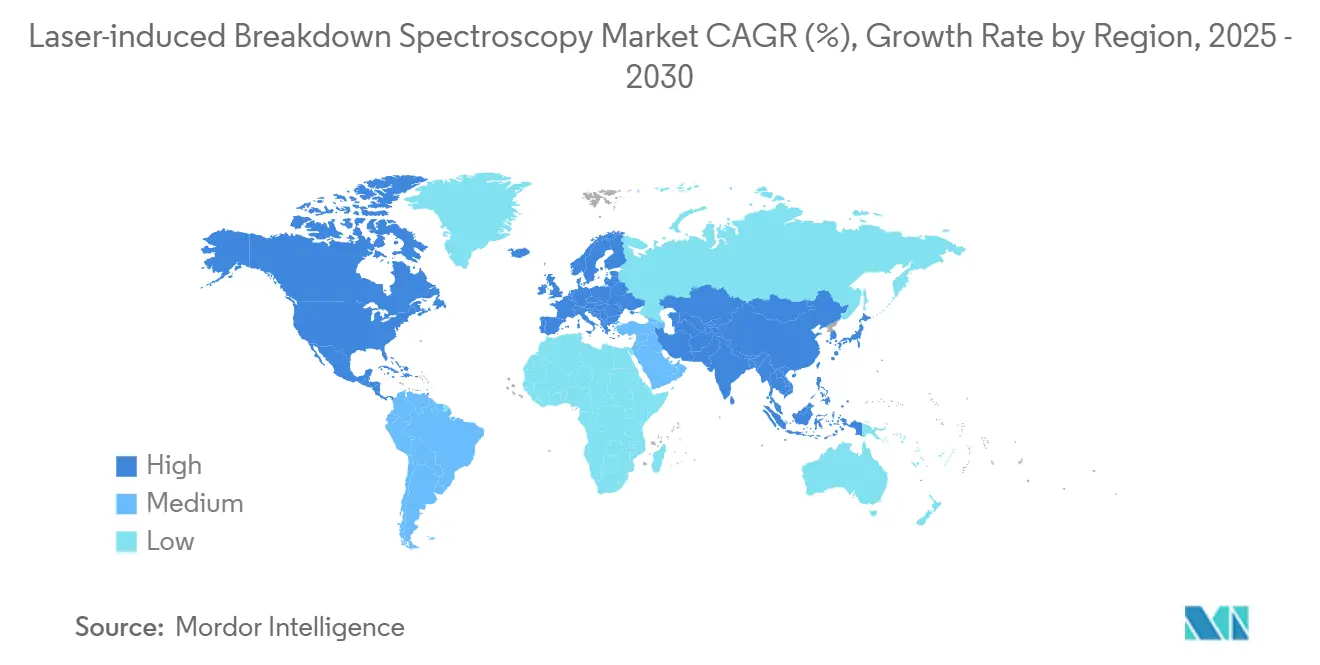
| Fastest Growing Market | Asia Pacific |
| Largest Market | North America |
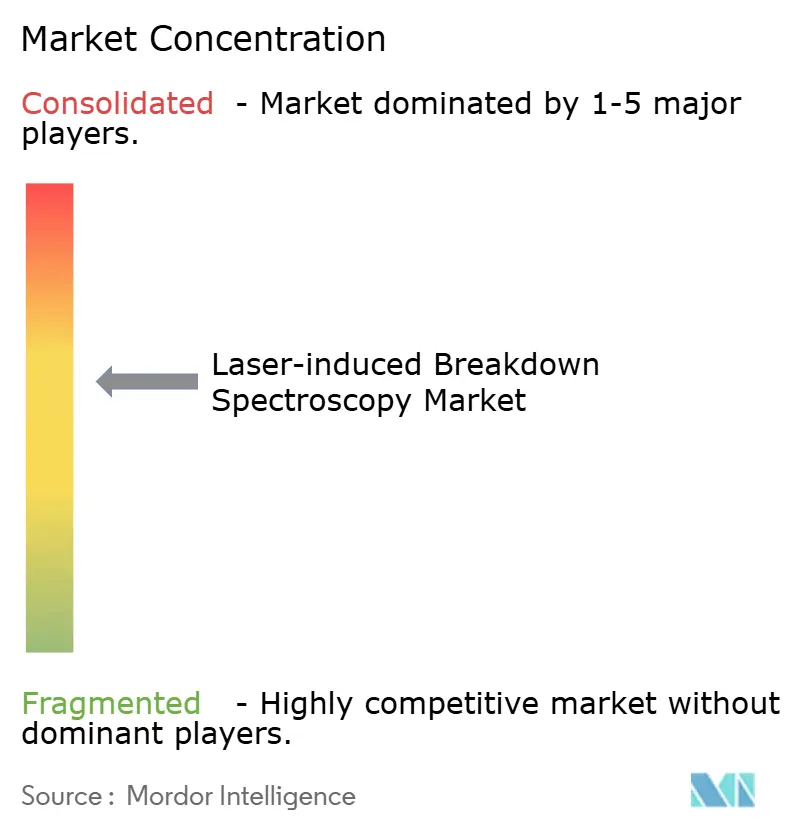
| Market Concentration | Medium |
Major Players *Disclaimer: Major Players sorted in no particular order Image © Mordor Intelligence. Reuse requires attribution under CC BY 4.0. | |
Laser-induced Breakdown Spectroscopy Market Analysis by Mordor Intelligence
The LIBS market size stands at USD 306.8 million in 2025 and is forecast to grow at a 6.20% CAGR to USD 424.1 million by 2030, reflecting sustained demand for portable, real-time elemental analytics across industrial value chains. Overall momentum in the LIBS market is anchored in three linked forces: stricter environmental and product-safety regulations, rapid miniaturization of solid-state lasers and spectrometers, and growing capital flows into battery and critical-mineral supply chains that reward in-situ verification. Handheld and portable analyzers already account for nearly one-half of the LIBS market, illustrating how portability has turned what was once a laboratory-confined technique into a frontline tool for process control, scrap sorting, and field geology. Stand-off and remote LIBS systems advance fastest at 6.2% CAGR because they eliminate sample preparation and can interrogate hazardous or inaccessible materials, a capability valued in nuclear, space, and deep-sea applications. Metals and mining maintain leadership, yet environmental and agricultural monitoring is expanding quickly as regulators raise the bar on heavy-metal contamination in soil, water, and food. North America leads the LIBS market on the back of a USD 75 million federal investment in critical minerals R&D and a history of NASA-validated deployments, while Asia-Pacific is the growth engine because of China’s dominance in rare-earth processing and battery manufacturing.
Key Report Takeaways
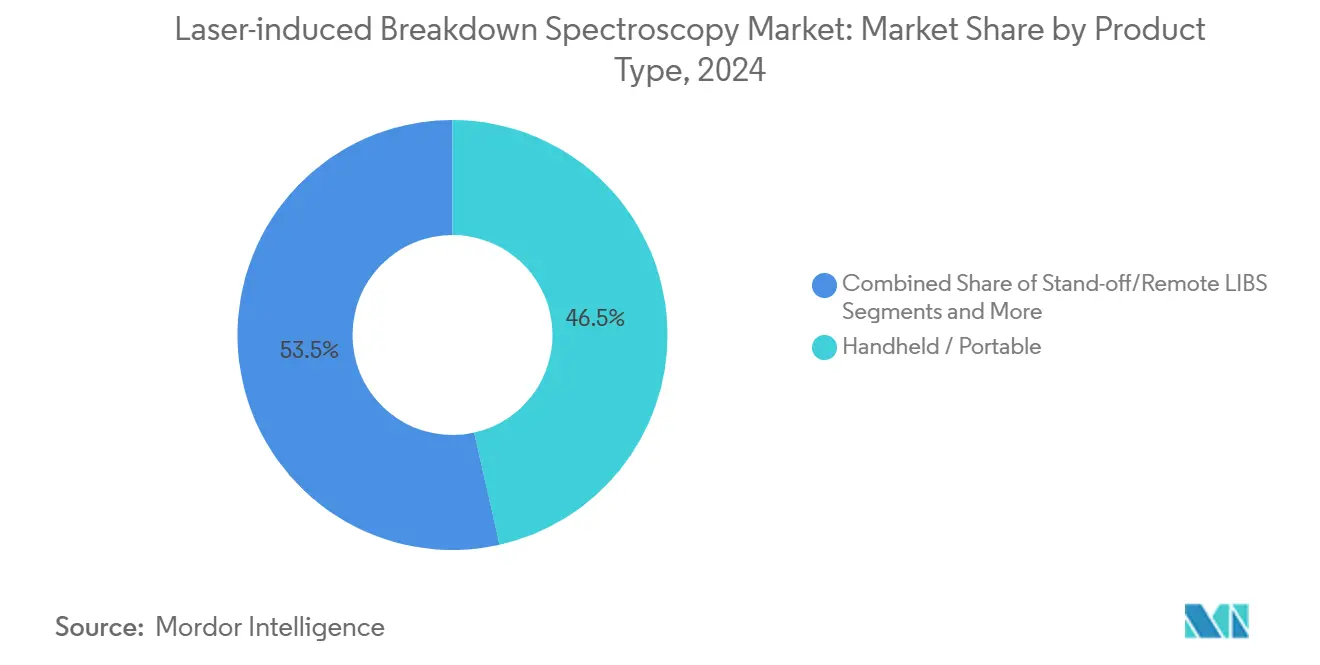
- By product type, handheld and portable analyzers held 46.5% of LIBS market share in 2024, while stand-off and remote systems are projected to expand at a 6.2% CAGR through 2030.
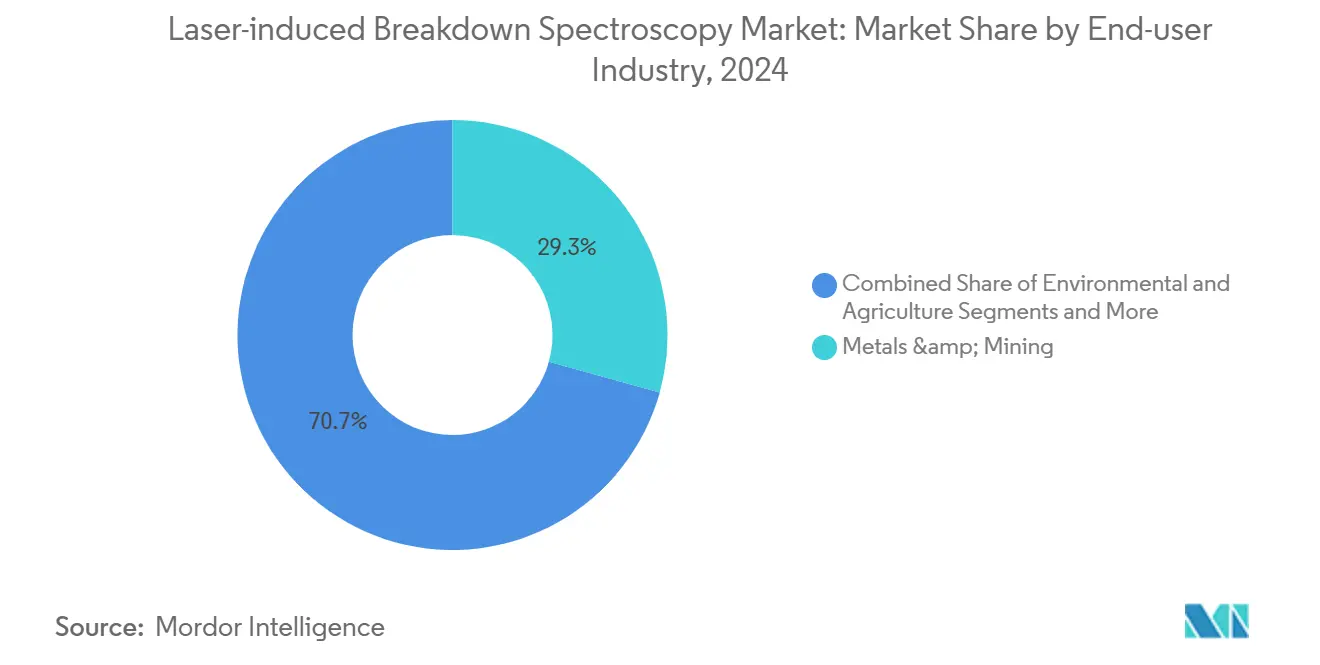
- By end-user, the metals and mining segment led with 29.3% revenue share in 2024; environmental and agriculture monitoring is forecast to post the fastest 5.4% CAGR to 2030.
- Geographically, North America retained 34.7% share of the LIBS market in 2024, whereas Asia-Pacific is advancing at a 5.9% CAGR over the same horizon.
Global Laser-induced Breakdown Spectroscopy Market Trends and Insights
Drivers Impact Analysis*
| Driver | (~) % Impact on CAGR Forecast | Geographic Relevance | Impact Timeline |
|---|---|---|---|
| Real-time, in-situ elemental testing | +1.80% | Global; strong in North America & Asia-Pacific | Medium term (2-4 years) |
| Regulatory oversight on hazardous elements | +1.20% | North America & EU; expanding across Asia-Pacific | Short term (≤ 2 years) |
| Miniaturization and cost decline of hardware | +1.00% | Global; led by U.S., Germany, Japan | Long term (≥ 4 years) |
| Investments in critical minerals & batteries | +0.90% | North America, Australia, Chile | Medium term (2-4 years) |
| Circular-economy policies in metal recycling | +0.70% | EU first-mover; North America and China progressing | Long term (≥ 4 years) |
| Space and defense program validation | +0.60% | North America and EU; new projects in Asia-Pacific | Long term (≥ 4 years) |
| Source: Mordor Intelligence | |||
Growing Need for Real-Time, In-Situ Elemental Testing Across Industrial Value Chains
Instantaneous compositional feedback is now critical for process optimization, quality assurance, and resource estimation. A 65 g LIBS payload on NASA’s Mars 2020 rover shows that robust analysis can occur in extreme environments after an 87% weight reduction versus earlier designs.[1]NASA, “Tiny Pulsed Lasers Have Medical, Industrial, Military, Environmental Applications,” Spinoff, nasa.gov Steelmakers deploy similar handheld units on shop floors to curb off-spec alloy batches that once triggered re-melts. Mining companies gain weeks of cycle-time savings when downhole LIBS probes replace laboratory assay chains that relied on shipping core samples off-site. Scrap yards use the same portability to classify complex alloys in seconds, a shift that boosts margin as metal-price volatility magnifies the expense of mis-sorted feedstock. As value chains run leaner, the window for corrective action shrinks, creating a structural pull on the LIBS market for real-time analytics.
Intensifying Regulatory Oversight on Hazardous Elements in Environment, Food, and Consumer Goods
In 2024, the U.S. Environmental Protection Agency designated PFOA and PFOS as hazardous substances, triggering deeper site-monitoring mandates.[2]U.S. Environmental Protection Agency, “Designation of Perfluorooctanoic Acid (PFOA) and Perfluorooctanesulfonic Acid (PFOS) as CERCLA Hazardous Substances,” federalregister.gov European directives demand recovery of 25% of key raw materials from recycled waste streams by 2030. These edicts raise sample volumes and shorten reporting timetables, favoring field-deployable LIBS tools that can screen soils, plastics, or food powders without laboratory backlogs. Researchers demonstrated cadmium quantification from 70 ppm to 5,000 ppm in cocoa powder within minutes, underscoring how LIBS aligns with farm-to-fork traceability pressures. Faster compliance checks lower the risk of shipment holds and recalls, reinforcing adoption.
Miniaturization and Cost Decline of Solid-State Lasers and Spectrometers
Advances in photonic integration have yielded sub-5 nm resolution micro-spectrometers that fit on a fingertip. Parallel progress in GHz-repetition micro-lasers cuts pulse energy to 10–200 nJ while sustaining plasma excitation, a leap that pushes battery runtime and thermal safety of handheld analyzers forward. These hardware curves shift the LIBS market from capital equipment into a quasi-consumer electronics cost trajectory. Component cost down-ticks permit OEMs to embed sensors into welders, robots, and drones, so elemental data becomes an invisible yet pervasive input to industrial control systems. Low price points widen the LIBS market footprint in small and mid-size enterprises that lacked budgets for conventional lab gear.
Rising Investments in Critical Mineral Exploration and Battery Supply Chains
Clean-energy policy has ignited a global race for lithium, nickel, and rare-earth deposits. The U.S. Department of Energy alone earmarked USD 75 million for a Critical Minerals Supply Chain Research Facility in 2024, explicitly calling out analytical tech that accelerates resource evaluation. Field-portable LIBS units can detect lithium or carbon elements invisible to XRF—making them indispensable for core-shed screening and grade-control loops. Downstream battery factories leverage the same speed to spot metal cross-contamination before it degrades cell yield. Efficient exploration workflows lower finding costs, translating into faster ore-to-anode timelines that compound demand for in-situ spectroscopy.
Restraints Impact Analysis*
| Restraint | (~) % Impact on CAGR Forecast | Geographic Relevance | Impact Timeline |
|---|---|---|---|
| Established Dominance Of X-Ray Fluorescence And ICP Methods In Core Laboratories | -0.80% | Global, particularly in established analytical markets | Medium term (2-4 years) |
| Accuracy Variability Due To Matrix Effects And Calibration Complexity | -0.60% | Global, affecting all application segments | Short term (≤ 2 years) |
| Workplace Laser-Safety Regulations Increasing Certification Costs | -0.40% | North America & EU primarily | Long term (≥ 4 years) |
| Limited Availability Of Skilled Personnel For Advanced Spectroscopic Data Interpretation | -0.30% | Global, acute in emerging markets | Long term (≥ 4 years) |
| Source: Mordor Intelligence | |||
Established Dominance of XRF and ICP Methods in Core Laboratories
X-ray fluorescence and ICP-MS amassed decades of method validation and entrenched capital bases, so labs hesitate to overhaul workflows. Comparative trials reveal ICP-MS still holds lower detection limits for trace metals such as strontium or chromium.[3]Ilaria Guagliardi, “Comparative Evaluation of Inductively Coupled Plasma Mass Spectrometry and X-Ray Fluorescence Analysis Techniques,” Toxics, mdpi.com Regulatory auditors are comfortable with established protocols, generating compliance inertia. LIBS suppliers respond by positioning instruments as frontline screeners that triage samples before confirmatory ICP runs, thereby creating coexistence rather than direct substitution. Over time, combined workflows shorten turnaround time and reduce consumables, nudging labs toward broader LIBS adoption.
Accuracy Variability Due to Matrix Effects and Calibration Complexity
Heterogeneous matrices alter plasma temperature and emission intensity, skewing quantitative results. Tackling the problem calls for extensive reference libraries and multivariate chemometrics. Integrating Raman data with LIBS spectra lifted mineral-classification accuracy to 98.4% in a 2024 machine-learning study, proving software can offset physics-based variability. Plasma-grating-induced breakdown spectroscopy amplifies signal threefold relative to traditional setups, further tightening precision. As automation and AI mature, calibration overheads fall, but the near-term drag on adoption persists, especially for operators lacking data-science skills.
*Our forecasts treat driver/restraint impacts as directional, not additive. The impact forecasts reflect baseline growth, mix effects, and variable interactions.
Segment Analysis
By Product Type: Portability Drives Market Evolution
Handheld and portable analyzers controlled 46.5% of 2024 revenue as users prioritized mobility and instant decision-making, a dominance that underscores how portability shapes the modern LIBS market size for front-line tasks. Thermo Fisher Scientific’s Niton Apollo exemplifies the category by offering Wi-Fi-enabled carbon equivalency analysis inside a 2 kg, IP54-rated shell. Stand-off and remote systems are projected to deliver the highest 6.2% CAGR, as industries ranging from nuclear decommissioning to deep-sea mining adopt non-contact inspection to balance worker safety with analytical reach.
Benchtop instruments continue to serve labs that need greater spectral resolution, while OEM modules let machine builders weave LIBS into robotics and manufacturing cells. The LIBS industry’s shift toward integrated LIBS-Raman devices hints at a post-instrument era where multi-modal sensors embed within production lines. Double-pulse underwater variants have analyzed minerals at 6,000 m depth, eliminating core-sample retrieval delays. Whether strapped to Mars rovers or recycling robots, versatility cements the LIBS market’s expansion path.


By End-User Industry: Mining Leadership Faces Environmental Challenge
Metals and mining accounted for 29.3% of 2024 demand because LIBS isolates light elements like lithium or carbon essential to alloy grades and battery chemistries—elements that traditional XRF misses. However, environmental and agriculture monitoring will register the fastest 5.4% CAGR as governments tighten limits on contaminants in soil, water, and crops.
Industrial manufacturing and scrap recycling ride EU circular-economy targets by integrating LIBS-guided robots that push sorting accuracy above 90%. Research institutions spearhead novel uses, such as nutrient tracking in hydroponics, where real-time readings aid precision fertilization. Aerospace and defense validate robustness in extreme conditions, transferring credibility to terrestrial heavy-duty environments. As policy pressure escalates and new applications surface, demand-based diversity will insulate the LIBS market from commodity cycles.
Geography Analysis
North America commanded 34.7% of 2024 revenue on the back of federal funding, thriving aerospace-defense ecosystems, and a resilient mining sector. The Department of Energy’s loan-guarantee program funnels capital toward critical-mineral processing, giving domestic suppliers an incentive to adopt LIBS for real-time impurity detection. NASA’s SuperCam success maintains technology prestige, and Canada’s nickel-rich Sudbury Basin mines increasingly deploy LIBS probes to guide selective extraction. Mexico’s automotive supply chain follows suit, adding portable units to assure alloy conformity.
Asia-Pacific represents the fastest 5.9% CAGR trajectory through 2030, led by China’s rare-earth monopoly and battery gigafactories that need rapid elemental balance checks. Beijing’s scrap-steel tonnage is forecast to triple by 2050, spotlighting LIBS-enabled sorting as a linchpin in sustainable steelmaking. Japan and South Korea apply the technology to semiconductor precursor purity, while India’s mining surge adapts handheld units for grade control. Australia leverages field-portable LIBS to speed lithium brine characterization across its emerging spodumene projects.
Europe shows balanced uptake driven by tight environmental statutes demanding rapid in-situ verification of WEEE and scrap streams. Germany integrates LIBS into automated production lines, and Norway pilots offshore LIBS for subsea mineral scouting. EU grants targeting >90% critical-raw-material recovery fuel commercialization of LIBS-AI-robotics platforms. Secondary markets in the Middle East, Africa, and South America gradually scale as exploration and environmental monitoring budgets expand, rounding out a truly global LIBS market.

Competitive Landscape
The LIBS market is moderately fragmented, with a cohort of diversified spectroscopy giants and specialist innovators jockeying for share. Thermo Fisher Scientific and Rigaku Corporation lean on broad channel reach to ship handhelds and benchtops, whereas SciAps zeroes in on sub-kilogram handhelds targeting alloy sorting niches. Applied Spectra differentiates through software-rich mapping systems that blend elemental imaging with automated calibration, lowering the data-science barrier.
Strategic moves pivot toward vertical integration and AI augmentation. Fraunhofer ILT’s partnership portfolio aims to marry LIBS with robotics for battery-recycling lines capable of >90% material recovery. Thermo Fisher enriched its cloud stack to push firmware and calibration updates wirelessly, reducing service truck rolls. Start-ups exploit speech-level user interfaces and on-board AI that auto-flag outliers, paring training times. With miniaturization making sensors ubiquitous, control of data analytics and application-specific know-how is emerging as the decisive battlefield.
Large players keep margins by bundling LIBS with complementary techniques—XRF, Raman, or mass spectrometry—offering end-users a single vendor for hybrid workflows. Smaller firms seek regional distributors and OEM relationships to bypass direct sales overhead. Mergers and technology licensing deals are likely as incumbents shop for AI expertise and next-generation optoelectronics to stay ahead of price erosion.
Laser-induced Breakdown Spectroscopy Industry Leaders
Thermo Fisher Scientific
Hitachi High-Tech
Rigaku
SciAps
Applied Spectra
- *Disclaimer: Major Players sorted in no particular order

Recent Industry Developments
- March 2025: NASA’s Perseverance rover surpassed core drilling milestones using the SuperCam LIBS instrument, confirming rugged performance in Mars’ harsh environment and reinforcing terrestrial confidence in remote field deployments.
- February 2025: Researchers unveiled ultra-low-energy LIBS systems firing at 2.8 GHz with 10–200 nJ pulses, a breakthrough that slashes power draw for wearable analyzers.
- January 2025: Applied Spectra upgraded its J200 series with ClarityNeXt software, delivering faster pre-analysis visualization for forensic, geochemical, and battery-component workflows.


Global Laser-induced Breakdown Spectroscopy Market Report Scope
| Benchtop Systems |
| Handheld / Portable Analyzers |
| Stand-off / Remote LIBS |
| Integrated LIBS-Raman Systems |
| OEM / Module Components |
| Metals & Mining |
| Industrial Manufacturing & Scrap-Recycling |
| Environmental & Agriculture Monitoring |
| Research & Academia |
| Others |
| North America | United States |
| Canada | |
| Mexico | |
| Europe | Germany |
| United Kingdom | |
| France | |
| Italy | |
| Spain | |
| Rest of Europe | |
| Asia Pacific | China |
| Japan | |
| India | |
| South Korea | |
| Australia | |
| Rest of Asia Pacific | |
| Middle East & Africa | GCC |
| South Africa | |
| Rest of Middle East & Africa | |
| South America | Brazil |
| Argentina | |
| Rest of South America |
| By Product Type | Benchtop Systems | |
| Handheld / Portable Analyzers | ||
| Stand-off / Remote LIBS | ||
| Integrated LIBS-Raman Systems | ||
| OEM / Module Components | ||
| By End-user Industry | Metals & Mining | |
| Industrial Manufacturing & Scrap-Recycling | ||
| Environmental & Agriculture Monitoring | ||
| Research & Academia | ||
| Others | ||
| By Geography | North America | United States |
| Canada | ||
| Mexico | ||
| Europe | Germany | |
| United Kingdom | ||
| France | ||
| Italy | ||
| Spain | ||
| Rest of Europe | ||
| Asia Pacific | China | |
| Japan | ||
| India | ||
| South Korea | ||
| Australia | ||
| Rest of Asia Pacific | ||
| Middle East & Africa | GCC | |
| South Africa | ||
| Rest of Middle East & Africa | ||
| South America | Brazil | |
| Argentina | ||
| Rest of South America | ||


Key Questions Answered in the Report
What is the current value of the LIBS market and its expected growth by 2030?
It is USD 306.8 million in 2025 and projected to reach USD 424.1 million by 2030 at a 6.20% CAGR.
Which product category leads sales in LIBS tools?
Handheld and portable analyzers command 46.5% of 2024 revenue.
Why are stand-off LIBS systems gaining traction?
They offer non-contact analysis for hazardous or hard-to-reach targets and are forecast to grow at 6.2% CAGR to 2030.
Which end-user segment is expanding fastest?
Environmental and agriculture monitoring applications will advance at a 5.4% CAGR through 2030.
Which region is expected to record the highest growth rate?
Asia-Pacific will post the fastest 5.9% CAGR thanks to battery and rare-earth supply-chain expansion.
Page last updated on:


