UV Spectroscopy Market Size and Share
Market Overview
| Study Period | 2020 - 2031 |
|---|---|
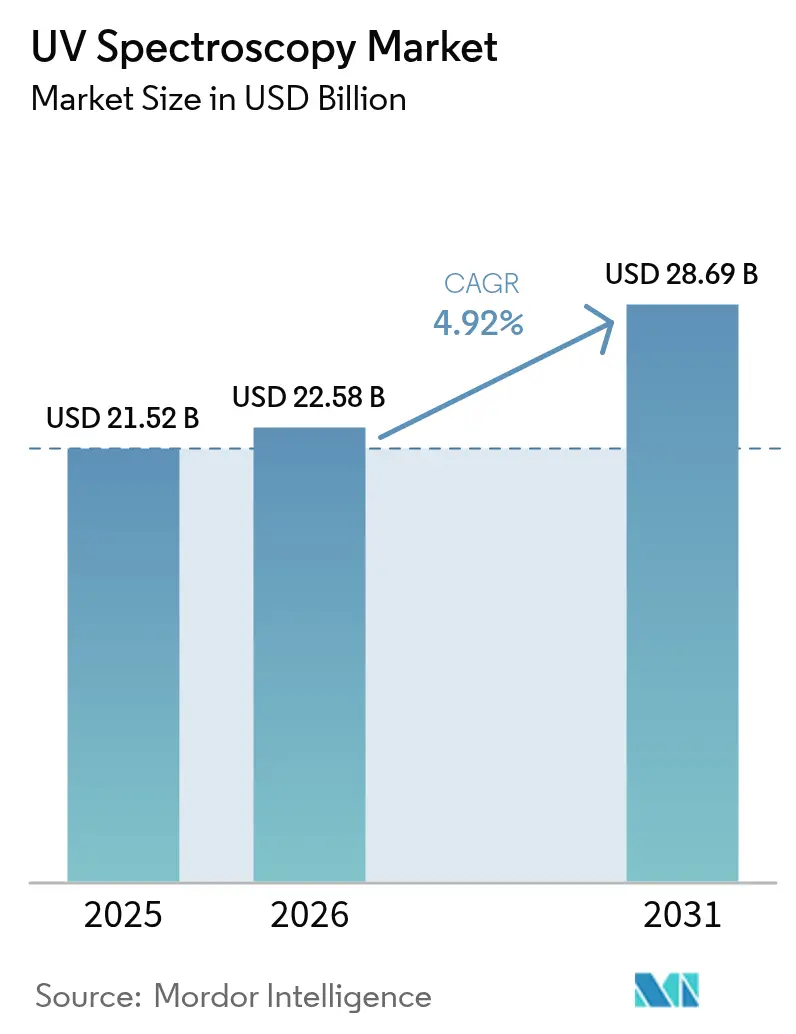
| Market Size (2026) | USD 22.58 Billion |
| Market Size (2031) | USD 28.69 Billion |
| Growth Rate (2026 - 2031) | 4.92% CAGR |
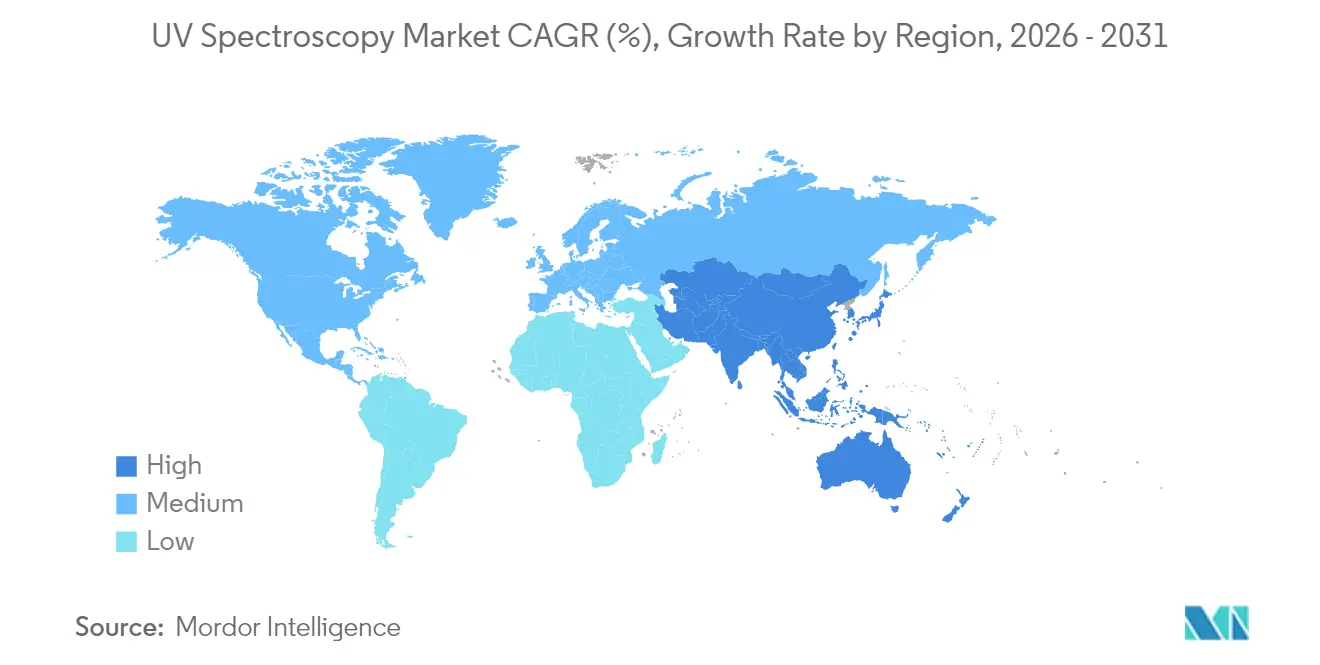
| Fastest Growing Market | Asia-Pacific |
| Largest Market | North America |
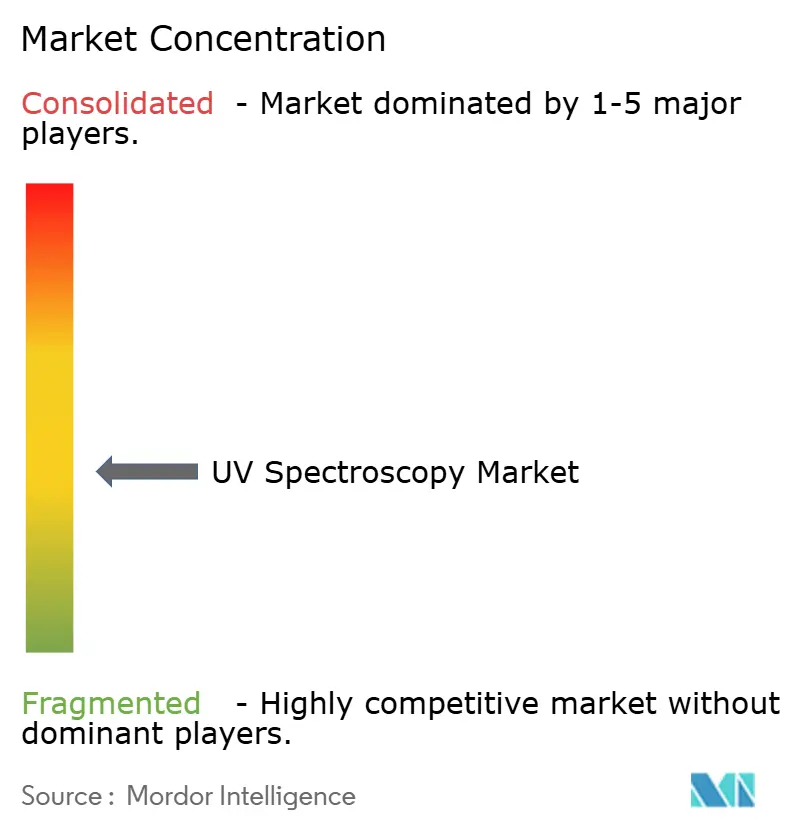
| Market Concentration | Medium |
Major Players
*Disclaimer: Major Players sorted in no particular order Image © Mordor Intelligence. Reuse requires attribution under CC BY 4.0. |
|
UV Spectroscopy Market Analysis by Mordor Intelligence
UV spectroscopy market size in 2026 is estimated at USD 22.58 billion, growing from 2025 value of USD 21.52 billion with 2031 projections showing USD 28.69 billion, growing at 4.92% CAGR over 2026-2031. Sturdy demand stems from continuous-manufacturing adoption in the pharmaceutical sector, where inline UV sensors enable real-time tracking of critical quality attributes, cutting batch failures and downtime. Expanded biologics pipelines, tighter FDA data-integrity rules issued in 2024, and rapid growth of point-of-care (POC) testing are widening the addressable base for compliant instruments. Competitive intensity is moderate: multinationals focus on strategic acquisitions that extend capabilities in oligonucleotide synthesis and bioprocess filtration, while regional suppliers emphasize cost-advantaged manufacturing hubs in Asia-Pacific. Strong capital investment in analytical infrastructure, combined with advances in AI-enhanced spectral analytics, underpins steady volume growth across end-user segments.
Key Report Takeaways
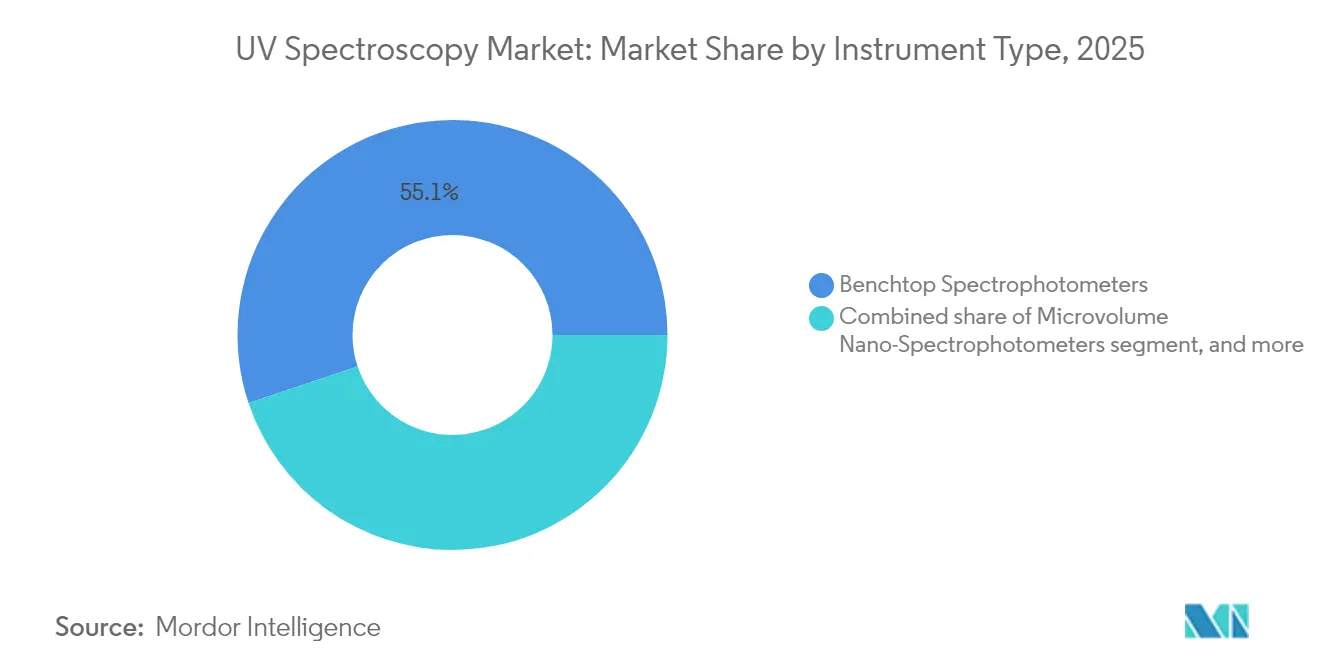
- By instrument type, benchtop spectrophotometers held 55.12% of the UV spectroscopy market share in 2025; portable/hand-held devices are projected to expand at a 7.12% CAGR through 2031.
- By technology, dual-beam optics continued to hold 41.10% revenue share in 2025. Diode-array configurations nonetheless logged a 7.33% CAGR and are positioned to outpace other designs through 2031.
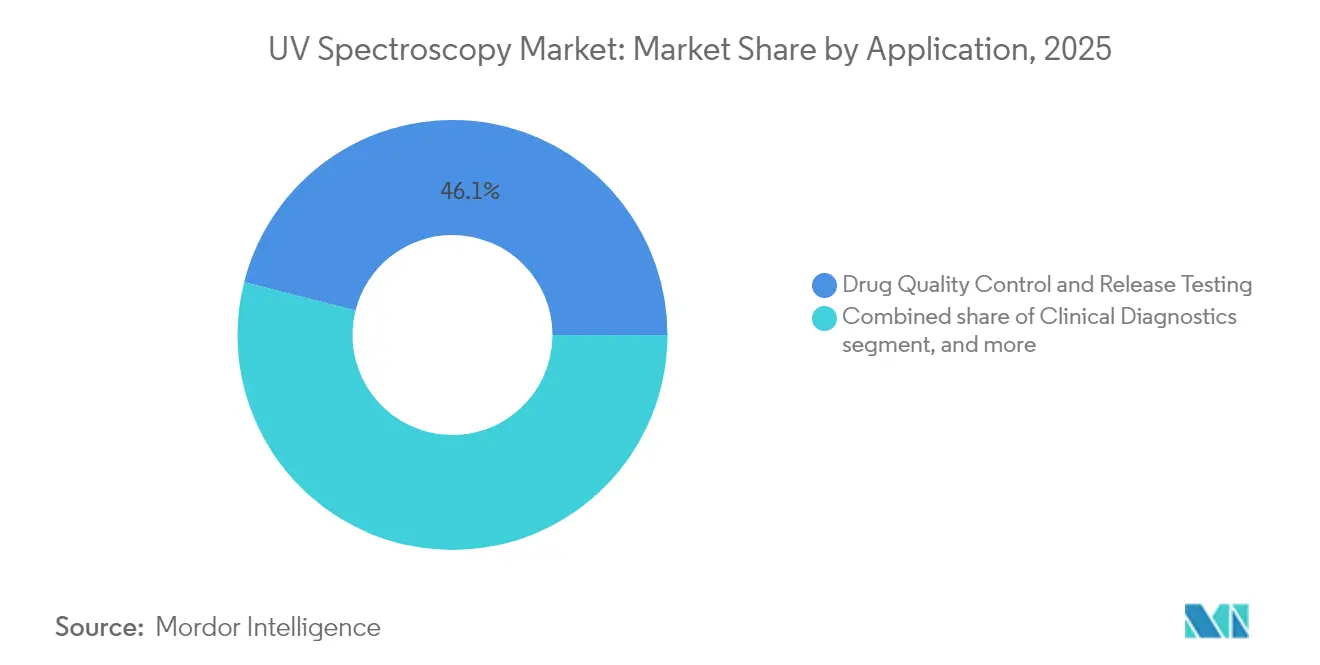
- By application, drug quality control and release testing commanded 46.05% of the UV spectroscopy market size in 2025, whereas bioprocess monitoring and process analytical technology are forecast to grow at 8.11% CAGR to 2031.
- By end user, pharmaceutical and biotech companies accounted for 48.10% of the UV spectroscopy market size in 2025, while academic medical centers are poised to rise at an 7.85% CAGR to 2031.
- By geography, North America led with 42.00% of the UV spectroscopy market share in 2025, yet Asia-Pacific is expected to post the fastest regional CAGR of 6.18% through 2031.
Note: Market size and forecast figures in this report are generated using Mordor Intelligence’s proprietary estimation framework, updated with the latest available data and insights as of 2026.
Global UV Spectroscopy Market Trends and Insights
Driver Impact Analysis*
| Driver | % Impact on CAGR Forecast | Geographic Relevance | Impact Timeline |
|---|---|---|---|
| Escalating biologics quality‐assurance demand | +1.2% | North America & European Union, expanding globally | Medium term (2-4 years) |
| Expanding point-of-care diagnostic testing | +0.9% | Core in Asia-Pacific, spill-over to Middle East & Africa | Short term (≤ 2 years) |
| Regulatory focus on pharma data integrity | +0.8% | North America & EU, widening influence in Asia-Pacific | Long term (≥ 4 years) |
| Growth in clinical research and CRO outsourcing | +0.7% | North America, India, China | Medium term (2-4 years) |
| UV microvolume nano-spectroscopy integration in genomics | +0.6% | Global, with early adoption in genomics hubs (US, EU, APAC) | Short-to-medium term (≤ 4 years) |
| Continuous manufacturing with in-line PAT sensors | +0.5% | North America & EU, gaining traction in Asia-Pacific | Long term (≥ 4 years) |
| Source: Mordor Intelligence | |||
Escalating Demand for Biologics Quality Assurance
Biologics pipelines now dominate late-stage drug development, pushing the UV spectroscopy market toward higher-sensitivity protein analytics. Variable-pathlength instruments such as the Solo VPE allow direct measurement of antibody concentrations up to 300 mg/mL without sample dilution, cutting assay time from hours to minutes. Inline UV monitoring of Protein A chromatography improves host-cell-protein clearance and yields, aligning with regulators’ Quality by Design expectations for real-time control[1]Food and Drug Administration, “Quality Considerations for Biopharmaceuticals,” fda.gov. Vendors respond by integrating chemometric models that deliver concentration and purity outputs in a single scan, reducing operator workload and improving batch release speeds. As biomanufacturers scale continuous-processing platforms, demand for rugged, cleanroom-compatible UV probes should continue to rise, lifting average selling prices within the UV spectroscopy market.
Expanding Point-of-Care Diagnostic Testing Needs
Demographic shifts and the quest for faster clinical decisions are accelerating adoption of compact UV devices in decentralized settings. Microvolume nano-spectrophotometers quantify urinary albumin and creatinine at detection limits suitable for early diabetic kidney disease screening, a test traditionally confined to central laboratories. Start-ups have paired UV optics with AI algorithms to deliver bacteriological contamination results for cell therapies in under 30 minutes, replacing the 14-day sterility window typical of membrane filtration. Governments in Asia-Pacific back POC deployment to relieve hospital congestion, and instrument makers are introducing rechargeable, Bluetooth-enabled units that sync with electronic health-record platforms. This convergence between optics, microfluidics, and machine learning enlarges the UV spectroscopy market beyond classic pharmaceutical quality control.
Regulatory Emphasis on Pharma Data Integrity
The FDA’s Q2(R2) and Q14 guidances force firms to demonstrate method robustness, traceability, and electronic-record controls, directly influencing instrument-purchase priorities. Europe’s Pharmacopoeia 10th Edition extends UV provisions to include HPLC detectors, prompting laboratories to harmonize qualification protocols. Automated verification modules such as Mettler-Toledo’s CertiRef perform wavelength, photometric, and stray-light checks using certified reference materials, enabling one-click audit trails. Enforcement actions—such as the 2025 FDA warning letter to China Pharmaceutical University’s lab for incomplete data records—highlight the cost of non-compliance. Consequently, procurement teams increasingly select platforms with embedded compliance software, sustaining premium pricing power within the UV spectroscopy market.
Growth in Clinical Research and CRO Outsourcing
Pharma companies continue to outsource analytical and early-stage development tasks to contract research organizations (CROs) to focus resources on core discovery. CROs must therefore secure state-of-the-art UV systems that support high-throughput screening, forced degradation studies, and regulatory-grade documentation. Shimadzu’s analytical-instrument revenue posted an 8% CAGR from 2018–2023, with roughly one-fifth linked to outsourced pharmaceutical work—evidence of this structural shift. North American CRO hubs remain the epicenter, yet major Asian facilities are expanding rapidly to service local generic-drug producers, increasing unit demand for mid-priced dual-beam instruments. Growing biologics pipelines further elevate UV throughput requirements, underscoring outsourcing’s multi-year contribution to the UV spectroscopy market.
Restraints Impact Analysis*
| Restraints Impact Analysis | (~) % Impact on CAGR Forecast | Geographic Relevance | Impact Timeline |
|---|---|---|---|
| High capital expenditure for GMP-compliant instruments | -0.6% | Global, strongest drag in emerging markets | Long term (≥ 4 years) |
| Limited skilled workforce in clinical spectroscopy | -0.4% | Primarily Asia-Pacific and Middle East & Africa | Medium term (2-4 years) |
| Stringent validation and calibration protocols | -0.3% | Global, pronounced in regulated regions | Long term (≥ 4 years) |
| Competition from label-free optical biosensors | -0.2% | North America & EU, emerging in Asia-Pacific | Medium term (2-4 years) |
| Source: Mordor Intelligence | |||
High Capital Expenditure for GMP-Compliant Instruments
Full GMP qualification packages, 21 CFR Part 11 software, and USP <857> traceability requirements elevate upfront costs for UV platforms. A benchtop system bundled with wavelength validation kits can exceed USD 85,000, a hurdle for small manufacturers and public-sector laboratories. Even refurbished units offered under certified pre-owned programs incur added spend on re-qualification and documentation, often matching the purchase price. Emerging-market firms face higher import duties and scarce local validation expertise, extending payback periods. Unless financing tools or leasing models proliferate, these economics will curb unit penetration in the most price-sensitive tiers of the UV spectroscopy market.
Limited Skilled Workforce in Clinical Spectroscopy
Modern UV platforms integrate chemometrics, multivariate statistics, and cloud connectivity, yet academic curricula lag in teaching these hybrid skills. QC labs in India and parts of Southeast Asia report operator turnover above 20%, increasing data-integrity risks during method transfer and routine testing[2]World Health Organization, “Global Laboratory Workforce Challenges,” who.int. Training gaps extend to software validation, where staff must document user-access controls, audit trails, and electronic signatures. Regional governments have begun funding technician apprenticeships, but progress remains uneven. Persistent skills shortages may compel some facilities to favor turnkey service contracts over internal ownership, softening equipment demand in specific segments of the UV spectroscopy market.
*Our forecasts treat driver/restraint impacts as directional, not additive. The impact forecasts reflect baseline growth, mix effects, and variable interactions.
Segment Analysis
By Instrument Type: Portability Drives Innovation
Benchtop units dominated sales with 55.12% of the UV spectroscopy market size in 2025 thanks to their superior photometric accuracy, robust qualification kits, and broad accessory ecosystems. Large pharma plants prefer standardized dual-beam platforms because they harmonize method transfer across multiple sites and align with FDA method-verification requirements. Portable/hand-held devices, however, posted the fastest unit growth at a 7.12% CAGR, fueled by POC diagnostics, on-site water testing, and raw-material verification in continuous-manufacturing suites. Vendors have improved optical layouts using micro-electromechanical mirrors and broadband frequency combs, achieving resolving power of up to 10 million—performance once limited to flagship benchtop instruments.
Competitive dynamics favor companies that combine miniaturized optics with rugged casings able to withstand cleanroom disinfectants. Cloud-ready firmware that streams encrypted spectra to centralized servers reduces data-aggregation time, a feature gaining regulatory favor. As decentralized healthcare models mature, portable formats will become mainstream, although benchtop units will keep commanding the lion’s share of the UV spectroscopy market in highly regulated batch-release environments.


By Technology: Diode-Array Systems Lead Innovation
Dual-beam optics continued to hold 41.10% revenue share in 2025, admired for baseline stability during long analytical runs typical of stability studies. Diode-array configurations nonetheless logged a 7.33% CAGR and are positioned to outpace other designs through 2031. Their ability to capture entire spectra in milliseconds supports peak-purity checks and forced-degradation profiling, activities integral to ICH Q1 guidelines. Single-beam instruments survive in cost-sensitive labs, while deep-UV variants, operating below 200 nm, meet rising demand for high-extinction protein detection in gene-therapy research.
Instrument makers invest heavily in stray-light suppression, using holographic gratings that retain linearity even at extremely high absorbance values. Software advances embed spectral-library matching powered by machine learning, reducing manual data review by up to 40%. The blend of hardware precision and algorithmic analytics strengthens differentiation, sustaining premium price bands in this slice of the UV spectroscopy market.
By Application: Bioprocess Monitoring Accelerates Growth
Drug quality control and release testing captured 46.05% of the UV spectroscopy market share in 2025, reflecting GMP mandates for every finished batch. Yet bioprocess monitoring now records the fastest expansion at 8.11% CAGR, mirroring the biopharmaceutical sector’s transition to continuous operation. Inline flow-cell probes track UV absorbance in Protein A capture and viral-inactivation steps, giving manufacturers real-time levers to adjust feed streams and improve yields. Advances in fiber-optic sensor chemistry resist fouling, pushing maintenance intervals beyond six months even under harsh CIP regimes.
Beyond proteins, UV imaging techniques quantify blend homogeneity in tablet granulation, a shift toward non-destructive, at-line assays that replace traditional large-sample HPLC tests. In diagnostics, disposable microfluidic cartridges integrate UV measurement with colorimetric assays, compressing sample-to-result timelines. These varied use cases expand total instrument volumes and enhance recurring-reagent revenues, cementing application diversity as a stabilizing force for the UV spectroscopy market.
By End User: Academic Centers Drive Expansion
Pharmaceutical and biotech firms accounted for 48.10% of 2025 demand, a reflection of their central role in global drug supply chains and strict compliance frameworks. Continuous pipeline replenishment and capacity additions at contract development and manufacturing organizations (CDMOs) maintain baseline equipment replacement cycles of five to seven years. Academic medical centers stand out with an 7.85% CAGR, supported by federal grant programs aimed at translational medicine and personalized therapy initiatives. These institutions increasingly require GMP-like data environments to support clinical-trial partnerships, elevating specifications for laboratory-grade UV instruments.
Hospitals broaden adoption for renal and neonatal bilirubin testing, while environmental-health agencies use UV setups to monitor emerging contaminants such as PFAS in drinking water. The blended demand profile cushions suppliers against downturns in any single customer category and keeps the UV spectroscopy market on a firm growth trajectory despite occasional macroeconomic headwinds.
Geography Analysis
North America maintained the largest contribution to global revenue with 42.00% in 2025 due to robust biopharma infrastructure, stringent FDA oversight, and local manufacturing bases for major analytical brands. Government stimulus—such as the CHIPS and Science Act—further encourages domestic production of precision optics, reinforcing supply-chain resilience. Europe follows closely, propelled by harmonized EMA regulations and an expanding biologics contract-manufacturing network.
Asia-Pacific, however, delivered the strongest growth momentum at a 6.18% CAGR and is expected to account for over one-third of incremental instrument demand by 2030. India’s Production-Linked Incentive scheme and China’s multi-billion-dollar provincial grants for advanced therapeutics are accelerating greenfield plant construction. Shimadzu’s decision to build a Karnataka factory capable of producing 10,000 UV-visible units annually from 2027 exemplifies the localization trend. Japan and South Korea sustain high unit value through continued innovation in gene and cell-therapy pipelines, while Southeast Asian states prioritize POC deployment in rural clinics.
Middle East & Africa and South America remain early-stage but show rising interest as local regulators strengthen pharmacovigilance frameworks. Brazilian ANVISA guidelines now reference USP <857> performance checks, prompting replacement of aging single-beam models. Gulf Cooperation Council countries invest in biologics fill-finish facilities within free-trade zones, driving initial orders for integrated UV monitoring skids. Collectively, these dynamics ensure the geographic spread of the UV spectroscopy market will broaden over the next five years.

Competitive Landscape
Agilent Technologies, Thermo Fisher Scientific, and Shimadzu Corporation anchor the upper tier of suppliers, each backed by multi-billion-dollar instrument portfolios and global service footprints. Agilent’s USD 925 million acquisition of BioVectra in July 2024 strengthens its position in oligonucleotide synthesis, a niche with stringent UV absorbance specifications for purity and concentration. Thermo Fisher’s USD 4.1 billion purchase of Solventum’s Purification & Filtration unit, announced February 2025, extends downstream processing assets and creates cross-selling pathways for UV detectors embedded in chromatography skids.
Shimadzu’s upcoming Karnataka facility will reduce lead times and offer cost-optimized models for India’s burgeoning generics sector. Mid-cap vendors pursue specialization: Specac acquired Harrick’s product lines to broaden accessory kits for diffuse-reflectance measurements, while Metrohm partners with cloud-analytics firms to deliver subscription-based data platforms. Digitalization is a focal point for differentiation; leaders deploy AI-driven predictive maintenance that schedules lamp replacement and optics cleaning before performance drifts exceed USP tolerance.
Emerging Chinese producers target entry-level segments with competitively priced single-beam units, but often struggle to satisfy full GMP documentation demands, keeping barriers to entry intact in regulated markets. Overall, rivalry remains moderate because certification hurdles curb commoditization. The top five players control an estimated 35-40% of global revenue, indicating a balanced but competitive UV spectroscopy market environment.
UV Spectroscopy Industry Leaders
-
Agilent Technologies, Inc.
-
Thermo Fisher Scientific, Inc.
-
Shimadzu Corporation
-
PerkinElmer Inc.
-
Hitachi High-Tech Corporation
- *Disclaimer: Major Players sorted in no particular order

Recent Industry Developments
- February 2025: Thermo Fisher Scientific agreed to acquire Solventum’s Purification & Filtration business for about USD 4.1 billion, enhancing bioproduction offerings tied to UV-based protein analytics.
- January 2025: Shimadzu Corporation unveiled plans for a new analytical-instrument factory in Karnataka, India, slated to begin operations in 2027 and manufacture UV-visible spectrophotometers alongside mass spectrometers.
- July 2024: Agilent Technologies completed the USD 925 million purchase of BioVectra, broadening oligonucleotide production services that rely heavily on UV quantification.
- April 2024: Thermo Fisher committed USD 2 billion to U.S. capacity and R&D, earmarking USD 500 million for innovation in analytical instruments, including next-generation UV platforms.
- March 2024: The FDA issued final Q2(R2) and Q14 guidances, elevating validation requirements for all analytical procedures, explicitly covering UV spectroscopy.
- October 2024: EquipNet began reselling Agilent-certified pre-owned UV-visible spectrophotometers, providing OEM-backed warranties to budget-constrained buyers.


Global UV Spectroscopy Market Report Scope
As per the scope of this report, Ultraviolet-visible spectrometry refers to absorption spectroscopy that utilizes light in the visible spectral ranges, thereby measuring the absorption of ultraviolet radiation due to interaction with a sample. The UV spectroscopy market is segmented by Instrument (Single beam, Double beam, Array-Based systems) By Application(Academic, Industrial and Environmental Studies), By End User (Pharmaceutical and biotechnology industries, academic and research institutions), Geography (North America, Europe, Asia-Pacific, Middle East, and Africa, and South America). The market report also covers the estimated market sizes and trends of 17 countries across major global regions. The report offers the value (in USD million) for the above segments.
| Benchtop Spectrophotometers |
| Microvolume Nano-Spectrophotometers |
| Portable / Hand-Held Devices |
| In-Line Process Sensors |
| Single-Beam |
| Dual-Beam |
| Diode-Array |
| Deep-UV Systems |
| Drug Quality Control & Release Testing |
| Clinical Diagnostics (Blood & Urine Analysis) |
| Genomics & Proteomics Quantification |
| Bioprocess Monitoring & PAT |
| Academic & Translational Research |
| Pharmaceutical & Biotech Companies |
| Contract Research & Manufacturing Organizations (CROs/CDMOs) |
| Hospitals & Diagnostic Laboratories |
| Academic Medical Centers |
| Public Health & Regulatory Agencies |
| North America | United States |
| Canada | |
| Mexico | |
| Europe | Germany |
| United Kingdom | |
| France | |
| Italy | |
| Spain | |
| Rest of Europe | |
| Asia-Pacific | China |
| Japan | |
| India | |
| Australia | |
| South Korea | |
| Rest of Asia-Pacific | |
| Middle East & Africa | GCC |
| South Africa | |
| Rest of Middle East & Africa | |
| South America | Brazil |
| Argentina | |
| Rest of South America |
| By Instrument Type | Benchtop Spectrophotometers | |
| Microvolume Nano-Spectrophotometers | ||
| Portable / Hand-Held Devices | ||
| In-Line Process Sensors | ||
| By Technology | Single-Beam | |
| Dual-Beam | ||
| Diode-Array | ||
| Deep-UV Systems | ||
| By Application | Drug Quality Control & Release Testing | |
| Clinical Diagnostics (Blood & Urine Analysis) | ||
| Genomics & Proteomics Quantification | ||
| Bioprocess Monitoring & PAT | ||
| Academic & Translational Research | ||
| By End User | Pharmaceutical & Biotech Companies | |
| Contract Research & Manufacturing Organizations (CROs/CDMOs) | ||
| Hospitals & Diagnostic Laboratories | ||
| Academic Medical Centers | ||
| Public Health & Regulatory Agencies | ||
| Geography | North America | United States |
| Canada | ||
| Mexico | ||
| Europe | Germany | |
| United Kingdom | ||
| France | ||
| Italy | ||
| Spain | ||
| Rest of Europe | ||
| Asia-Pacific | China | |
| Japan | ||
| India | ||
| Australia | ||
| South Korea | ||
| Rest of Asia-Pacific | ||
| Middle East & Africa | GCC | |
| South Africa | ||
| Rest of Middle East & Africa | ||
| South America | Brazil | |
| Argentina | ||
| Rest of South America | ||


Key Questions Answered in the Report
What is the forecast value of the UV spectroscopy market in 2031?
The UV spectroscopy market is projected to reach USD 28.69 billion by 2031, growing at a 4.92% CAGR from 2026.
Which instrument category leads current sales?
Benchtop spectrophotometers dominate, carrying 55.12% of 2025 revenue due to their regulatory compliance features and high photometric precision.
Why is Asia-Pacific considered the fastest-growing region?
Government incentives for pharmaceutical manufacturing, new biologics capacity, and localization moves by global suppliers are driving a 6.18% regional CAGR through 2031.
How do new FDA guidelines influence purchasing decisions?
The Q2(R2) and Q14 guidances elevate data-integrity and method-validation requirements, prompting labs to favor instruments with automated performance verification and 21 CFR Part 11 software.
What technology trend is reshaping portable UV systems?
Integration of AI algorithms and broadband frequency-comb optics is raising resolution while shrinking form factors, enabling reliable point-of-care diagnostics.
Which user segment is expanding the fastest?
Academic medical centers are growing at an 7.85% CAGR as research grants and translational medicine projects require GMP-grade analytical capabilities.
Page last updated on:


