
Global Onychomycosis Treatment Market Size and Share
Market Overview
| Study Period | 2020 - 2031 |
|---|---|
| Market Size (2026) | USD 3.66 Billion |
| Market Size (2031) | USD 4.49 Billion |
| Growth Rate (2026 - 2031) | 4.19 % |
| Fastest Growing Market | Asia-Pacific |
| Largest Market | North America |
| Market Concentration | Medium |
Major Players *Disclaimer: Major Players sorted in no particular order Image © Mordor Intelligence. Reuse requires attribution under CC BY 4.0. | |
Global Onychomycosis Treatment Market Analysis by Mordor Intelligence
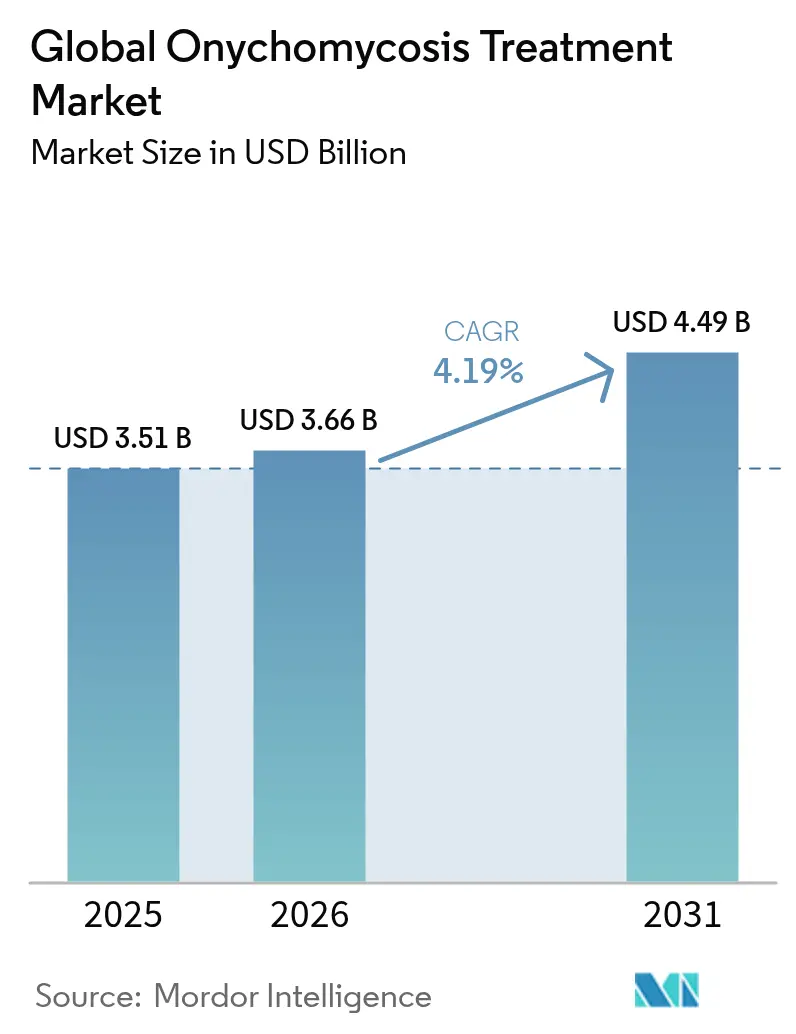
The onychomycosis treatment market size was valued at USD 3.51 billion in 2025 and estimated to grow from USD 3.66 billion in 2026 to reach USD 4.49 billion by 2031, at a CAGR of 4.19% during the forecast period (2026-2031). Medication-based products continue to dominate revenue, yet device-based modalities are steadily gaining traction as clinicians and patients seek alternatives that avoid systemic adverse events. Diabetes prevalence, population aging, and heightened consumer focus on foot aesthetics sustain underlying demand, while fast-track regulatory incentives encourage research into next-generation antifungals capable of overcoming emerging resistance. Fierce competition among established pharmaceutical brands, specialty dermatology firms, and innovative device makers keeps pricing disciplined and accelerates incremental improvements in treatment convenience, cure speed, and tolerability. Broader e-pharmacy access, particularly in Asia-Pacific, and artificial-intelligence-enhanced diagnostics further widen the addressable patient pool by enabling earlier, guideline-consistent intervention.
Key Report Takeaways
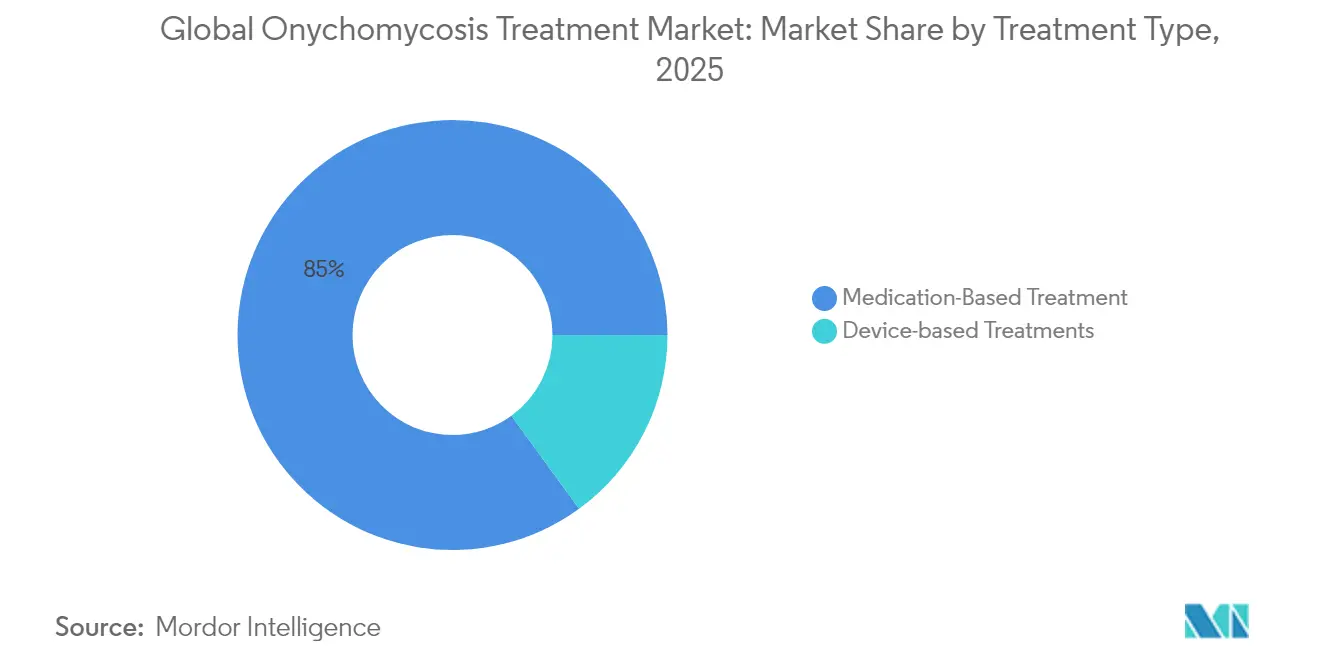
- By treatment type, medication-based products held 85.02% of the onychomycosis treatment market share in 2025, while device-based modalities are forecast to grow at a 5.08% CAGR through 2031.
- By pathogen type, dermatophytes maintained 68.62% share of the onychomycosis treatment market size in 2025; non-dermatophyte molds are advancing at a 5.92% CAGR as molecular diagnostics reveal previously under-detected infections.
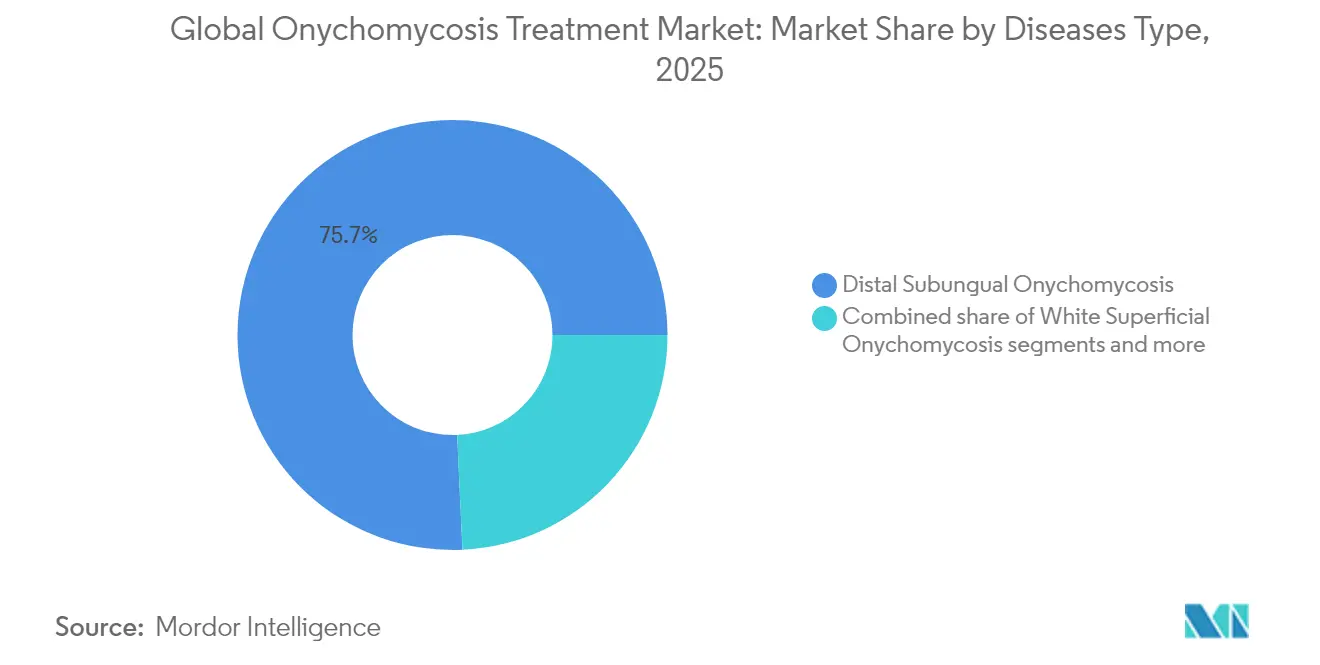
- By disease type, distal subungual presentations accounted for 75.74% of the onychomycosis treatment market size in 2025, whereas proximal subungual cases are expanding at a 6.53% CAGR owing to better clinical recognition in immunocompromised populations.
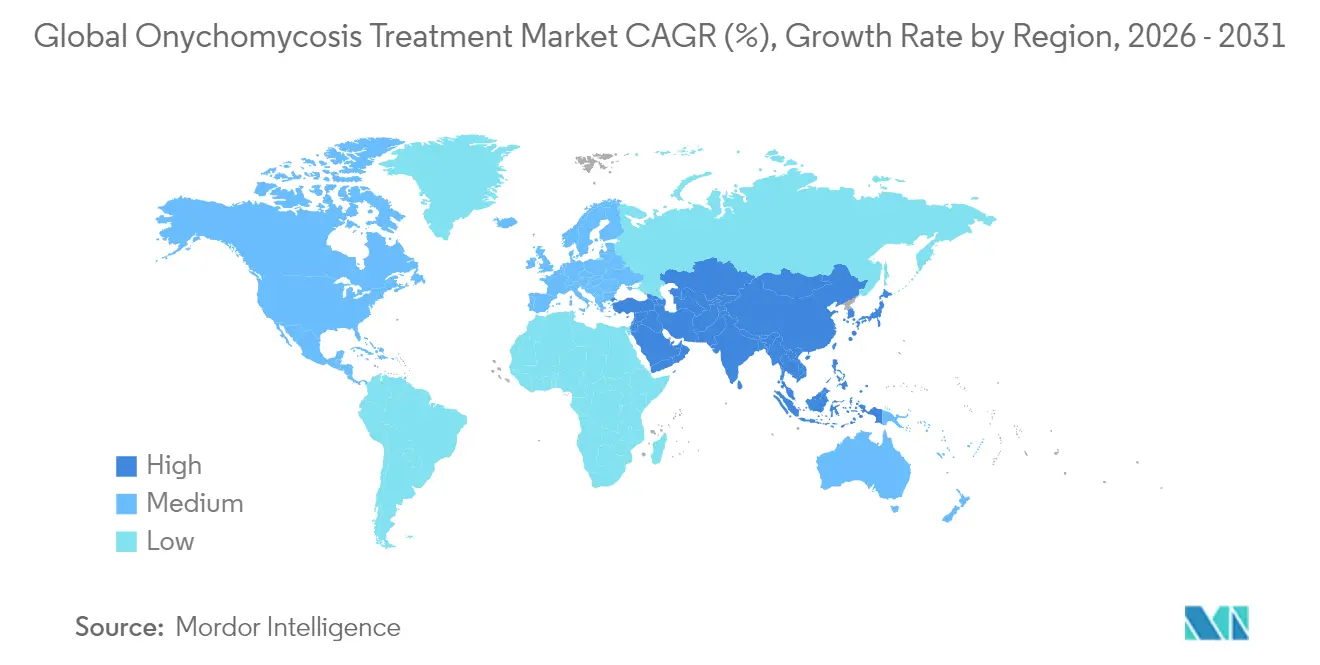
- By geography, North America led with 42.41% of the onychomycosis treatment market share in 2025, while Asia-Pacific is poised for the fastest expansion at a 5.71% CAGR as diabetes rates and healthcare access rise concurrently.
Note: Market size and forecast figures in this report are generated using Mordor Intelligence’s proprietary estimation framework, updated with the latest available data and insights as of 2026.
Market Trends and Insights
Drivers Impact Analysis of Global Onychomycosis Treatment Market*
| Driver | (~) % Impact on CAGR Forecast | Geographic Relevance | Impact Timeline |
|---|---|---|---|
| Rising prevalence of diabetes & aging population | +1.2% | Global, with highest impact in Asia-Pacific and North America | Long term (≥ 4 years) |
| Greater adoption of laser-based devices in podiatry clinics | +0.8% | North America & EU, expanding to APAC | Medium term (2-4 years) |
| Expanding e-pharmacy penetration in emerging markets | +0.6% | APAC core, spill-over to MEA and Latin America | Medium term (2-4 years) |
| Launch of high-penetration nail lacquers with nanocarriers | +0.7% | Global, with early adoption in developed markets | Short term (≤ 2 years) |
| FDA fast-track incentives for antifungal first-in-class molecules | +0.5% | Global, with regulatory spillover effects | Long term (≥ 4 years) |
| Inclusion of onychomycosis screening in corporate wellness plans | +0.3% | North America & EU, pilot programs in APAC | Long term (≥ 4 years) |
| Source: Mordor Intelligence | |||


Rising Prevalence of Diabetes & Aging Population
Older adults and people living with diabetes drive a substantial proportion of new onychomycosis diagnoses, creating a self-reinforcing base for the onychomycosis treatment market. Diabetic patients show a 4.7-fold higher infection risk, and neuropathy often delays self-detection, allowing fungi to penetrate deeper nail structures. Countries such as Singapore illustrate the challenge; nearly one-third of type 2 diabetics report at least one complication, with neuropathy present in 13.3% of cases. Limited podiatry services in parts of the Pacific Islands highlight untapped volume opportunities where clinical need exceeds supply. Urbanization across Asia-Pacific accelerates lifestyle diseases and simultaneously increases disposable income, producing a sustained demand curve for both prescription drugs and premium in-clinic procedures.
Greater Adoption of Laser-Based Devices in Podiatry Clinics
Clinicians increasingly integrate Nd:YAG and diode laser platforms to meet patient demand for non-systemic solutions that circumvent hepatic monitoring requirements. Although cure-rate evidence remains heterogeneous, cosmetic nail improvement proves attractive in cash-pay settings concentrated in affluent urban markets. Prototype diode systems combined with photodynamic therapy have demonstrated complete clearance in small studies, bolstering professional confidence. Portable home-use lasers such as Welnax BioClear democratize access and lower treatment-episode costs, an innovation expected to boost device revenues within the onychomycosis treatment market. Clinics also bundle lasers into diabetic foot-care packages, improving safety profiles for patients on complex drug regimens.
Expanding E-pharmacy Penetration in Emerging Markets
Online pharmacies remove stigma and logistical barriers by shipping topical therapies directly to consumers and pairing products with adherence education. Canadian digital platforms already dispense efinaconazole with counseling modules, illustrating how e-commerce can foster better outcomes. Teledermatology links high-resolution images to AI triage algorithms that match in-person diagnostic accuracy for many skin conditions. Emerging-market patients therefore secure earlier treatment starts, which shortens disease duration and reduces transmission risk, sustaining momentum for the onychomycosis treatment market.
Launch of High-Penetration Nail Lacquers with Nanocarriers
Nanotechnology improves drug partitioning through the dense keratinized nail plate. Lipid-based carriers raise localized ketoconazole levels multiple-fold over conventional creams. Reduced systemic absorption suits elderly and immunocompromised cohorts concerned about hepatic load. Formulators are also testing essential-oil composites that deliver broad antifungal spectra and favorable safety parameters. Combination-loaded lacquers holding two agents with distinct mechanisms aim to curb resistance and speed visible clearing, narrowing the efficacy gap with oral regimens.
Restraints Impact Analysis of Global Onychomycosis Treatment Market*
| Restraint | (~) % Impact on CAGR Forecast | Geographic Relevance | Impact Timeline |
|---|---|---|---|
| High recurrence & treatment failure rates | -1.1% | Global, with higher impact in humid climates | Long term (≥ 4 years) |
| Growing azole & allylamine resistance among dermatophytes | -0.9% | Global, with emerging hotspots in Asia and Europe | Medium term (2-4 years) |
| Limited reimbursement for cosmetic-driven procedures | -0.6% | North America & EU, with spillover to private markets | Medium term (2-4 years) |
| Safety concerns over off-label systemic use in pediatrics | -0.4% | Global, with stricter enforcement in developed markets | Long term (≥ 4 years) |
| Source: Mordor Intelligence | |||
High Recurrence & Treatment Failure Rates
Long treatment courses and moderate cure probabilities dampen patient persistence and raise relapse likelihood. Twenty-four-month efinaconazole studies delivered only 22.6% effective cure, underscoring the challenge of achieving both mycological and clinical clearance. Tropical climates sustain higher reinfection pressure, meaning practitioners must stress environmental interventions—shoe sterilization, humidity control, and periodic prophylactic applications—to prolong remission.
Growing Azole & Allylamine Resistance Among Dermatophytes
Terbinafine-resistant Trichophyton indotineae has been confirmed in North America and azole-resistant Aspergillus fumigatus strains are proliferating in Japan. Conventional culture methods miss many resistant isolates, forcing labs to adopt molecular susceptibility panels that add cost and turnaround time. Rising failure rates push clinicians toward combination therapy or newer agents, which can be expensive or not yet universally reimbursed, restraining adoption momentum within the onychomycosis treatment market.
*Our forecasts treat driver/restraint impacts as directional, not additive. The impact forecasts reflect baseline growth, mix effects, and variable interactions.
Global Onychomycosis Treatment Market Segment Analysis
By Treatment Type:
Device Innovation Accelerates Despite Medication DominanceMedication products generated 85.02% of revenue in 2025. Allylamines remain the predominant class because they bind tightly to nail keratin and deliver fungicidal action over weeks. Azoles supply broader spectrum but rising resistance pushes physicians toward combination protocols, sometimes pairing oral terbinafine with topical efinaconazole for stubborn cases. The onychomycosis treatment market size for medications is forecast to expand steadily, yet its proportional slice could shrink as devices mature.
Device modalities, led by Nd:YAG and diode lasers, are on track for a 5.08% CAGR. Clinics pitch them to patients who cannot tolerate systemic therapy due to liver disease or drug interactions. Pilot trials suggest lasers speed visible clearing, a cosmetic win that resonates with image-conscious consumers. New platforms blend radiofrequency with ultrasound permeation, driving topical actives deeper. Manufacturers bundle post-procedure maintenance kits, ensuring recurring product sales within the onychomycosis treatment industry. Collaborations between device firms and pharmaceutical companies broaden distribution and align messaging.


By Pathogen Type:
Non-Dermatophyte Molds Challenge Traditional ParadigmsDermatophytes, chiefly Trichophyton rubrum and T. mentagrophytes, accounted for 68.62% of cases in 2025. Yeasts and molds filled the rest, but improved PCR assays now uncover non-dermatophyte molds at 5.92% CAGR. Aspergillus species increasingly colonize diabetic nails where immune defense is thin. Such organisms resist many azoles, prompting wider susceptibility testing and bespoke regimens. Mixed-pathogen cases further complicate therapy, requiring dual-agent lacquers or systemic–topical combinations.
The onychomycosis treatment market size for non-dermatophyte molds is still modest but strategic. Firms that can validate broad-spectrum products gain an edge. Clinical protocols now emphasize culture and PCR before prescribing, extending diagnostic revenue streams. Laboratories partner with telederm platforms to expedite result delivery, reducing empirical misfires. The pathogen mix shift underlines a market pivot toward precision therapy and reinforces demand for next-generation formulations.
By Disease Type:
Proximal Subungual Recognition Drives Diagnostic EvolutionDistal subungual onychomycosis retained 75.74% share in 2025, as its classic pattern is hard to miss. AI tools, however, now flag proximal subungual variants earlier, driving a 6.53% CAGR within that category. Proximal lesions often signal systemic illness, so physicians order broader work-ups, expanding ancillary service revenue. Total dystrophic and white superficial forms remain smaller but call for prolonged or adjunctive therapy due to severe nail-plate disruption.
Improved dermoscopy combined with smartphone magnifiers empowers primary-care providers to identify subtypes confidently, funneling timely referrals to dermatologists. Awareness of endonyx onychomycosis, marked by milky nails devoid of crumbling, is rising after systematic reviews highlighted its distinct pathology. Each additional diagnostic nuance translates into tailored treatment plans, increasing per-patient product volumes and reinforcing overall growth for the onychomycosis treatment market.
Geography Analysis
North America Onychomycosis Treatment Market
North America captured 42.41% of global revenue in 2025 thanks to broad insurance coverage and high clinic density. U.S. clinicians routinely blend systemic pills with in-office laser sessions, creating two revenue layers per patient. Canada’s onychomycosis treatment market size stands at CAD 93.6 million (USD 68.9 million), buoyed by exclusive rights deals for novel lacquers. Mexico shows accelerating prescription volumes as diabetes clinics incorporate nail health modules into chronic-care bundles.
APAC Onychomycosis Treatment Market
Asia-Pacific posts the fastest 5.71% CAGR. China and India host vast diabetic cohorts where even low therapy uptake translates into sizable demand. Japanese and South Korean hospitals adopt nanolacquers early, reflecting mature dermatology sectors. Inward medical tourism to Thailand and Malaysia adds incremental device procedures, elevating regional receipts for the onychomycosis treatment market. Government telemedicine schemes distribute specialist advice to remote provinces, shrinking urban-rural care gaps.
Europe Onychomycosis Treatment Market
Europe remains a stable pillar. Harmonised CE marking speeds multi-country launches of innovative topicals. Sweden’s Terclara seized 36% value share within its first month, proving European receptiveness to premium treatments. Southern Europe’s humid coastline sustains high relapse rates, maintaining steady repeat-purchase cycles. Eastern European markets adopt generics aggressively, yet rising disposable income opens space for branded convenience formats.

Regulatory Landscape
Regulatory requirements for onychomycosis therapies vary by modality and region. In the United States, the FDA oversees prescription antifungals through NDA/ANDA pathways, and OTC antifungal kits can be marketed under the OTC monograph system. In the European Union, marketing authorization holders also operate under pediatric development obligations, with EMA Paediatric Investigation Plan (PIP) decisions issued for agents used in onychomycosis such as efinaconazole and terbinafine.
Lifecycle management rules have tightened as well, influencing how companies maintain and vary approved products. The EMA implemented a revised variations framework effective January 1, 2025, which changed submission rules and timelines for post-approval changes, including formulation tweaks, manufacturing-site changes, and label updates for topical lacquers and systemic products. Alongside regulatory requirements, clinical guidance shapes use, with European guideline-driven positioning of topical versus systemic therapy contributing to differences in adoption of topical-first and combination regimens.
Value Chain Analysis
The onychomycosis treatment value chain runs from API supply and formulation or device manufacturing through regulatory quality systems, then into multi-channel distribution for clinicians and consumers. Upstream inputs focus on established antifungal APIs used in topical solutions, lacquers, creams, and oral tablets, with manufacturing and quality controls aligned to regulator expectations (for example, FDA requirements for prescription products versus OTC monograph products).
For topical delivery, formulation know-how such as vehicle selection, transungual penetration enhancers, and lacquer film properties adds value beyond the API. Device-based modalities create a parallel chain that includes hardware manufacture, service and consumables, and clinic adoption. Downstream, distribution splits by setting and product type, with hospital and clinic channels supporting systemic therapies and prescription topicals, retail pharmacy and dermatology or podiatry offices supporting initiation and refills, and digital or e-pharmacy fulfillment supporting maintenance therapy and adherence programs. Recent U.S. marketing entries for OTC antifungal kits also reflect how monograph products can reach consumers through broad retail and online distribution without the same approval pathway as prescription drugs, which tends to increase SKU turnover at the point of sale. Supply risk management therefore remains tied to regulatory compliance documentation and reliable manufacturing capacity, as well as the ability to serve both traditional pharmacy networks and direct-to-patient platforms.
Competitive Landscape
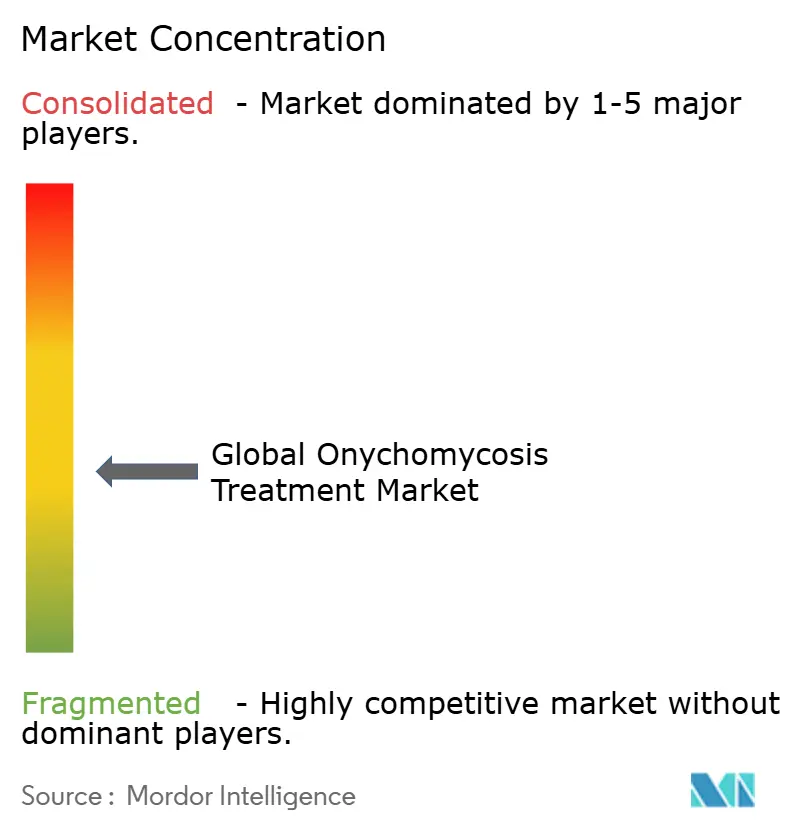
The five largest suppliers together control just over half of worldwide revenue, giving the market a moderate concentration. Systemic antifungals stay in the hands of big-pharma incumbents who exploit scale in manufacturing and detailing. Mid-size dermatology specialists dominate topical lacquers, defending niches with patent-backed delivery technologies. Device makers form a third competitive lane, licensing optical physics breakthroughs and bundling consumables into razor-and-blade models.
Strategic collaborations multiply. Pharmaceutical firms co-sponsor laser trials to validate combo protocols, while device vendors cross-sell maintenance lacquers. AI diagnostic start-ups integrate with e-pharmacy checkouts, funneling prescriptions directly into fulfillment workflows. SCYNEXIS uses regulatory fast-track status to front-run rivals on new chemical entities. Generics players, exemplified by ANI’s ketoconazole shampoo launch, temper price growth and pressure innovators to prove superior value.
Patent-term extensions documented in the Federal Register highlight continuing IP intensity and provide breathing room for R&D cost recovery. Yet high fragmentation in devices, plus open competitive fields in Asia-Pacific, ensure that innovation pace remains brisk. Marketing has shifted toward patient-centric apps, adherence gamification, and employer wellness partnerships, signalling an ecosystem approach rather than single-product reliance within the onychomycosis treatment industry.
Global Onychomycosis Treatment Industry Leaders
Bausch Health Companies Inc (Valeant Pharmaceuticals Inc)
Galderma S.A.
Novartis AG
Pfizer, Inc
Moberg Pharma AB
- *Disclaimer: Major Players sorted in no particular order
Global Onychomycosis Treatment Market Companies Covered in this Report
- Pfizer
- Novartis
- Bausch Health
- Galderma
- Johnson & Johnson
- Bayer
- GlaxoSmithKline
- Sun Pharmaceuticals Industries
- Cipla
- Teva Pharmaceutical Industries
- Kaken Pharmaceutical Co. Ltd.
- Moberg Pharma
- Taisho Pharmaceutical Co. Ltd.
- Zeria Pharmaceutical Co. Ltd.
- Hikma Pharmaceuticals
- Cutera
- Photocure ASA
- Viamet Pharmaceuticals Holdings LLC
- Medimetriks Pharmaceuticals
- Merz Pharma

Market Opportunities and Future Outlook
Unmet need continues to center on improving cure durability and reducing recurrence while avoiding systemic adverse events, leaving room for products that increase drug exposure through the nail plate and support adherence over long treatment courses. Evidence of ongoing innovation includes continued pipeline activity in topical candidates, such as Vanda Pharmaceuticals receiving FDA IND clearance (January 2024) for VTR-297, a topical investigational antifungal approach for onychomycosis. In parallel, translational work in 2025 to 2026 on nanoformulations and penetration-enhancing systems points to a technology runway aimed at topical therapy constraints, particularly nail impermeability.
Commercial opportunities also appear in price-access and channel expansion. In February 2026, Alembic Pharmaceuticals received USFDA final approval for a generic efinaconazole topical solution 10% (therapeutic equivalent to Jublia), which reinforces payer and consumer sensitivity to topical therapy costs and increases competition around established branded topicals. Separately, cross-border e-commerce models used for China market access in topical nail fungus products, including licensing arrangements explicitly targeting cross-border e-commerce channels, suggest a route to pair dermatology brands with digital distribution, particularly where in-person specialist access is uneven and maintenance refills sustain repeat demand.
Recent Industry Developments in Global Onychomycosis Treatment Market
- June 2026: Moberg Pharma signed a license agreement with Karo Healthcare AB to commercialize MOB-015 (Terclara) in China using cross-border e-commerce channels. The structure leverages digital distribution to reach patients faster than traditional retail build-outs and extends the product's geographic footprint under a recognized brand strategy.
- April 2026: Moberg Pharma expanded its exclusive licensing agreement with Karo Healthcare AB to commercialize MOB-015 (Terclara) in Australia, New Zealand, South Korea, and Taiwan, with launches planned under the Lamisil brand. The deal broadens access across multiple Asia-Pacific markets and reinforces brand-led commercialization for topical onychomycosis therapy.
- September 2024: ANI Pharmaceuticals received FDA approval for ketoconazole shampoo 2%. While shampoo formulations are not nail-specific, the approval supports broader antifungal portfolio breadth and can strengthen manufacturing, regulatory, and commercial capabilities used across fungal-treatment categories.


Global Onychomycosis Treatment Market Report Scope and Research Methodology
Market Definition and Coverage
This market covers the total value of treatments used to manage onychomycosis (fungal infection of finger or toe nails), including prescription and OTC drug therapies and clinic based procedures that are used for confirmed or suspected cases.
Scope exclusions: We do not count routine nail cosmetics, general foot care services without an onychomycosis treatment intent, and diagnostic testing revenues as part of the market value.
Segments Covered in This Report
- By Treatment Type
- Device-based Treatments
- Medication-Based Treatment
- Allylamines
- Azoles
- Other Classes
- By Pathogen Type
- Dermatophytes
- Non-dermatophyte Molds
- Yeasts
- By Disease Type
- Distal Subungual Onychomycosis
- White Superficial Onychomycosis
- Proximal Subungual Onychomycosis
- Total Dystrophic Onychomycosis
- By Geography
- North America
- United States
- Canada
- Mexico
- South America
- Brazil
- Argentina
- Rest of South America
- Europe
- Germany
- United Kingdom
- France
- Italy
- Spain
- Rest of Europe
- Asia-Pacific
- China
- Japan
- India
- South Korea
- Australia
- Rest of Asia-Pacific
- Middle East and Africa
- GCC
- South Africa
- Rest of Middle East and Africa
- North America
Data Sources, Market Sizing, and Validation
Desk Research
Desk work starts with building the demand pool and care pathway, so we can map likely treated patients to the right setting (prescription pharmacy versus clinic procedure). For this, we rely on public sources such as the US CDC, the WHO, the NIH, and PubMed indexed clinical publications, along with health system sources such as the UK NHS.
We also use customs and trade statistics portals, national drug and medical device regulator websites (for approvals and labels), and clinical guideline publications from dermatology associations, where available. Company filings, annual reports, investor presentations, and trusted press releases help sanity check product presence, portfolio shifts, and geographic focus. In a few cases, we supplement with paid subscriptions for company financials and market intelligence, patent databases, and shipment level import and export data to validate timelines and activity signals. The desk sources listed here are illustrative, and many other references were also used to collect data, validate inputs, and clarify open questions during analysis.
Primary Interviews and Surveys
Primary work is used to convert published prevalence into treated patients, then connect treated share to real world prescribing, procedure use, and pricing behavior. We spoke with clinicians, hospital and retail pharmacy stakeholders, distributors, and product and commercial leaders across major regions to check assumptions against what is actually used in practice. Respondent input helped resolve gaps such as repeat courses, switching between topical and oral regimens, and the real penetration of device based therapies.
Distribution of primary research fieldwork respondents
| Company type | Respondent position | Region |
|---|---|---|
| Top tier: 33% | CXOs: 15% | APAC: 49% |
| Mid tier: 46% | Functional/Unit leaders: 32% | EMEA: 30% |
| Smaller Players: 21% | Managers: 53% | Americas: 21% |
Market-Sizing & Forecasting
The core model is built using a top-down demand pool, where prevalence and diagnosis rates are converted into treated patients, then mapped to therapy mix across topical drugs, oral drugs, and procedure based options. Once that structure is in place, we cross check results with selective bottom-up approximations, such as sampled pricing, prescription volume proxies where available, and channel feedback on unit movement, which are then used to adjust totals if a mismatch shows up.
Key inputs used in the model include treated prevalence by age band, share of toenail versus fingernail cases (since therapy length and persistence differ), average duration and repeat course patterns, split between prescription and OTC purchasing, and procedure utilization for laser and photodynamic therapy in clinic settings. Pricing is handled through blended average selling price logic, linking changes to mix shifts, generic entry, and inflation in major healthcare systems. For forecasting, scenario analysis is applied around diagnosis and treatment uptake, and the final trajectory is checked with expert views on how quickly newer therapies and devices are likely to be adopted. When a clean country level data point is missing, we use proxy markets with similar healthcare access and disease mix, then scale using population and treatment intensity signals before final numbers are locked.
Data Validation & Update Cycle
Totals are validated through multiple checks so outputs stay consistent with independent signals, such as epidemiology ranges, treatment guidelines, and the implied prescriptions or procedure counts that the value would require. Outliers at country and region level are reviewed, and if a sudden jump is caused by a single assumption, that assumption is reworked and rechecked with a fresh set of references.
Before sign-off, a second analyst review is completed, followed by a final consistency pass so the full set of tables ties back to the same base inputs. The report is refreshed annually, and interim updates are triggered when material events occur, such as major approvals, safety changes, or sharp pricing shifts. Right before delivery, we run a last data scan so clients receive the most current view supported by explainable inputs.
Mordor Intelligence's Onychomycosis Treatment Market Size Compared With Other Published Estimates
Published values for this market often spread because not everyone counts the same treatment set, and some sources place stronger weight on procedure revenue or on manufacturer side pricing. Differences also come from the year selected as the base, how exchange rates are applied, and whether the estimate is anchored to treated patients or to broader antifungal sales.
Prescription volume signals, treated prevalence ranges from clinical literature, and clinician feedback on real world regimen duration are the checks that tie Mordor Intelligence's estimate to the treated onychomycosis pool and to a defined therapy mix that separates topical and oral courses from procedure visits.
Benchmark comparison
| Source | Market Size | Gaps in Research Methodology |
|---|---|---|
| Mordor Intelligence | USD 3.66 B (2026) | |
| Global Research Publisher A | USD 3.91 B (2025) | Built from a historic revenue series and manufacturer side value definitions that can include related services, and it does not clearly show how treated prevalence and average course duration were used to control for diagnosis and retreatment rates. |
| Global Publisher B | USD 3.20 B (2024) | Uses an earlier base year and a longer horizon with a lower stated CAGR, and the scope description is less explicit on how procedure adoption and prescription versus OTC mix were handled across regions. |
Across the three figures, the biggest differences come from the base year used and how therapy mix is constructed, especially the weight given to procedure revenue and the pricing level assumed. Our steps keep the total connected to observable patient treatment signals and clear inputs, which makes future updates more straightforward when uptake or pricing shifts.


Key Questions Answered in the Report
What is the current value of the onychomycosis treatment market?
The onychomycosis treatment market size is USD 3.66 billion in 2026.
How fast is the market expected to grow over the next five years?
The market is forecast to expand at a 4.19% CAGR, reaching USD 4.49 billion by 2031.
Which treatment modality is growing the quickest?
Device-based therapies, particularly laser systems, are projected to grow at a 5.08% CAGR through 2031.
Why is Asia-Pacific viewed as a high-growth region?
Rising diabetes incidence, broader healthcare access, and growing consumer awareness push Asia-Pacific toward a 5.71% CAGR.
What is the main clinical challenge limiting cure rates?
High recurrence and growing resistance to azole and allylamine drugs continue to constrain long-term cure outcomes.
Which new product recently achieved rapid market leadership in Europe?
Terclara, a topical terbinafine lacquer, captured 36% value share within its first month on the Swedish market.
Page last updated on:





