OLED Market Size and Share
Market Overview
| Study Period | 2020 - 2031 |
|---|---|
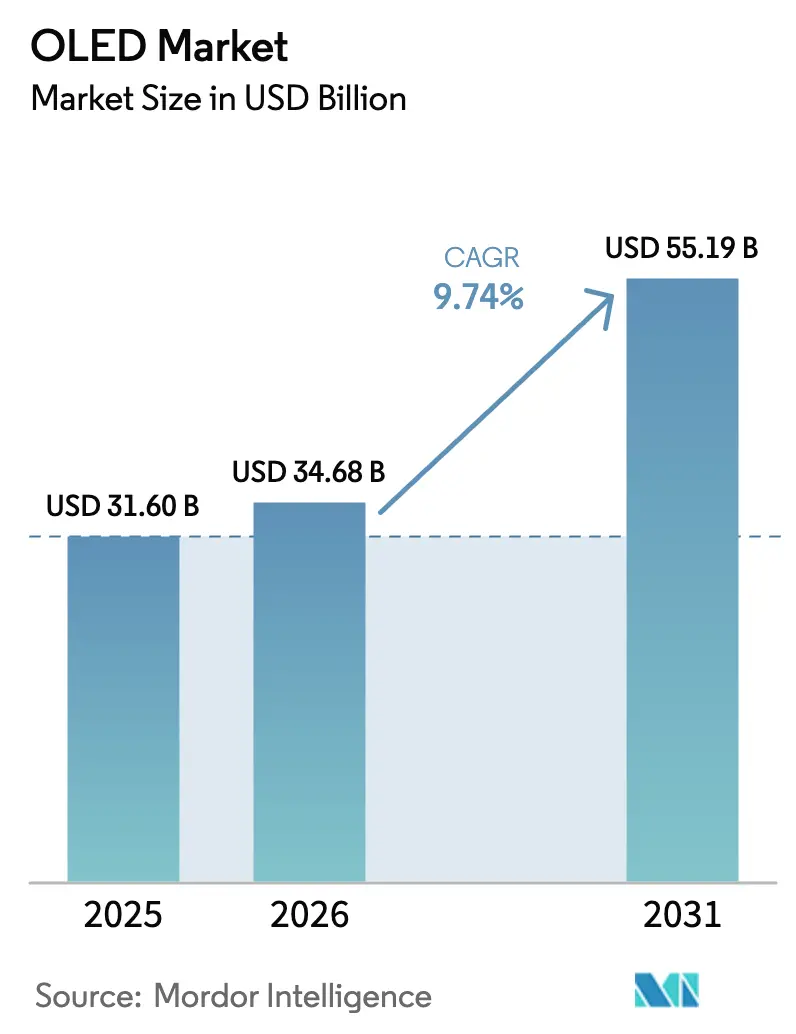
| Market Size (2026) | USD 34.68 Billion |
| Market Size (2031) | USD 55.19 Billion |
| Growth Rate (2026 - 2031) | 9.74% CAGR |
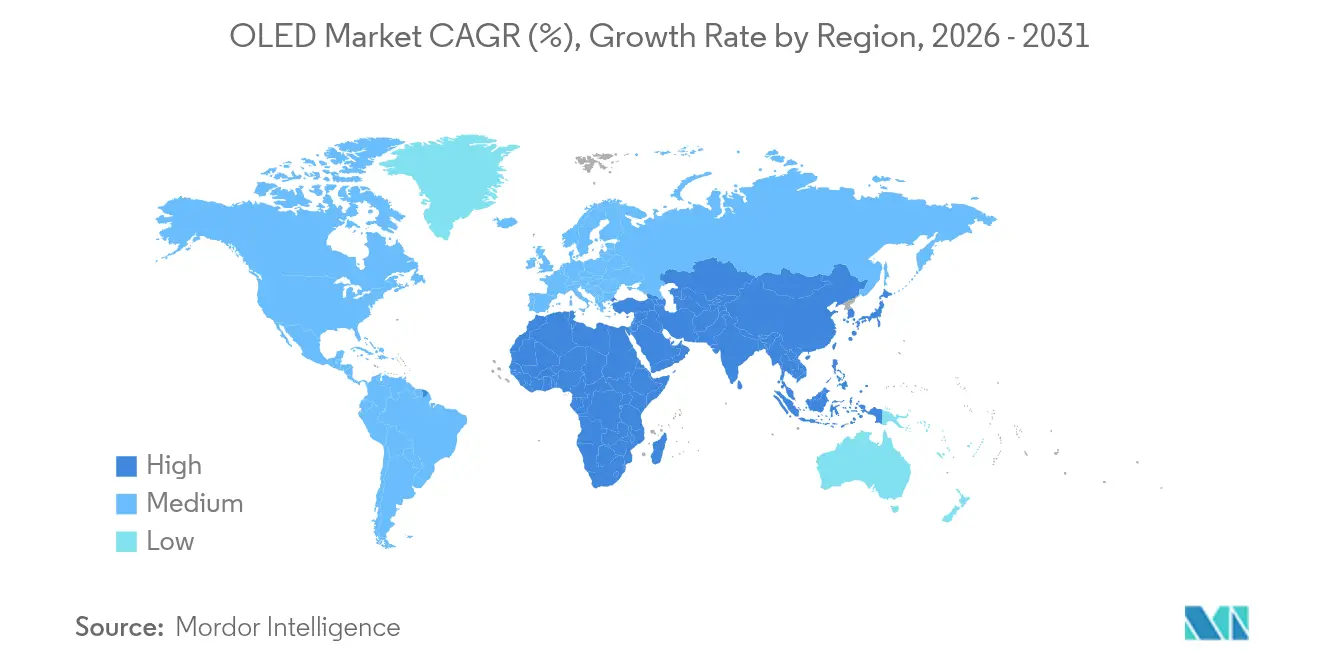
| Fastest Growing Market | Middle East and Africa |
| Largest Market | Asia Pacific |
| Market Concentration | Medium |
Major Players *Disclaimer: Major Players sorted in no particular order Image © Mordor Intelligence. Reuse requires attribution under CC BY 4.0. | |
OLED Market Analysis by Mordor Intelligence
OLED market size in 2026 is estimated at USD 34.68 billion, growing from 2025 value of USD 31.60 billion with 2031 projections showing USD 55.19 billion, growing at 9.74% CAGR over 2026-2031. Commercialisation has moved past premium smartphones toward televisions, automotive cockpits and emerging solid-state lighting, propelled by lower manufacturing costs, steady materials innovation and the arrival of blue phosphorescent emitters that trim panel power use by 15%. Capacity expansion in Asia-Pacific, particularly China, continues to redefine cost structures and has encouraged equipment suppliers to unveil mask-free deposition systems that raise aperture ratios two-fold while cutting energy consumption by 30%. Significant upside remains in foldable devices, large-area televisions and digitised vehicle interiors, while micro-LED and mini-LED technologies intensify competition in high-brightness outdoor and large-format displays.
Key Report Takeaways
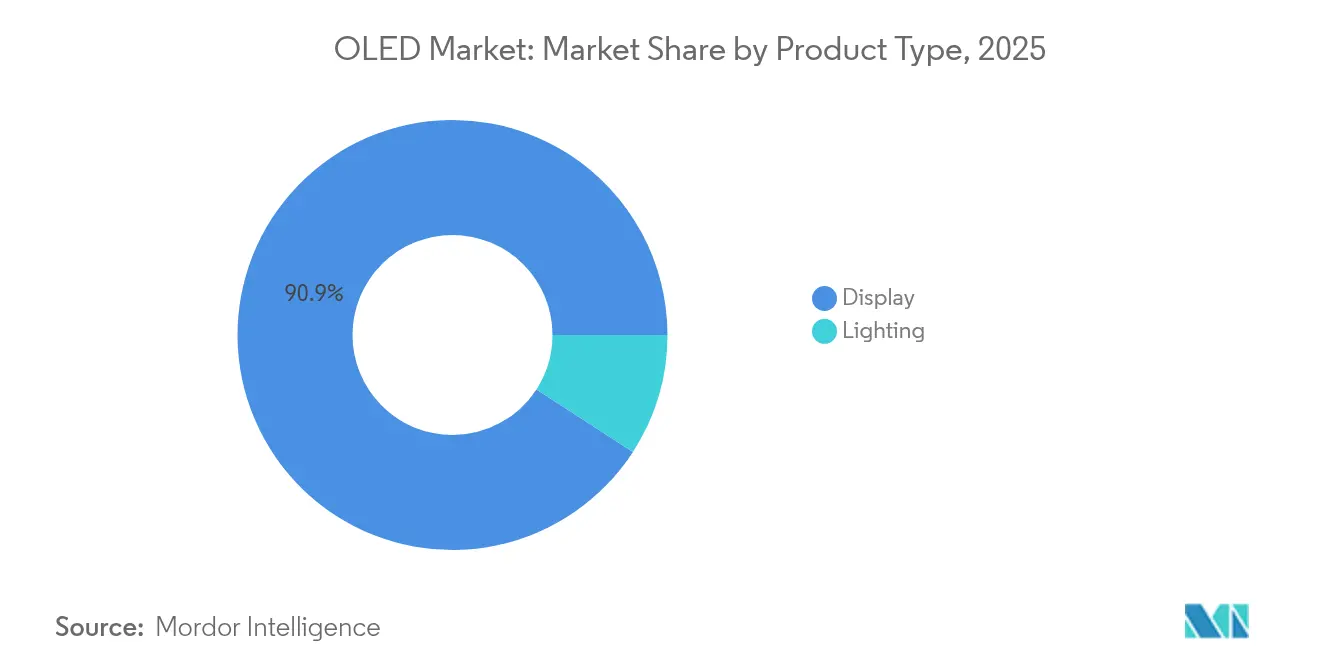
- By product type, display applications controlled 90.85% revenue in 2025, while lighting is projected to expand at a 12.28% CAGR to 2031.
- By technology, AMOLED panels held 95.55% of 2025 OLED market share, whereas PMOLED is anticipated to register the highest 10.08% CAGR through 2031.
- By form factor, flexible panels commanded 66.95% share in 2025; transparent panels are set for the fastest 13.40% CAGR.
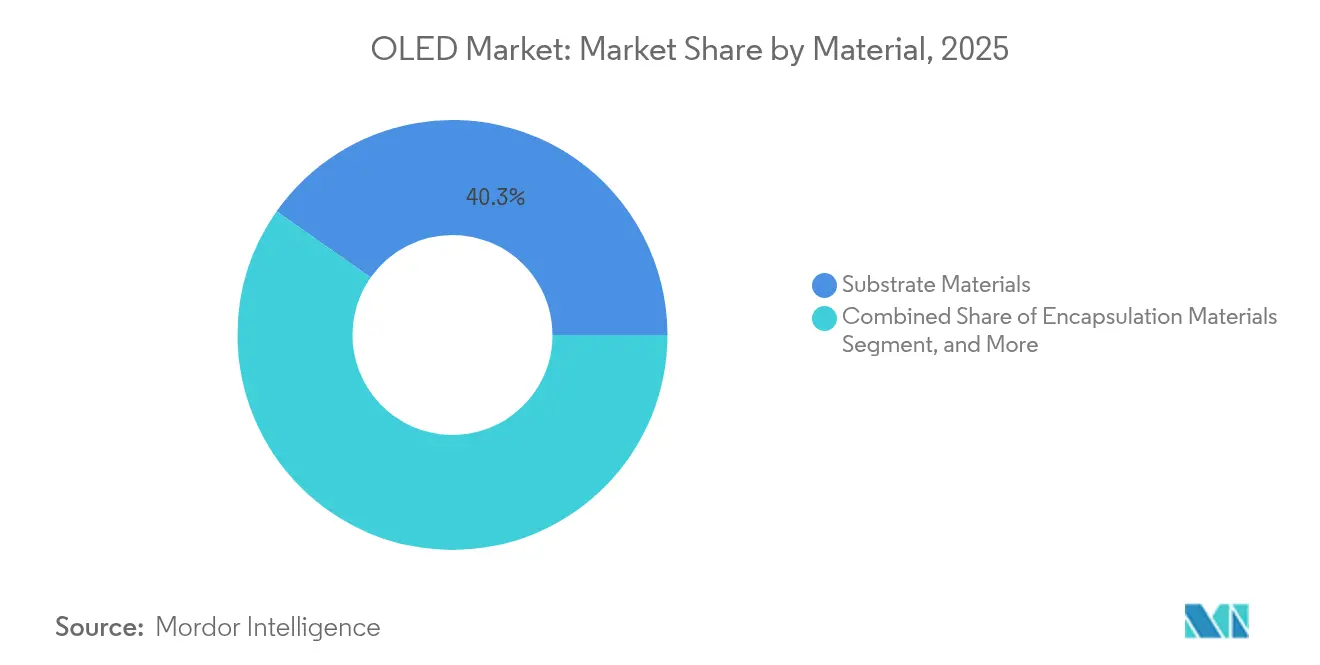
- By material, substrates contributed 40.25% revenue in 2025, while emitter and conductive materials are poised for an 11.39% CAGR.
- By application, mobiles and tablets led with 52.85% of OLED market size in 2025; automotive displays are projected to rise at a 15.58% CAGR.
- By geography, Asia-Pacific accounted for 44.05% revenue in 2025; the Middle East & Africa region is on track for an 11.62% CAGR.
Note: Market size and forecast figures in this report are generated using Mordor Intelligence’s proprietary estimation framework, updated with the latest available data and insights as of 2026.
Global OLED Market Trends and Insights
Drivers Impact Analysis*
| Driver | (~) % Impact on CAGR Forecast | Geographic Relevance | Impact Timeline |
|---|---|---|---|
| Surge in foldable smartphone adoption driving flexible AMOLED demand | +2.1% | APAC core, spill-over to North America | Medium term (2-4 years) |
| Rapid proliferation of OLED TVs owing to cost declines in large-area panels | +1.8% | Global, with concentration in North America & EU | Short term (≤ 2 years) |
| Automotive cockpit digitization accelerating demand for curved OLED displays | +1.4% | North America & EU, emerging in APAC | Long term (≥ 4 years) |
| Government incentives for energy-efficient solid-state lighting in Europe and Asia | +0.9% | Europe & Asia-Pacific | Medium term (2-4 years) |
| Hybrid QD-OLED technology enabling premium color gamut in high-end monitors | +0.7% | North America & EU premium markets | Short term (≤ 2 years) |
| Source: Mordor Intelligence | |||
Surge in Foldable Smartphone Adoption Driving Flexible AMOLED Demand
Foldable smartphones have elevated the mechanical requirements placed on OLED substrates, shifting industry focus from rigid glass to resilient polyimide films that tolerate 180-degree bends without delamination. Chinese producers have shortened the time-to-catch-up with Korean incumbents and continue to inject high-volume capacity into the OLED market, fostering price competition and new design possibilities. Continuous learning from foldable iterations is laying the groundwork for commercial rollable phones and tablets expected within two years. Success in this transition will hinge on scaling strategies that absorb yield losses while reinforcing reliability expectations for mass-market pricing. As consumer familiarity increases, flexible architectures are expected to seed demand in automotive infotainment and architectural integration where non-planar surfaces dominate.
Rapid Proliferation of OLED TVs Owing to Cost Declines in Large-Area Panels
Shipments of OLED televisions crossed 2 million units in Q4-2024, reflecting 12.6% annual growth led by demand spikes in North America and Western Europe. Capacity constraints remained evident as legacy LCD lines were retired, yet aggressive cost learning curves have narrowed price gaps between 77-inch OLEDs and similarly sized mini-LED LCD sets. Strategic sourcing agreements, such as LG Display’s white-OLED supply to Samsung Electronics, underline a recognition that scale is imperative to defend OLED’s premium tier against mini-LED encroachment. Gains in blue phosphorescent materials and tandem-stack architectures now allow panels above 1,500 nits peak brightness at noticeably lower power. The next wave of growth will rely on expanding 42- to 55-inch mainstream models positioned below USD 1,000 at retail.
Automotive Cockpit Digitisation Accelerating Demand for Curved OLED Displays
Audi’s A5 Digital Stage showcased how curved 45-inch OLED panoramas improve viewing angles and cockpit ergonomics for both driver and passenger. Premium brands are adopting OLED instruments, taillights and ambient panels to differentiate interiors without resorting to complex plastics tooling. Superior black levels and emissive flexibility let designers merge clusters, infotainment and HVAC controls into single bonded laminates that follow dashboard contours. As level-3 autonomy proliferates, display surface area per vehicle is projected to double, intensifying interest in OLED’s thin profile and low reflectance advantages. Nonetheless, automotive qualification imposes strict lifetime and temperature requirements, pushing suppliers toward tandem-stack and new encapsulation chemistries to meet 10-year reliability targets.
Government Incentives for Energy-Efficient Solid-State Lighting in Europe and Asia
The EU’s 2024/1781 ecodesign regulation introduced digital product passports and tightened procurement rules favouring energy-efficient lighting, reinforcing demand growth for OLED luminaires.[1]European Parliament, “Regulation EU 2024/1781,” eur-lex.europa.eu Parallel US Department of Energy standards targeting a 4 quadrillion BTU reduction in lamp energy by 2055 further amplify the global policy tailwind.[2]Federal Register, “Energy Conservation Standards for General Service Lamps,” federalregister.gov Although LED remains cheaper, OLED’s planar glare-free emission is gaining traction in premium office, hospitality and automotive ambient applications. Targeted subsidies in Japan and South Korea help offset capex for roll-to-roll OLED lighting fabs, accelerating cost convergence toward LEDs by late-decade. As perovskite LEDs mature, incumbent OLED vendors are pressed to scale volumes and refine light extraction to retain their policy-driven advantages.
Restraints Impact Analysis*
| Restraint | (~) % Impact on CAGR Forecast | Geographic Relevance | Impact Timeline |
|---|---|---|---|
| Yield challenges in Gen-8.5 substrates limiting large-format panel supply | -1.2% | Global, concentrated in Asia-Pacific manufacturing hubs | Short term (≤ 2 years) |
| Patent thicket around phosphorescent emitters increasing royalty burden | -0.8% | Global, affecting all major manufacturers | Medium term (2-4 years) |
| Micro-LED maturation threatening OLED competitiveness in outdoor signage | -0.6% | Global, concentrated in North America & EU commercial markets | Long term (≥ 4 years) |
| Source: Mordor Intelligence | |||
Yield Challenges in Gen-8.5 Substrates Limiting Large-Format Panel Supply
Scaling from Gen-6 to Gen-8.5 mother-glass size introduces exponential defect propagation, dampening yields and elevating cost per square metre. Mask-free deposition platforms such as Applied Materials’ MAX-OLED enable pixel-by-pixel patterning, potentially doubling aperture ratio and tripling brightness while extending lifetime five-fold on large substrates.[3]Applied Materials, “Maskless OLED Production Technology,” oled-info.com Pilot lines are targeting commercial sampling in early 2025, yet capital intensity and process unfamiliarity pose adoption risks. Japan Display’s eLeap photolithographic approach reported yields above 60% on trial runs, signalling alternate paths to large-area efficiency.[4]FlatpanelsHD, “New Type of OLED to Enter Mass Production,” flatpanelshd.com For now, panel makers juggle trade-offs among throughput, material utilisation and defect management, delaying capacity that could counter mini-LED encroachment in televisions and signage.
Patent Thicket Around Phosphorescent Emitters Increasing Royalty Burden
Universal Display Corporation owns broad patents covering red, green and forthcoming blue phosphorescent dopants, commanding licensing fees that raise bill-of-materials costs across the OLED market. In Q1-2025 the firm posted USD 166.3 million revenue and 41.9% operating margin, underscoring its royalty leverage. Delays in stabilising blue PHOLED lifetimes have postponed volume launch to 2H-2025, forcing panel producers to maintain hybrid stacks that blend fluorescent and phosphorescent blue pixels. Competing emitters from Japan and South Korea remain subject to cross-licensing constraints, preserving UDC’s position even as its portfolio begins to sunset late-decade. Persistent royalty overhead narrows the pricing headroom panel makers require to undercut mini-LED in mass-market segments.
*Our forecasts treat driver/restraint impacts as directional, not additive. The impact forecasts reflect baseline growth, mix effects, and variable interactions.
Segment Analysis
By Product Type: Display Dominance Drives Market Evolution
Display modules represented 90.85% of OLED market revenue in 2025, a position fortified by double-digit smartphone penetration and mounting television uptake. The OLED market size for lighting remained modest yet accelerated with a 12.28% CAGR forecast, as ultrathin form factors and glare-free surfaces found acceptance in premium workspace and automotive ambient systems. The OLED market has benefited from iterative cost down initiatives-re-use of common TFT backplanes, ink-jet printing for colour filters and shared driver IC platforms-that compress learning curves across both small and large displays. Lighting manufacturers, led by OLEDWorks in Germany and Konica Minolta in Japan, continue niche deployment in premium hospitality luminaires where the absence of point glare commands a high willingness to pay. Compliance with EU ecodesign rules places added momentum behind OLED panels that satisfy both energy and recyclability metrics, narrowing the gap with dominant LED strips.
The OLED market now approaches an inflection where lighting suppliers seek volume outside architectural downlights, targeting vehicular taillamps, commercial aircraft cabins and even illuminated loyalty cards. While LED incumbents price aggressively below USD 2 per kilolumen, tandem-stack OLED light engines have posted 40% power drops and 100 lm/W efficacy milestones, suggesting cost parity is plausible late-decade. Display vendors are exploring synergies-using Gen-6 mobile lines for pilot lighting runs during off-peak cycles-to spread depreciation and validate next-gen roll-to-roll encapsulation foils. Successful convergence across display and lighting could elevate the overall OLED market share of lighting above current single-digit levels by 2030, underpinning long-term diversification for panel makers.


By Technology: AMOLED Supremacy Faces Emerging Challenges
Active-matrix OLED panels dominated with 95.55% of shipments in 2025, anchored by thin-film transistors that support 120 Hz and variable refresh gaming workloads. The OLED market has rewarded the AMOLED roadmap-tandem stacks, LTPO backplanes and hybrid quantum-dot colour conversion-with sustained attach rates across flagships from Samsung, Apple and Xiaomi. Passive-matrix OLED retains relevance in simple wearables, industrial gauges and smart-cards; its projected 10.08% CAGR is propelled by cost-effective ink-jet frontplanes that skip photolithography steps. The OLED market size for PMOLED remains small yet strategically important as antenna-in-display concepts and payment tokens proliferate.
AMOLED’s leadership, however, is being tested by mask-free photolithography, eLeap pixel-division, and laser-induced quantum-dot patterning that promise higher aperture and colour volume. Panel makers must balance the benefit of new processes against the ecosystem’s entrenched LTPO supply chain: driver ICs, rigid metal-mask suppliers and photoresists optimised for current stacks. Blue phosphorescent adoption, tabled for mass launch in late 2025, will grant AMOLED a 15% energy advantage crucial for battery-constrained foldables and VR headsets. Nevertheless, mini-LED LCDs have shown double-peak brightness with lower flicker, pressuring AMOLED to deliver above 2,000 nits while mitigating image-retention risks. How effectively the OLED market internalises these challenges will dictate whether AMOLED preserves its near-monopoly into the next decade.
By Form Factor: Flexible Innovation Reshapes Applications
Flexible panels captured 66.95% revenue in 2025, underscoring the strategic weight mobile OEMs place on foldable, curved and edge-to-edge designs. Trifolding tablet concepts previewed at CES 2025 illustrate how the OLED market continually rethinks device categories once panel bending radii fall below 2 mm. Transparent OLED, predicted to compound at 13.40% over the forecast horizon, opens new use cases in heads-up automotive windscreens, museum showcases and retail freezer doors, all of which reimagine information overlay without visual obstruction. Rigid panels maintain relevance in 42- to 97-inch televisions where absolute flatness improves light extraction and mechanical support; cost advantage against flexible glass also preserves margins in mid-tier monitors.
The OLED market has seen encapsulation materials shift from multilayer inorganic stacks to single-layer hybrid coatings, cutting module thickness while preserving flex life above 200,000 cycles. Rollable prototypes leverage these gains yet must overcome motorised retraction complexity and front-surface scratch susceptibility before joining mainstream price tiers. Conversely, transparent applications battle ambient contrast loss-especially under direct sunlight-spurring interest in nano-louvre films and active dimming layers. Competitive pressure looms from transparent micro-LED demonstrations that advertise 70% transmissivity and 4,000 nits peak brightness; the ability of OLED stakeholders to scale Gen-8.5 glass and polyimide in transparent configurations will define market share retention.
By Material: Substrate Engineering Drives Innovation
Substrate inputs constituted 40.25% of overall spending in 2025 because polyimide films, ultra-thin glass and edge-seal structures dictate mechanical durability and yield. The OLED market integrates these substrates with high-barrier films and laser-patterned metal traces that safeguard flex life and thermal stability. Emitter and conductive materials headline growth at 11.39% CAGR, propelled by blue phosphorescent chemistry and quantum-dot infused colour conversion that broadens gamut and raises current efficiency past 35 cd/A. OLED market participants are also investing in stretchable silver nanowire electrodes and graphene composites which promise sub-1 Ω/Sq. sheet resistance on bendable surfaces.
Outside frontplane chemistry, backplane materials transition toward oxide semiconductors and low-temperature poly-silicon (LTPS-Oxide hybrids) that pair high mobility with power frugality. Applied Materials’ mask-free toolsets facilitate wider emission areas, slashing organic material waste by as much as 50%. This cascades downstream, reducing indium tin oxide demand and curbing rare-metal volatility risk. While material suppliers like Idemitsu Kosan and Merck intensify R&D on thermally activated delayed fluorescence hosts, encapsulation innovators focus on atomic-layer deposition to maintain seal integrity during repetitive torsion. Strategic sourcing of these materials will continue to define cost baselines even as substrate yields climb, shaping competitiveness across the OLED market.
By Application: Mobile Leadership Faces Automotive Disruption
Smartphones and tablets accounted for 52.85% of 2025 revenue, a testament to the OLED market’s origins as the benchmark for flagship handset displays. Apple’s decision to transition the 2025 iPhone SE line to 6.1-inch OLED confirms the irreversible pivot away from LCD backplanes, further cementing AMOLED as the de-facto standard at scale. Yet, automotive clusters and infotainment modules are on course for a 15.58% CAGR, driven by premium OEMs seeking cohesive pillar-to-pillar screens and ambient lighting signatures. The OLED market size for automotive was modest in 2025 but is forecast to expand materially as electric vehicles integrate larger touchscreen surfaces to replace physical buttons.
Televisions face a two-front contest: mini-LED is cheaper per inch at high brightness, whereas micro-LED prototypes promise unmatched longevity in commercial signage. Monitor and notebook adoption stands at an inflection, fuelled by tandem-stack panels that triple brightness while lowering power draw by 40%-attributes critical for professional creators and high-refresh gamers. Wearables, another OLED market stronghold, exploit variable refresh and LTPO backplanes to extend battery life; flexible form factors may soon wrap 360° around wrists for continuous biometric sensor coverage. As application diversity grows, panel makers will juggle yield optimisation, colour uniformity and lifetime trade-offs unique to each vertical.
Geography Analysis
Asia-Pacific contributed 44.05% of 2025 revenue, reflecting deep supply-chain integration from organic material producers to Gen-6 and Gen-8.5 fabs concentrated in China and South Korea. Municipal incentives and long-term equipment financing enable Chinese vendors to pull ahead on installed capacity, even as Korean peers preserve a quality lead at the high-brightness premium end. By 2025, China is projected to host nearly three-quarters of global AMOLED tooling footprints, accelerating the learning rate that compresses cost curves for the entire OLED market. Japanese firms specialise upstream in deposition masks, fine metal shadowing and high-purity emitters, maintaining healthy export margins despite diminished panel output.
North America, while lacking large-scale fab presence, drives value via high ASP televisions and smartphones, and hosts emerging manufacturing initiatives such as the OLEDWorks-JDI alliance in the United States. Regional demand for 77- to 83-inch OLED TVs surged 19% year-on-year in Q4-2024, influenced by aggressive promotional cycles tied to streaming platform launches. Europe remains the second-largest consumption hub, buoyed by strong replacement demand for energy-efficient appliances under ecodesign mandates and a preference for premium audio-visual experiences in mature markets. German automakers in particular catalyse automotive OLED development through integrator partnerships that embed curved clusters and ambient lighting into next-gen cockpits.
The Middle East and Africa recorded the fastest 11.62% CAGR outlook on a small base, supported by rising disposable income and smart-city investments that integrate transparent panels in retail façades and information kiosks. India is nurturing a domestic display ecosystem; agreements between Tata Electronics, Himax and Powerchip aim to launch a 6-Gen AMOLED pilot line, signalling policy intent to reduce reliance on imports. Such diversification mitigates geopolitical supply risks and may unlock future export corridors into Africa and Southeast Asia. Overall, geography-specific industrial policies, labour structures and energy costs will continue to influence the distribution of capital expenditure across the OLED market.

Competitive Landscape
Competition in the OLED market has intensified as Chinese panel makers cut the technology gap versus Korean incumbents, leveraging state-backed financing to roll out multi-line complexes across Chengdu, Wuhan and Hefei. Samsung Display and LG Display, the traditional leaders, concentrate on high-margin segments-tandem IT panels and quantum-dot converted monitors-while also forming cross-supply pacts to secure white-OLED capacity for large-screen televisions. Universal Display Corporation retains pivotal control over phosphorescent materials, its 41.9% operating margin demonstrating the pricing power derived from a broad patent trove. Applied Materials, Nikon and Canon Tokki operate as critical enablers, dictating throughput gains through lithography, ink-jet and evaporation hardware evolution.
Strategic moves include LG Display’s complete divestment of Chinese LCD fabs to funnel cash toward 8.6-Gen IT AMOLED lines, Samsung Display’s rush to broaden QD-OLED monitor offerings, and BOE’s mass-production ramp on flexible Gen-6 lines that serve domestic smartphone OEMs. Equipment advances such as mask-free photolithography promise to lower variable cost structures, eroding entry barriers and prompting incumbents to differentiate via blue emitter quality, tandem stack lifetime and after-sales warranty extensions. Emerging disruptors-from micro-LED start-ups to perovskite LED material ventures-challenge OLED’s supremacy in niche brightness-critical applications, prompting existing vendors to expand collaborative ecosystems around transparent, rollable and stretchable panel morphologies.
Multi-pronged competitive strategies now orbit sustainability goals: reclaiming organic solvent waste, incorporating recycled polyimide substrates and achieving carbon-neutral fabs by 2035. Western retailers pressure upstream vendors to certify environmental footprints, further pushing panel makers to invest in closed-loop material recovery. As supply chains diversify and process learning accelerates, the OLED market is likely to see periodic shifts in share, but existing intellectual property moats and capital intensity remain formidable obstacles for newcomers aiming at mass production.
OLED Industry Leaders
Sony Corporation
Pioneer Corporation
LG Display Co. Ltd.
Samsung Display Co. Ltd.
Universal Display Corporation
- *Disclaimer: Major Players sorted in no particular order

Recent Industry Developments
- May 2025: LG Display achieved commercial verification of blue phosphorescent OLED panels using hybrid tandem stacks, enabling 15% power savings.
- May 2025: Universal Display Corporation raised full-year revenue guidance to USD 640–700 million on the back of blue emitter progress.
- April 2025: Samsung Display posted KRW 5.9 trillion Q1-2025 revenue, boosted by QD-OLED monitors.
- April 2025: LG Display returned to profitability with KRW 33.5 billion Q1-2025 operating income as OLED reached 55% revenue contribution.
- March 2025: Tata Electronics partnered with Himax and PSMC to build India’s first AMOLED pilot line.
- February 2025: OLEDWorks and Japan Display agreed to establish advanced OLED manufacturing in the United States


Global OLED Market Report Scope
The term 'OLED' refers to an organic light-emitting diode. These devices utilize LED technology and incorporate an organic substance as the layer responsible for light emission. Organic LEDs are capable of delivering high-quality displays characterized by excellent contrast, wide viewing angles, and true black levels.
The study tracks the revenue accrued through the sale of OLED display and lighting products by various players in the global market. The study also tracks the key market parameters, underlying growth influencers, and major vendors operating in the industry, which supports the market estimations and growth rates over the forecast period. The study further analyses the overall impact of COVID-19 aftereffects and other macroeconomic factors on the market. The report’s scope encompasses market sizing and forecasts for the various market segments.
The OLED market is segmented by product type (display and lighting), technology (passive matrix OLED and active matrix OLED), type (flexible, rigid, and transparent), application (mobile & tablet, television, automotive displays, smartwatches & wearables, digital signage/large format display, PC monitors and laptops, and other applications), and geography (North America, Europe, Asia-Pacific, Latin America, and Middle East and Africa). The market sizes and forecasts are provided in terms of value (USD) for the above-mentioned segments.
| Display |
| Lighting |
| Passive Matrix OLED (PMOLED) |
| Active Matrix OLED (AMOLED) |
| Flexible |
| Rigid |
| Transparent |
| Substrate Materials |
| Encapsulation Materials |
| Emitter and Conductive Materials |
| Backplane and Other Materials |
| Mobile and Tablet |
| Television |
| Automotive Displays |
| Smartwatches and Wearables |
| Digital Signage and Large-Format Display |
| PC Monitors and Laptops |
| Other Applications |
| North America | United States | |
| Canada | ||
| Mexico | ||
| Europe | Germany | |
| United Kingdom | ||
| France | ||
| Nordics | ||
| Rest of Europe | ||
| South America | Brazil | |
| Rest of South America | ||
| Asia-Pacific | China | |
| Japan | ||
| India | ||
| South-East Asia | ||
| Rest of Asia-Pacific | ||
| Middle East and Africa | Middle East | Gulf Cooperation Council Countries |
| Turkey | ||
| Rest of Middle East | ||
| Africa | South Africa | |
| Rest of Africa | ||
| By Product Type | Display | ||
| Lighting | |||
| By Technology | Passive Matrix OLED (PMOLED) | ||
| Active Matrix OLED (AMOLED) | |||
| By Form Factor Type | Flexible | ||
| Rigid | |||
| Transparent | |||
| By Material | Substrate Materials | ||
| Encapsulation Materials | |||
| Emitter and Conductive Materials | |||
| Backplane and Other Materials | |||
| By Application | Mobile and Tablet | ||
| Television | |||
| Automotive Displays | |||
| Smartwatches and Wearables | |||
| Digital Signage and Large-Format Display | |||
| PC Monitors and Laptops | |||
| Other Applications | |||
| By Geography | North America | United States | |
| Canada | |||
| Mexico | |||
| Europe | Germany | ||
| United Kingdom | |||
| France | |||
| Nordics | |||
| Rest of Europe | |||
| South America | Brazil | ||
| Rest of South America | |||
| Asia-Pacific | China | ||
| Japan | |||
| India | |||
| South-East Asia | |||
| Rest of Asia-Pacific | |||
| Middle East and Africa | Middle East | Gulf Cooperation Council Countries | |
| Turkey | |||
| Rest of Middle East | |||
| Africa | South Africa | ||
| Rest of Africa | |||


Key Questions Answered in the Report
What is the current value of the OLED market?
The OLED market is valued at USD 34.68 billion in 2026 and is projected to reach USD 55.19 billion by 2031 at a 9.74% CAGR.
Which application area is expanding the fastest?
Automotive displays are the fastest-growing application segment, forecast to rise at a 15.58% CAGR as electric and autonomous vehicles demand larger curved screens.
Why are blue phosphorescent materials important?
Blue phosphorescent emitters cut power consumption by roughly 15% and enable higher brightness, extending battery life in mobiles and reducing energy costs in televisions.
How do flexible and transparent OLED panels differ?
Flexible panels use polyimide substrates to enable folding and bending, while transparent panels allow light to pass through, supporting heads-up displays and see-through retail screens.
What regions present the highest growth potential beyond Asia-Pacific?
The Middle East & Africa region shows the highest relative growth outlook at an 11.62% CAGR, followed by North America, driven by premium TV and automotive demand.
How does OLED compete with mini-LED and micro-LED?
OLED’s self-emissive pixels deliver perfect blacks and flexibility, but mini-LED offers higher peak brightness at lower cost, and micro-LED targets long-life, high-brightness outdoor use; continued improvements in blue emitters and tandem stacks help OLED retain its premium edge.
Page last updated on:


