OLED Panel Market Size and Share
Market Overview
| Study Period | 2020 - 2031 |
|---|---|
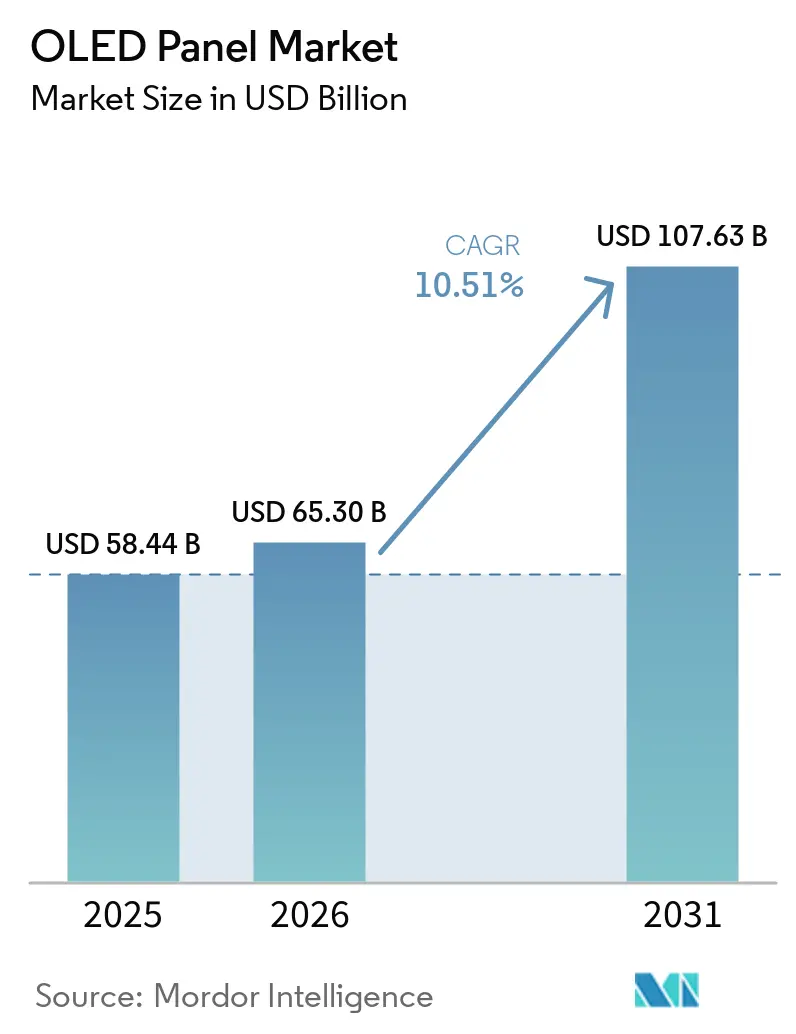
| Market Size (2026) | USD 65.30 Billion |
| Market Size (2031) | USD 107.63 Billion |
| Growth Rate (2026 - 2031) | 10.51% CAGR |
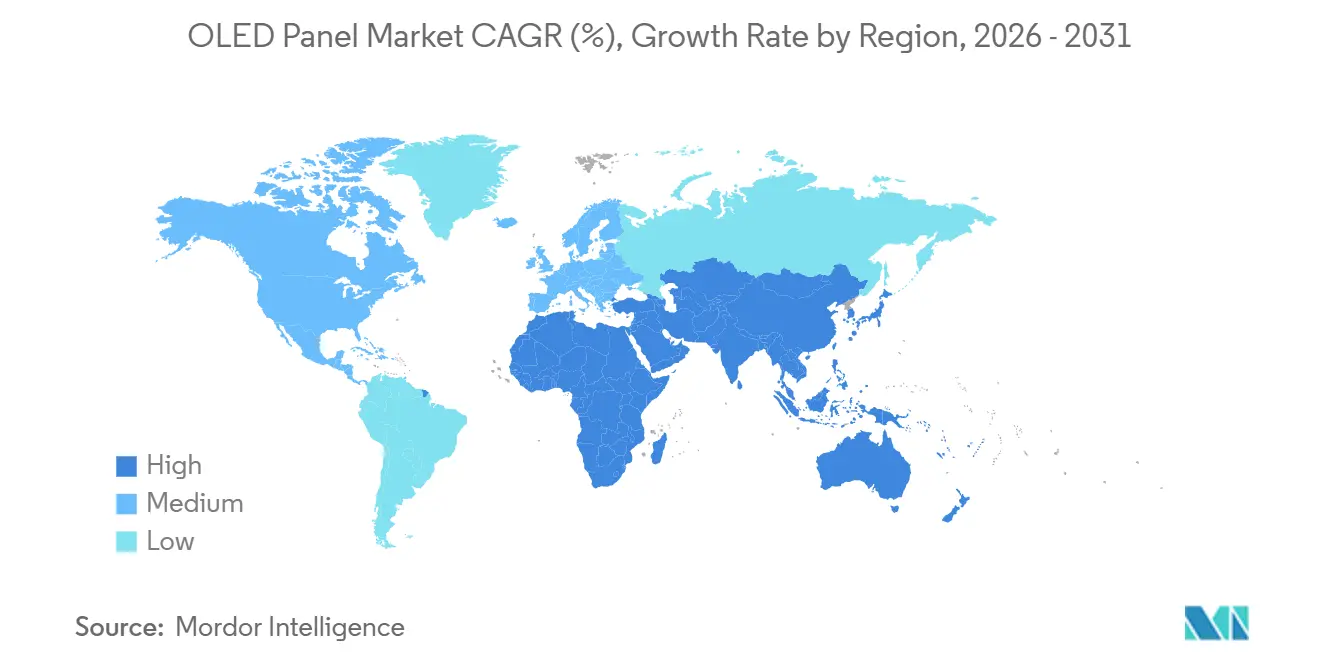
| Fastest Growing Market | Middle East |
| Largest Market | Asia Pacific |
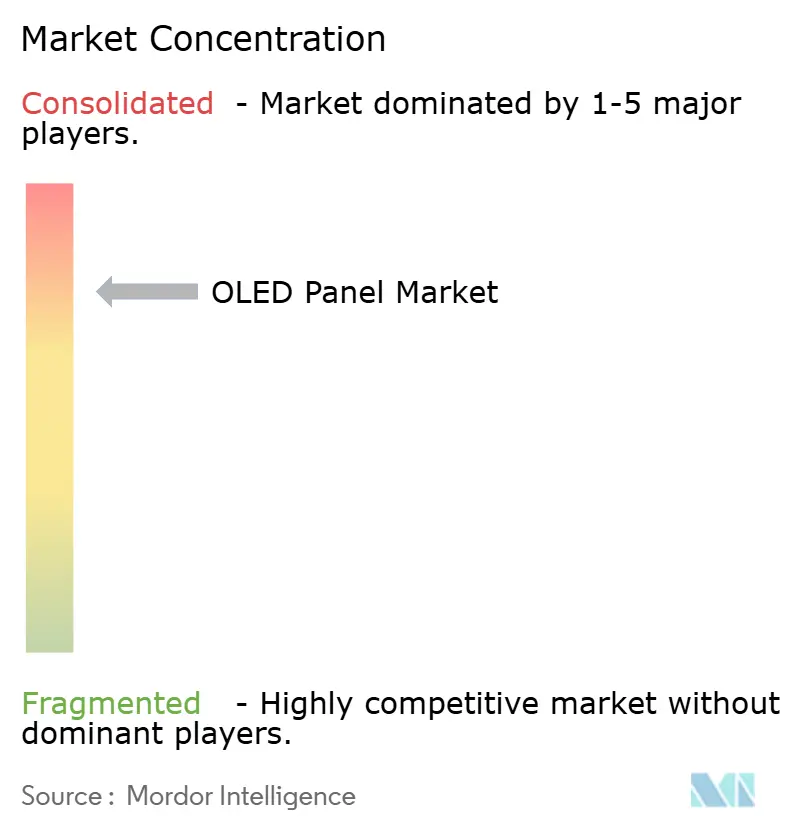
| Market Concentration | High |
Major Players *Disclaimer: Major Players sorted in no particular order Image © Mordor Intelligence. Reuse requires attribution under CC BY 4.0. | |
OLED Panel Market Analysis by Mordor Intelligence
The OLED Panel Market size was valued at USD 58.44 billion in 2025 and is estimated to grow from USD 65.30 billion in 2026 to reach USD 107.63 billion by 2031, at a CAGR of 10.51% during the forecast period (2026-2031).
This expansion reflects widening adoption across smartphones, televisions, automotive cockpits, and IT devices as flexible, transparent, and tandem-structure architectures narrow cost-performance gaps with rival backlit LCD and candidate micro-LED solutions. Scale advantages in Chinese Gen-8/9 fabs have lowered mid-tier panel pricing, while Korean incumbents fortify the premium tier through LTPO backplanes and dual-stack emitter designs that triple lifetime and brightness. Synergistic gains from printed-OLED pilot lines and maskless photolithography further reduce material waste, setting the stage for mass-market penetration of rollable, foldable, and free-form form factors. In parallel, stricter energy-efficiency targets and evolving IEC standards accelerate OEM migration toward emissive technologies that minimize backlight power draw. Overall, the competitive dynamic balances cost leadership, technology differentiation, and supply-chain resilience across Asia Pacific, North America, Europe, and the Middle East.
Key Report Takeaways
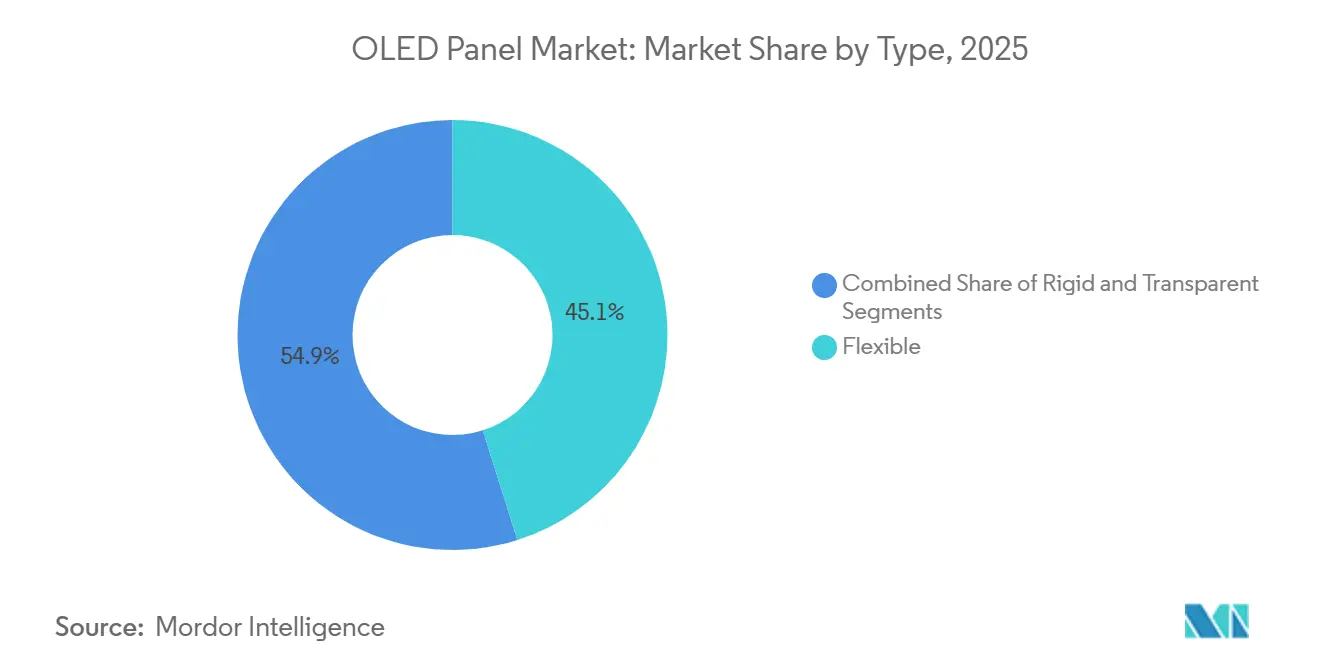
- By type, flexible OLEDs accounted for 45.11% of 2025 revenue and are forecast to grow at a 10.81% CAGR through 2031.
- By display address scheme, LTPO-AMOLED variants registered the fastest expansion at 10.95% CAGR between 2026 and 2031.
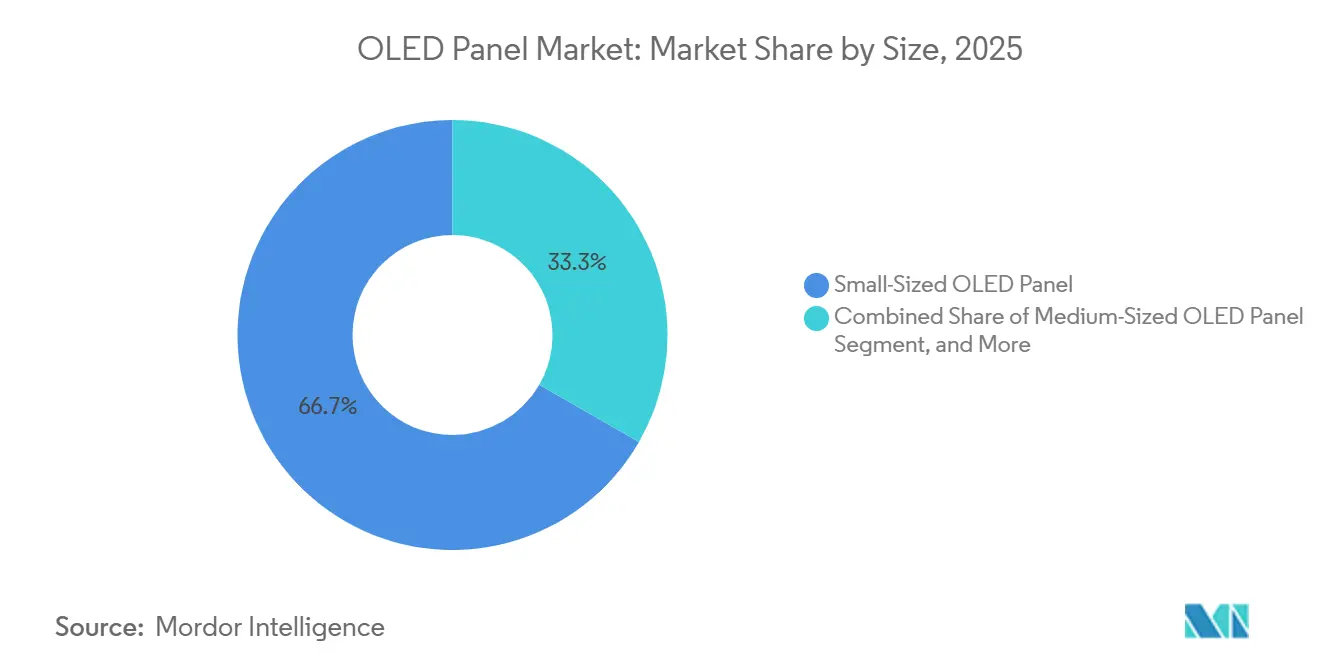
- By size, large-format panels commanded 30% of the OLED panel market share in 2025 and are projected to post an 11.91% CAGR to 2031.
- By product, automotive applications are set to expand at an 11.43% CAGR, outpacing television, mobile, and wearable categories.
- By geography, Asia Pacific led with 71.49% revenue share in 2025, while the Middle East is slated to record the quickest regional growth of 11.83% CAGR through 2031.
Note: Market size and forecast figures in this report are generated using Mordor Intelligence’s proprietary estimation framework, updated with the latest available data and insights as of January 2026.
Global OLED Panel Market Trends and Insights
Drivers Impact Analysis*
| Driver | (~) % Impact on CAGR Forecast | Geographic Relevance | Impact Timeline |
|---|---|---|---|
| Rising Adoption of Flexible OLEDs in Smartphones | +2.3% | Global, with concentration in Asia Pacific and North America | Medium term (2-4 years) |
| Price-Driven Shift From Rigid to Flexible Supply in China | +1.8% | Asia Pacific core, spillover to Europe and Middle East | Short term (≤ 2 years) |
| Emergence of LTPO Backplanes in Mainstream Models | +1.6% | Global, led by North America and Asia Pacific premium segments | Medium term (2-4 years) |
| Rapid OLED Penetration in Gaming Monitors and Laptops | +1.4% | North America and Europe, expanding to Asia Pacific | Medium term (2-4 years) |
| Demand for Curved and Free-Form Automotive Cockpit Displays | +1.7% | Europe and North America premium automotive markets, expanding to Asia Pacific | Long term (≥ 4 years) |
| Increasing Brand Adoption of Foldable and Rollable Form Factors | +1.3% | Global, early adoption in Asia Pacific and North America | Long term (≥ 4 years) |
| Source: Mordor Intelligence | |||
Rising Adoption of Flexible OLEDs In Smartphones
Flexible OLED penetration reached 57% of smartphone shipments in Q1 2025 as Chinese Android brands standardized flex panels in mid-tier models and Apple migrated every iPhone SKU to OLED. Unit prices for 6-inch flexible panels are trending below USD 30 by 2027 as Samsung Display’s Asan Gen-8-line scales output.[1]“Galaxy OLED Technology Roadmap,” Samsung Display Newsroom, news.samsungdisplay.com The narrowing 15% price gap versus rigid OLEDs positions flex architectures as the default choice, relegating rigid units to feature phones and industrial controls. IEC 62715-2:2022 certification frameworks simplify OEM qualification, further accelerating adoption.
Price-Driven Shift from Rigid to Flexible Supply in China
BOE’s USD 8.9 billion Chengdu fab and CSOT’s USD 4.1 billion Guangzhou printed-OLED facility add a combined 54,500 substrates per month, compressing rigid utilization below 50% and cutting the flex-rigid price spread to under 15%. Chinese brands now specify flexible OLEDs for smartphones priced under USD 300, squeezing older rigid lines in Korea and Taiwan and prompting conversion or exit strategies. Short-run oversupply risk persists, but accelerated depreciation and government incentives sustain Chinese fabs until demand matches capacity.
Emergence Of LTPO Backplanes in Mainstream Models
LTPO enables adaptive refresh rates from 1 Hz to 120 Hz, slicing handset power draw by up to 20% while preserving gaming responsiveness. Apple extended LTPO across the iPhone 17 family in 2025, while Xiaomi and OPPO adopted it in flagships above USD 500. LTPO units command a 25% premium yet deliver tangible battery-life benefits, making the technology table stakes by 2027. Compliance with IEC 62341-6-1:2017 guarantees uniform optical benchmarks, enabling multi-source procurement.
Rapid OLED Penetration in Gaming Monitors and Laptops
Samsung Display’s ultra-thin notebook panels and Japan Display’s 14-inch eLEAP modules reaching 1,600 nits peak brightness unlocked new use cases in creative and gaming notebooks.[2]“Transparent OLED Subway Project,” LG Display Newsroom, lgdisplay.com OLED laptop penetration climbed to 8% in 2025 despite a 40% premium over IPS LCD. Cross-subsidization of Gen-8 fabs across smartphones, tablets, and laptops lowers the break-even volume for IT panels to 200,000 units annually, strengthening the business case for future rollable and large-format monitor introductions.
Restraints Impact Analysis*
| Restraint | (~) % Impact on CAGR Forecast | Geographic Relevance | Impact Timeline |
|---|---|---|---|
| Persistent Blue-Emitter Lifetime Limitations | -1.2% | Global, particularly impacting large-format television and automotive applications | Long term (≥ 4 years) |
| Competition From Mini-LED LCD and Micro-LED Roadmaps | -1.5% | North America and Europe for televisions, Asia Pacific for IT displays | Medium term (2-4 years) |
| Capital-Intensive Gen-8/9 OLED Fab Build-outs | -0.9% | Asia Pacific, with spillover effects on global pricing | Short term (≤ 2 years) |
| Oversupply Risk From Aggressive Chinese Capacity Expansion | -1.1% | Global, most acute in Asia Pacific and Middle East | Short term (≤ 2 years) |
| Source: Mordor Intelligence | |||
Persistent Blue-Emitter Lifetime Limitations
Fluorescent blue emitters exhibit half-lives below 10,000 hours at 1,000 nits, forcing panel makers to overdrive subpixels and adopt tandem stacks, which add USD 50-80 per panel. The cost penalty constrains OLED uptake in 75-inch-plus televisions, where mini-LED LCD delivers comparable HDR at 60% of the price. Commercial blue phosphorescent solutions remain elusive despite ongoing Universal Display R&D, leaving lifetime as OLED’s Achilles’ heel in ultra-large and high-luminance applications.
Competition From Mini-LED LCD And Micro-LED Roadmaps
Mini-LED televisions now exceed 4,000 nits brightness with 10,000+ local-dimming zones, eroding OLED’s contrast advantage without burn-in drawbacks. Samsung’s micro-LED prototypes promise emissive performance but are 10 times costlier than OLED due to low transfer yields. Together, these alternatives cap OLED premiums in large TVs and gaming monitors until printed-OLED and tandem-stack cost reductions reach mass-production scale after 2028.
*Our forecasts treat driver/restraint impacts as directional, not additive. The impact forecasts reflect baseline growth, mix effects, and variable interactions.
Segment Analysis
By Type: Flexible Panels Cement Mainstream Dominance**
The OLED panel market size for flexible formats captured USD 29.9 billion in 2025 and is forecast to expand at a 10.81% CAGR as smartphone vendors and IT OEMs pivot to bendable, rollable, and curved displays. Transparent variants, although only 2% of 2025 revenue, will rise fastest at 11.09% CAGR through 2031 thanks to automotive A-pillar integration and retail signage. Rigid panel demand continues to shrink, falling below 20% of segment revenue by 2028. Material savings from printed, maskless processes and higher substrate throughput at Gen-8 fabs will keep flexible pricing competitive against legacy rigid units even as Chinese subsidies taper.
Design latitude drives flexible OLED beyond handsets into laptops, tablets, and wearables. Samsung Display’s 17-inch rollable laptop screen and Hyundai Mobis’s 18-inch curved cockpit module illustrate how bend radius and thinness unlock novel industrial designs. Transparent OLEDs still struggle with 40% lower transmittance than clear glass, limiting outdoor readability, but indoor transportation and smart-city projects in Seoul and Dubai demonstrate emerging commercial viability. Overall, flexible architecture secures its position as the default across consumer electronics while rigid panels retreat to niche industrial utilities.


By Display Address Scheme: LTPO-AMOLED Sets Efficiency Benchmark
AMOLED commanded 83.63% revenue in 2025 and remains the workhorse engine of the OLED panel market. LTPO-AMOLED, the fastest-growing subset at 10.95% CAGR, marries oxide and poly-silicon transistors to enable 1-120 Hz refresh modulation, reducing handset power budgets by up to one-fifth. The OLED panel market share for LTPO reached 18% in 2025 and is projected to surpass 35% by 2031 as Apple, Samsung, and Chinese rivals standardize the feature in premium tiers.
PMOLED lingers in sub-2-inch wearables and industrial displays but will slip below 5% revenue contribution by 2029. Japan Display’s eLEAP process, boosting aperture ratios to 60% and doubling luminance, advances AMOLED longevity in notebooks and automotive dashboards. Compliance with the IEC 62341 series eases homologation across regions, reinforcing AMOLED’s lead as mini-LED LCD and micro-LED face scaling hurdles.
By Size: Large Formats Accelerate on Premium TV Uptake
Small panels under 10 inches represented 66.71% revenue in 2025 as smartphones refreshed on 2-3-year cycles. The OLED panel market size for large formats above 32 inches, however, will outpace at 11.91% CAGR through 2031, buoyed by 70-inch-plus TV sales that grew 41% year-over-year in H1 2025. LG Display shipped 6 million OLED TV panels in 2025 and targets 7 million in 2026, relying on dual-stack designs to guarantee 10-year warranties.
Medium-sized 10-20-inch panels straddle tablets and automotive cockpits. Mercedes-Benz’s Maybach S-Class will house a 48-inch flexible OLED from 2028, blurring traditional size buckets. Mini-LED remains competitive in 32-50-inch TVs and high-luminance gaming monitors, but OLED’s infinite contrast, sub-1 mm thickness, and falling cost curve position it to seize 30% of the premium 55-inch-plus television segment by 2029.
By Product: Automotive Displays Deliver the Highest Growth Runway
Mobile and tablet devices held 58.38% revenue share in 2025, yet automotive panels are poised for an 11.43% CAGR through 2031 as OEMs embrace curved, free-form cockpits. Samsung Display scaled automotive shipments from 100,000 units in Q1 2024 to 500,000 units in Q3 2025, while Mercedes-Benz adopted a 48-inch flexible OLED housed in the Maybach dashboard. Television maintains the second-largest slice, led by LG Electronics and Samsung Electronics, which together shipped 1.83 million OLED TVs into North America and Europe in H1 2025.
Wearables continue to enjoy steady gains via LTPO-enabled always-on modes that stretch smartwatch battery life past 48 hours. Lighting remains niche, hampered by 60 lm/W efficacy compared with 150 lm/W LEDs, but architects prize OLED’s diffuse glow for premium interiors. Healthcare monitors leverage OLED’s million-to-one contrast for surgical visualization, while home appliances integrate slim OLED touch panels for UX differentiation despite sub-2 million annual unit volume.
Geography Analysis
Asia Pacific controlled 71.49% of 2025 revenue, propelled by China’s 52.1% share of global panel turnover and USD 13 billion in cumulative Gen-8/9 capex by BOE and CSOT. South Korea retained technological primacy, owning 82.6% of OLED TV output and 64.5% of iPhone 17 panel supply, while Japan focused on high brightness eLEAP devices. India, with sub-30% smartphone OLED penetration, remains price sensitive but shows upside as domestic brands pivot to affordable flexible AMOLED imports. Asia Pacific thus remains the production heartland, balancing Chinese scale and Korean innovation.
North America and Europe contributed premium demand without domestic fabrication. The regions shipped 1.83 million OLED TVs in H1 2025, a 13% annual uptick, buoyed by 77-inch units falling below USD 3,000. Automotive OLED momentum is notable in Europe, where Mercedes-Benz, Audi, and BMW deploy both interior and exterior OLED modules, leveraging established tier-one supply chains. Apple’s all-OLED 2025 iPhone lineup further enlarges North American flexible panel pull-through.
The Middle East, though accounting for a small revenue base, is forecast to grow at 11.83% CAGR as Saudi Arabia’s NEOM and the UAE’s smart-city programs specify transparent and signage OLEDs for public infrastructure. South America and Africa trail with sub-10% penetration due to currency volatility and import tariffs that inflate retail prices. Hence, while traditional regions continue to dominate, targeted infrastructure deployments in the Gulf states provide a fresh spur to diversified geographic revenue.[3]“8.6-Generation Chengdu Plant Completion,” BOE Investor Relations, boe.com

Competitive Landscape
High concentration defines the OLED panel market, with LG Display leading large-format TVs and Samsung Display dominating premium smartphones. Chinese challengers BOE, CSOT, and Visionox collectively held more than half of global smartphone and IT OLED revenue in H1 2025, forcing incumbents to differentiate via tandem structures, LTPO backplanes, and exclusive automotive partnerships. Japan Display’s maskless eLEAP process carves out a premium niche in IT and cockpit displays through 2× brightness and 3× lifetime.
Universal Display Corporation sustains strong bargaining leverage by licensing red and green phosphorescent materials across the supply base, while pursuing the elusive blue phosphorescent breakthrough. Smaller vendors such as AU Optronics and Everdisplay lack the scale or R&D depth to compete, suggesting probable consolidation by 2028. As printed-OLED maturity reduces capex per substrate by 30%, Chinese fabs aim to undercut mid-tier pricing, prompting Korean suppliers to double down on high-margin, technology-rich applications in automotive, XR headsets, and ultra-large TVs.
Standardization via IEC 62341 and IEC 62868 lowers qualification barriers, permitting OEM multi-sourcing and sharpening price competition. Consequently, strategic success hinges on balancing cost reductions with rapid roll-out of lifetime-extending dual stacks, oxide backplanes, and material innovations that defend margins against mini-LED encroachment.
OLED Panel Industry Leaders
Samsung Display Co. Ltd
LG Display Co., Ltd
Sony Corporation
Pioneer Corporation
Raystar Optronics Inc.
- *Disclaimer: Major Players sorted in no particular order

Recent Industry Developments
- December 2025: TCL CSOT began piling work on its USD 4.1 billion 8.6-generation printed-OLED fab in Guangzhou, aiming for 22,500 substrates per month by H2 2027.
- October 2025: LG Display earmarked KRW 1.26 trillion (USD 917 million) for tandem-structure OLED expansion at its Paju campus, scheduled for completion by Jun 2027.
- June 2025: Samsung Display started mass producing 17-inch rollable OLED laptop panels for Lenovo’s ThinkBook Plus Gen 6, inaugurating commercial rollable IT displays.
- May 2025: LG Display installed transparent OLED signage in Seoul subway platforms for wayfinding and advertising, illustrating public-transport deployment at scale.


Global OLED Panel Market Report Scope
The OLED Panel Market Report is Segmented by Type (Flexible, Rigid, Transparent), Display Address Scheme (PMOLED Display, AMOLED Display), Size (Small-Sized, Medium-Sized, Large-Sized), Product (Mobile and Tablet, Television, Automotive, Wearable, Lighting Products, Healthcare Devices, Home Appliances), and Geography (North America, Europe, Asia-Pacific, Middle East, Africa, South America). The Market Forecasts are Provided in Terms of Value (USD).
| Flexible |
| Rigid |
| Transparent |
| PMOLED Display |
| AMOLED Display |
| Small-Sized OLED Panel |
| Medium-Sized OLED Panel |
| Large-Sized OLED Panel |
| Mobile and Tablet |
| Television |
| Automotive |
| Wearable |
| Lighting Products |
| Healthcare Devices |
| Home Appliances |
| North America | United States |
| Canada | |
| Mexico | |
| Europe | United Kingdom |
| Germany | |
| France | |
| Italy | |
| Rest of Europe | |
| Asia-Pacific | China |
| Japan | |
| India | |
| South Korea | |
| Rest of Asia | |
| Middle East | Israel |
| Saudi Arabia | |
| United Arab Emirates | |
| Turkey | |
| Rest of Middle East | |
| Africa | South Africa |
| Egypt | |
| Rest of Africa | |
| South America | Brazil |
| Argentina | |
| Rest of South America |
| By Type | Flexible | |
| Rigid | ||
| Transparent | ||
| By Display Address Scheme | PMOLED Display | |
| AMOLED Display | ||
| By Size | Small-Sized OLED Panel | |
| Medium-Sized OLED Panel | ||
| Large-Sized OLED Panel | ||
| By Product | Mobile and Tablet | |
| Television | ||
| Automotive | ||
| Wearable | ||
| Lighting Products | ||
| Healthcare Devices | ||
| Home Appliances | ||
| By Geography | North America | United States |
| Canada | ||
| Mexico | ||
| Europe | United Kingdom | |
| Germany | ||
| France | ||
| Italy | ||
| Rest of Europe | ||
| Asia-Pacific | China | |
| Japan | ||
| India | ||
| South Korea | ||
| Rest of Asia | ||
| Middle East | Israel | |
| Saudi Arabia | ||
| United Arab Emirates | ||
| Turkey | ||
| Rest of Middle East | ||
| Africa | South Africa | |
| Egypt | ||
| Rest of Africa | ||
| South America | Brazil | |
| Argentina | ||
| Rest of South America | ||


Key Questions Answered in the Report
How fast is global demand for OLED television screens growing?
Ultra-large 70-inch-plus OLED TV shipments climbed 41% year over year in the first half of 2025, pushing large-format panel revenue toward an 11.91% CAGR through 2031.
What is the OLED panel market size?
The OLED panel market size was valued at USD 58.44 billion in 2025 and is estimated to reach USD 107.63 billion by 2031,
Which region will contribute the most incremental OLED panel capacity by 2027?
Asia Pacific, driven by BOE and CSOT’s new Gen-8/9 fabs adding more than 54,000 substrates per month of flexible and printed OLED throughput.
Why is automotive demand the fastest-rising OLED application?
Automakers value OLED’s curved, free-form design freedom, and its ability to integrate wide dashboards and transparent A-pillar modules, resulting in an 11.43% CAGR forecast to 2031.
How are material innovations addressing OLED lifetime challenges?
Tandem-stack architectures and research into blue phosphorescent emitters aim to extend panel lifetimes beyond 30,000 hours, enabling 10-year warranties for large TVs and automotive displays.
Page last updated on:


