
Oil And Gas Water Management Services Market Size and Share
Market Overview
| Study Period | 2021 - 2031 |
|---|---|
| Market Size (2026) | USD 19.35 Billion |
| Market Size (2031) | USD 22.07 Billion |
| Growth Rate (2026 - 2031) | 2.67 % |
| Fastest Growing Market | Asia Pacific |
| Largest Market | North America |
| Market Concentration | Medium |
Major Players *Disclaimer: Major Players sorted in no particular order Image © Mordor Intelligence. Reuse requires attribution under CC BY 4.0. | |
Oil And Gas Water Management Services Market Analysis by Mordor Intelligence
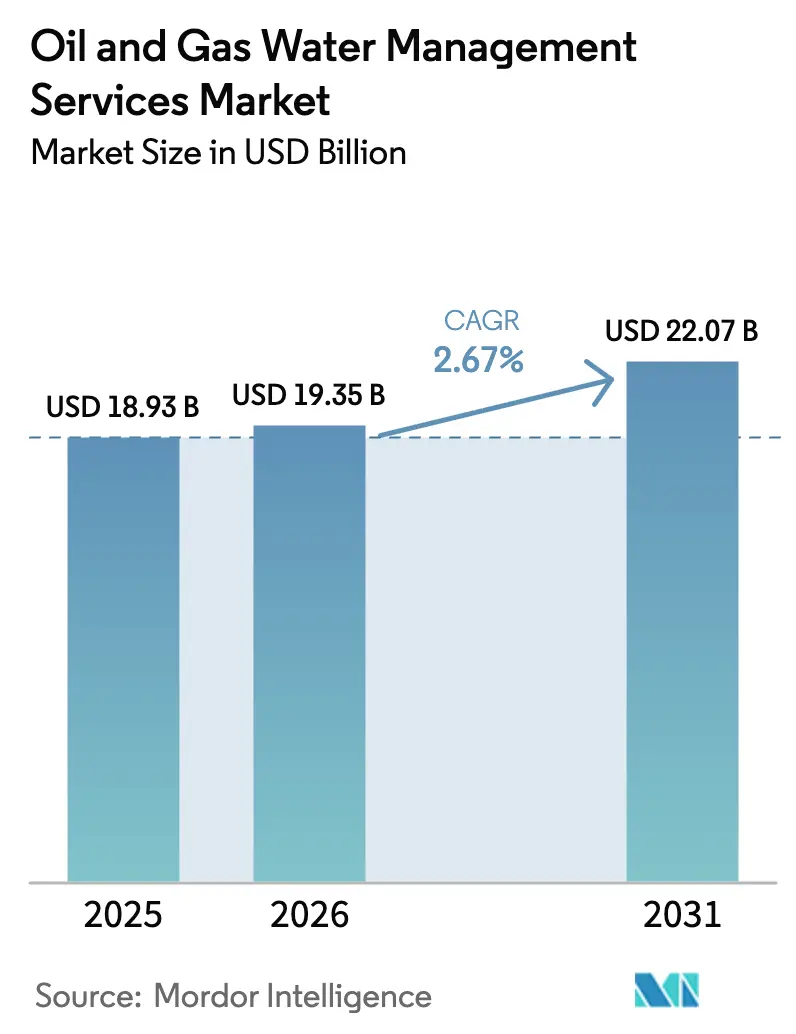
The Oil And Gas Water Management Services Market size is estimated at USD 19.35 billion in 2026, and is expected to reach USD 22.07 billion by 2031, at a CAGR of 2.67% during the forecast period (2026-2031).
The Oil & Gas Water Management Services market is moving from volume-based disposal toward treatment-and-reuse models as operators react to stricter discharge rules, water scarcity in shale basins, and ESG-linked financing incentives. Membrane costs fell 18% between 2024 and 2025, allowing advanced reverse-osmosis and nanofiltration units to displace legacy physical separators in the Oil & Gas Water Management Services market.[1] Produced water already contributes 47.5% of total handled volumes, and flowback water is expanding at 5.8% annually, underscoring the reliance on unconventional drilling even as well designs become more efficient in the Oil & Gas Water Management Services market.[2] Deepwater projects in Brazil and West Africa, where salinity frequently exceeds 200,000 mg/L, are catalyzing offshore demand for high-specification desalination systems, further diversifying revenue streams for the Oil & Gas Water Management Services market.[3]
Key Report Takeaways
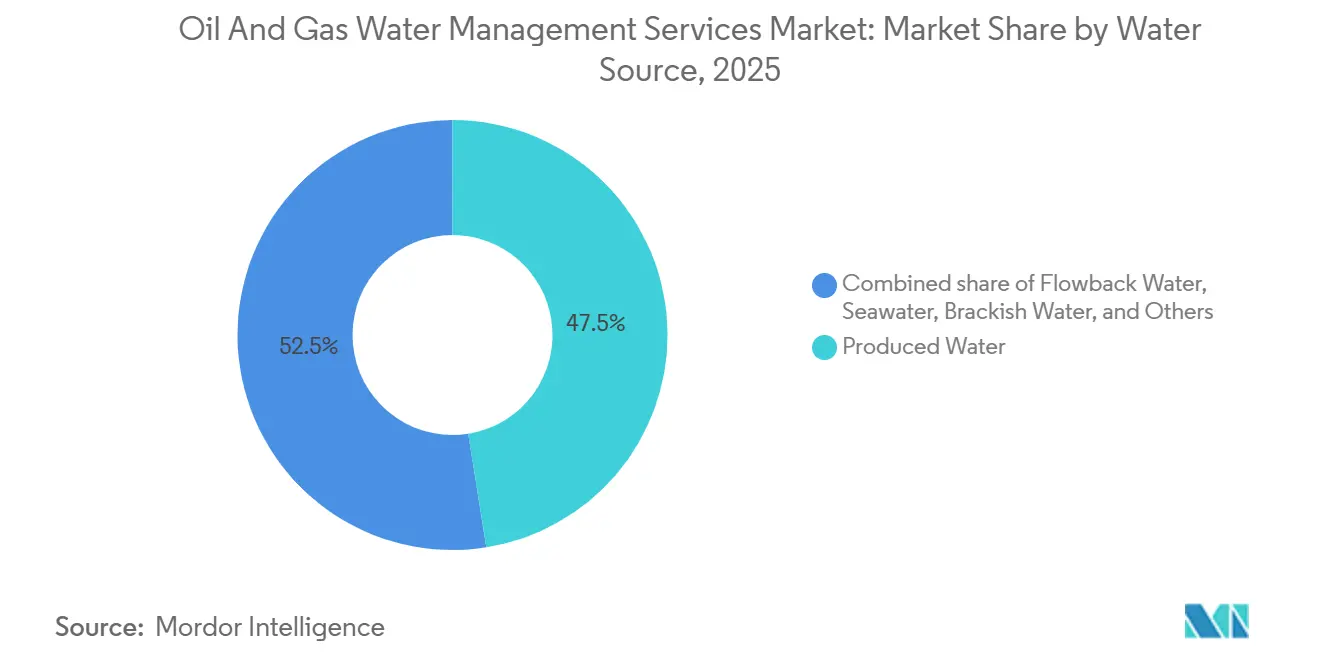
- By water source, produced water held 47.5% of the Oil & Gas Water Management Services market share in 2025, while flowback water is forecast to post the fastest 5.8% CAGR through 2031.
- By treatment technology, membrane filtration captured 35.1% revenue share in 2025, and is the fastest-growing category at a 3.2% CAGR during 2026-2031.
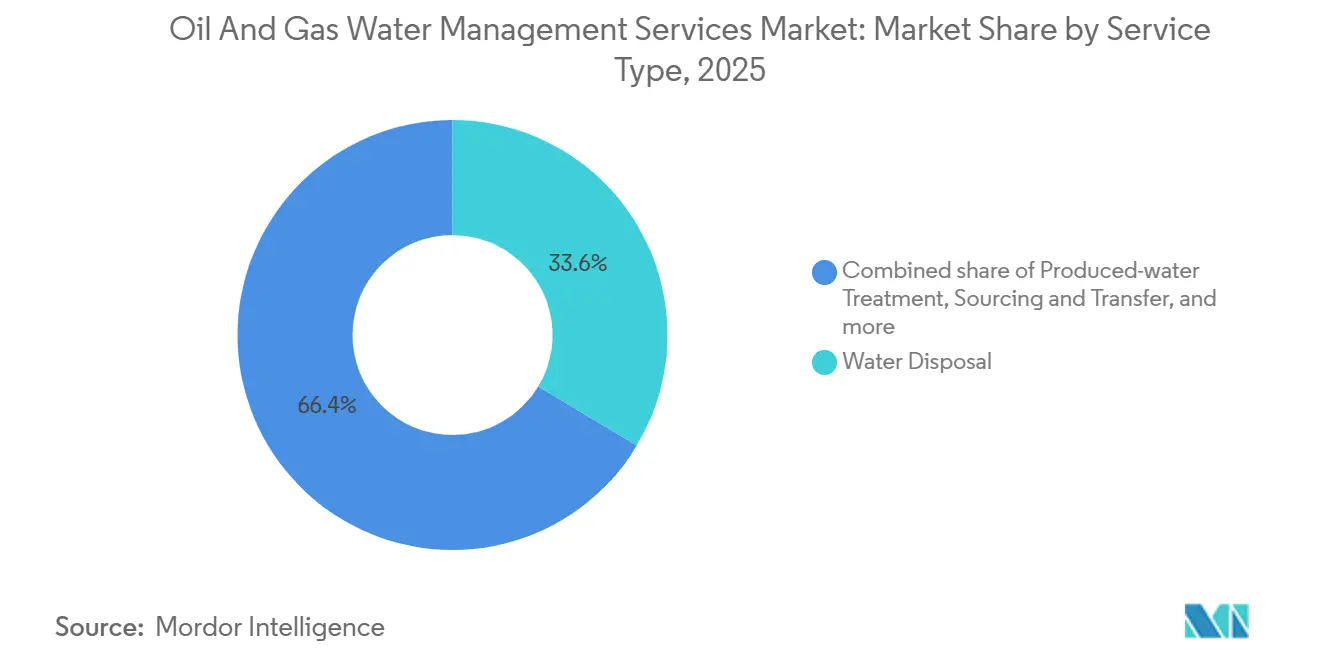
- By service type, water disposal accounted for 33.6% of the Oil & Gas Water Management Services market size in 2025, whereas produced-water treatment is projected to expand at a 3.7% CAGR to 2031.
- By location, onshore operations generated 65.9% revenue in 2025; offshore services are advancing at a 3.9% CAGR on the back of deepwater developments.
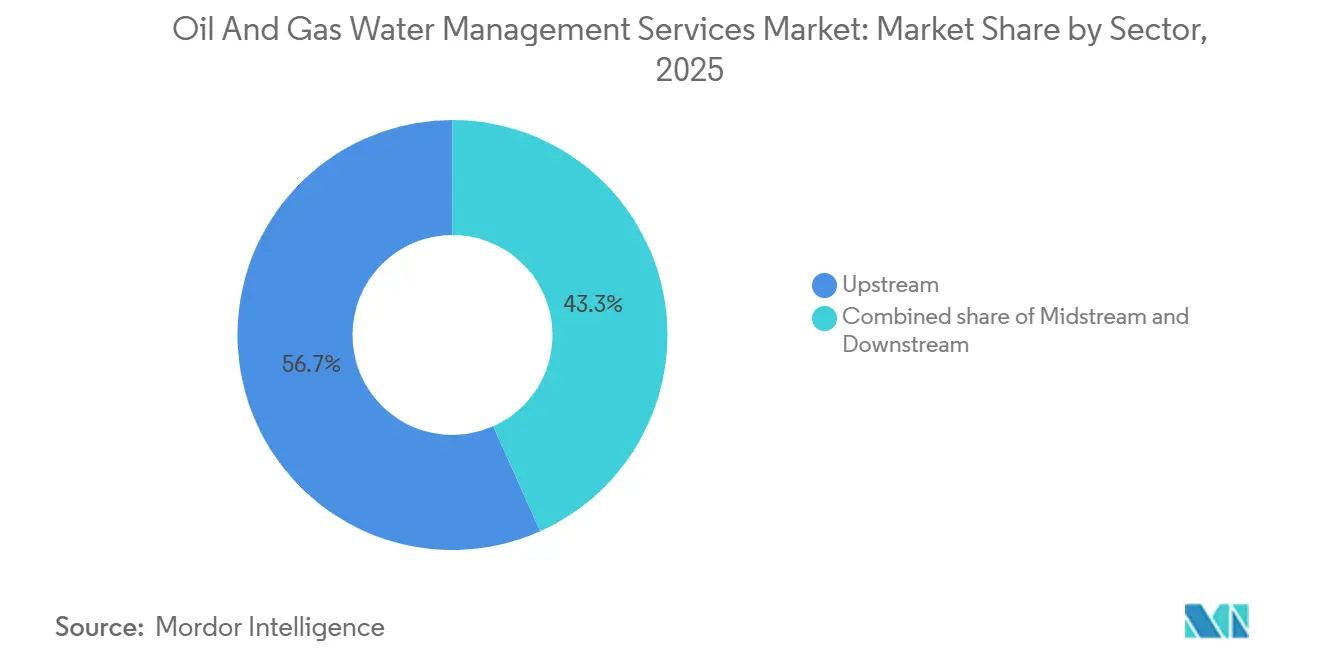
- By sector, the upstream segment commanded 56.7% of demand in 2025 and is expected to maintain a 3.0% CAGR through 2031.
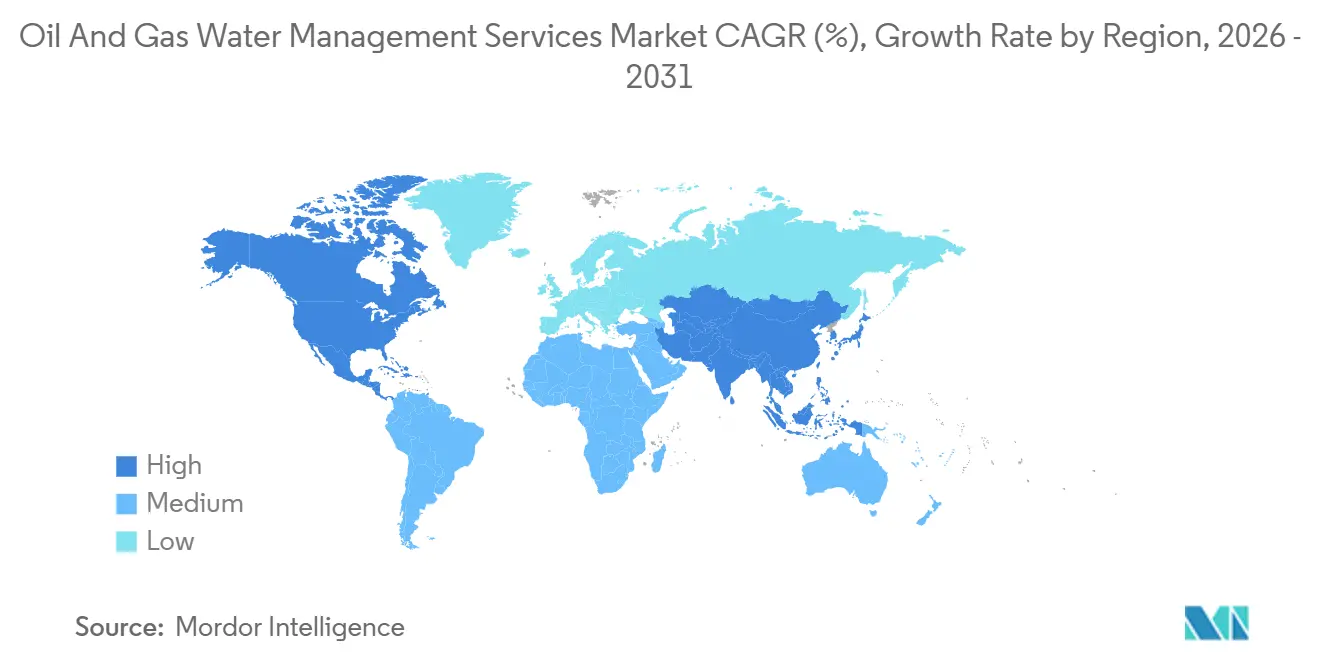
- By geography, North America led with 39.4% in 2025, while Asia-Pacific is set to advance at a 4.1% CAGR to 2031.
Note: Market size and forecast figures in this report are generated using Mordor Intelligence’s proprietary estimation framework, updated with the latest available data and insights as of January 2026.
Market Trends and Insights
Drivers Impact Analysis of Oil And Gas Water Management Services Market*
| Driver | (~) % Impact on CAGR Forecast | Geographic Relevance | Impact Timeline |
|---|---|---|---|
| Produced-water surge from shale & tight formations | +0.9% | North America core, spillover to Argentina Vaca Muerta and China Sichuan | Medium term (2-4 years) |
| Stricter discharge & injection regulations | +0.7% | Global, with acute pressure in EU, California, and ASEAN coastal zones | Long term (≥ 4 years) |
| Water-stress pushing reuse & recycling mandates | +0.6% | North America Permian, Middle East onshore, India offshore | Medium term (2-4 years) |
| Digital water-operations platforms enable real-time optimization | +0.4% | Global, early adoption in North America and Norway | Short term (≤ 2 years) |
| Mobile "plug-and-play" treatment units for remote basins | +0.3% | North America unconventional plays, Argentina, Australia Cooper Basin | Short term (≤ 2 years) |
| ESG-linked financing rewarding high-efficiency water programs | +0.3% | Global, concentrated in North America and Europe with ESG-focused capital markets | Medium term (2-4 years) |
| Source: Mordor Intelligence | |||
Produced-Water Surge From Shale & Tight Formations
Unconventional extraction generated 25 billion barrels of produced water in North America during 2025, up 14% year-on-year, as extended laterals and high-intensity completions became standard practice.[4] Permian volumes reached 11 billion barrels with water-to-oil ratios climbing to 6:1, lifting logistics costs to USD 0.85 per barrel and pushing operators toward centralized treatment hubs able to process 150,000 barrels per day, cutting transport expenses 40%. Argentina’s Vaca Muerta followed a similar trajectory, posting daily produced-water volumes above 80,000 barrels that now require new pipeline corridors. China’s Sichuan shale-gas plays added chemistry-specific hurdles, with H₂S concentrations exceeding 200 ppm, raising treatment costs by USD 0.30 per barrel. The interplay of rising volumes and challenging water chemistries is steering the Oil & Gas Water Management Services market toward modular, scalable systems that can grow alongside production.
Stricter Discharge & Injection Regulations
The U.S. EPA’s 2025 update to Underground Injection Control rules imposed quarterly seismic monitoring within 10 km of fault zones, affecting roughly 1,200 wells and accelerating demand for produced-water treatment across Oklahoma, Texas, and Kansas. California introduced a 10 mg/L total-nitrogen cap for offshore discharge, effectively eliminating direct ocean disposal without advanced biological polishing. The European Union capped BTEX concentrations at 0.1 mg/L, rendering legacy hydrocyclones insufficient for compliance. Norway recorded 14 non-compliance cases in 2024, prompting retrofits with ultrafiltration modules. This escalating regulatory stringency shortens compliance windows and channels spending toward service providers with proven performance records, thereby reshaping competitive dynamics inside the Oil & Gas Water Management Services market.
Water Stress Pushing Reuse & Recycling Mandates
Freshwater availability in Midland and Delaware counties fell to 60% of historical averages in 2025, driving operators to recycle up to 70% of completion fluid at costs nearly 46% lower than sourcing brackish groundwater. Saudi Aramco’s Ghawar field recycled 95% of produced water, saving USD 22 million in desalination energy. India barred freshwater withdrawal for Krishna-Godavari offshore drilling beginning January 2025, pushing operators to install shipboard reverse-osmosis units. As mandates proliferate, the Oil & Gas Water Management Services market is pivoting toward high-recovery membranes and evaporation systems capable of achieving zero-liquid-discharge in water-scarce basins.
Digital Water-Operations Platforms Enable Real-Time Optimization
Schlumberger’s DELFI platform integrated water modules at 42 sites in 2025, trimming chemical dosing by 18% and extending membrane life by nine months. Baker Hughes added edge sensors to 320 hydrocyclone units, reducing downtime by 26% through predictive maintenance. Veolia’s Hubgrade center remotely monitors 1,100 produced-water plants and has lowered electricity costs by USD 0.08 per barrel at early deployments. These productivity gains tilt competitive advantage toward firms able to bundle treatment hardware with analytics, a trend accelerating consolidation inside the Oil & Gas Water Management Services market.
Restraints Impact Analysis of Oil And Gas Water Management Services Market*
| Restraint | (~) % Impact on CAGR Forecast | Geographic Relevance | Impact Timeline |
|---|---|---|---|
| High logistics & disposal costs in low-margin wells | -0.5% | North America mature fields, onshore Middle East stripper wells | Short term (≤ 2 years) |
| Oil-price volatility delaying water-infrastructure CAPEX | -0.4% | Global, acute in North America shale and Latin America | Medium term (2-4 years) |
| Fragmented basin-level water-quality specifications | -0.2% | North America state-by-state variance, EU member-state differences | Long term (≥ 4 years) |
| Uncertain permitting outlook for Class II disposal wells | -0.2% | North America (Oklahoma, Texas, Kansas seismic zones), select EU jurisdictions | Medium term (2-4 years) |
| Source: Mordor Intelligence | |||
High Logistics & Disposal Costs in Low-Margin Wells
Hauling produced water from remote Bakken wellheads cost USD 1.10 per barrel in 2025, consuming 22% of netbacks when oil traded near USD 70/bbl. Stripper wells generating high water cuts saw 1,800 temporary shut-ins in Texas and New Mexico as water-handling expenses eclipsed revenue. Pipeline transport can lower costs to USD 0.25 per barrel once daily volumes exceed 50,000 barrels, but multiyear construction timelines deter investment in declining fields. Offshore, aging Gulf of Mexico platforms barge produced water to shore at USD 2.50 per barrel due to deck-space constraints, eroding project economics when gas prices stay below USD 3/MMBtu. These structural cost pressures partly offset growth momentum in the Oil & Gas Water Management Services market.
Oil-Price Volatility Delaying Water-Infrastructure CAPEX
Brent crude’s USD 68-87/bbl range in 2025 caused the deferral of 14 large treatment projects worth USD 1.8 billion. Evaporation-crystallization systems, requiring USD 15-40 million upfront, saw order volumes drop 30% year-on-year. Operators favored short-term hauling contracts over multiyear treatment agreements, sacrificing the 25-35% life-cycle savings achievable with integrated water strategies. In Latin America, currency swings and shifting tax regimes delayed six Vaca Muerta recycling hubs and three Brazilian offshore zero-discharge projects. The stop-start investment cadence extends lead times and inflates financing costs, modestly tempering the outlook for the Oil & Gas Water Management Services market.
*Our forecasts treat driver/restraint impacts as directional, not additive. The impact forecasts reflect baseline growth, mix effects, and variable interactions.
Oil And Gas Water Management Services Market Segment Analysis
By Water Source:
Produced Water Maintains LeadProduced water accounted for 47.5% of handled volumes in 2025, reflecting the maturity of unconventional reservoirs and rising water-to-hydrocarbon ratios. Flowback water is expanding 5.8% annually, supported by longer laterals and higher proppant loads that generate 40% more flowback per well than 2023 designs. Seawater dominates offshore pressure-maintenance schemes, such as Johan Sverdrup’s 420,000-barrel-per-day intake that employs electrochlorination to prevent biofouling. Brackish and make-up sources are losing share as operators substitute recycled volumes, a shift accelerated by groundwater permit caps in Texas and New Mexico.
Mobile filtration is opening new revenue pools inside the Oil & Gas Water Management Services market. Baker Hughes rolled out a trailer-mounted ultrafiltration unit in 2025 that processes 15,000 barrels per day and relocates within 36 hours, ideal for short-lived flowback peaks. Produced water’s high salinity, averaging 180,000 mg/L in the Permian, requires multi-stage treatment, whereas flowback can often be polished by single-pass reverse osmosis. This divergence is segmenting service strategies: integrated providers chase long-term produced-water contracts while niche haulers target mobile flowback work. As recycled volumes rise, the Oil & Gas Water Management Services market will increasingly differentiate solutions by water chemistry, not just source.

By Treatment Technology:
Membranes Strengthen PositionMembrane filtration captured 35.1% of spending in 2025 and is forecast to grow at 3.2% a year through 2031. Reverse-osmosis module prices fell 18% year-on-year, and energy consumption per barrel dropped 12% after the deployment of high-efficiency pressure exchangers. Physical separation remains the first-stage workhorse at 68% of onshore sites, but is now frequently paired with membrane polishing to meet discharge limits below 30 mg/L total suspended solids. Chemical pretreatment evolved as well; Veolia’s new coagulant cut dosing 25% while removing 95% of oil and grease.
Evaporation and crystallization systems are gaining ground where zero-liquid-discharge mandates prevail, although capital intensity slows uptake. Aquatech’s 20,000-barrel-per-day brine concentrator in the Marcellus became operational in 2025, transforming brine into industrial salt. Biological processes remain niche due to salinity constraints. The technology mix underscores the Oil & Gas Water Management Services market trend toward hybrid treatment trains, combining physical, chemical, and membrane steps to balance cost and compliance.
By Service Type:
Treatment Advances on DisposalDisposal still generated 33.6% of revenue in 2025 due to the prevalence of Class II injection wells, yet produced-water treatment is rising at a 3.7% CAGR as reuse economics improve. Permian operators recycled 4.8 billion barrels in 2025, saving USD 1.4 billion in freshwater costs. Hauling remains essential for remote wells; Select Energy Services ran 1,850 vacuum trucks, averaging 180 loads per month. Sourcing and transfer infrastructure is booming; WaterBridge’s 420-mile pipeline network moved 310,000 barrels per day in 2025, offering 15-year contracted cash flows.
Economics hinge on local geology: disposal costs average USD 0.40 per barrel in the Anadarko Basin, discouraging treatment, while California’s disposal ban pushes treatment rates to USD 2.80 per barrel. Fountain Quail’s integrated hauling-plus-treatment packages bridge the transition until pipelines become viable. The Oil & Gas Water Management Services industry is thus shifting from transactional disposal to asset-backed, lifecycle water solutions.
By Location:
Onshore Scale, Offshore ComplexityOnshore operations accounted for 65.9% of 2025 revenue, propelled by North American shale well counts. Centralized Permian hubs treat up to 200,000 barrels daily, achieving per-barrel costs 60% below distributed systems. Offshore growth at 3.9% CAGR reflects deepwater projects where salinity and hydrocarbon content are extreme. Brazil’s Mero field, online in 2024, generates water with 220,000 mg/L TDS and 1,800 mg/L oil, requiring shipboard electro-coagulation and centrifugation.
Offshore constraints, weight, power, and safety favor compact solutions like Aker’s 40 m² ultrafiltration modules. Veolia’s subsea injection pilot in 2025 removed topside treatment entirely, cutting operating costs by 40%. As offshore complexity escalates, the Oil & Gas Water Management Services market bifurcates: onshore providers optimize throughput, offshore specialists engineer for reliability within tight footprints.
By Sector:
Upstream Dominance EnduresUpstream activities generated 56.7% of demand in 2025 and remain on a 3.0% CAGR trajectory. Water cuts in the Bakken hit 78% as older wells mature, increasing water-handling spend. Saudi Aramco’s Ghawar field now produces six barrels of water per barrel of oil, underpinning continued infrastructure expansion. Midstream and downstream volumes are comparatively modest: Enbridge treated 14 million barrels of dehydration water in 2025, dwarfed by upstream flows.
Closed-loop cooling and zero-discharge systems are spreading through refineries, yet these upgrades are driven by municipal water scarcity rather than hydrocarbon production. Consequently, the Oil & Gas Water Management Services market will remain upstream-centric, with midstream and downstream segments offering niche but stable revenue opportunities.
Geography Analysis
North America Oil and Gas Water Management Services Market
North America delivered 39.4% of global revenue in 2025, driven by the Permian Basin’s 35 million-barrel-per-day produced-water stream. Reuse rates are rising as ESG pressure mounts, aided by an extensive network of 180,000 Class II wells that still offer a disposal safety valve. Canada faces emulsified-bitumen challenges that add USD 0.50 per barrel in pretreatment costs. Mexico awarded four modernization contracts in 2025 to improve offshore water systems.
APAC Oil and Gas Water Management Services Market
Asia-Pacific is the fastest-growing region at a 4.1% CAGR. Sichuan shale-gas output generated 28 million barrels of produced water in 2025, all subject to 15 mg/L total-nitrogen limits before discharge to the Yangtze watershed. India’s ONGC ordered three 80,000-barrel-per-day offshore treatment platforms to meet zero-discharge mandates. Indonesia and Malaysia commissioned floating treatment barges, while Australia piloted solar-powered evaporation ponds that cut energy costs by 35%.
EMEA and South America Oil and Gas Water Management Services Market
The Middle East and Africa emphasize large-scale recycling projects, exemplified by Khurais’ 400,000-barrel-per-day plant, which reduces seawater intake by 22%. Nigeria’s Agbami FPSO installed a hybrid power system to keep ultrafiltration modules online despite grid unreliability. South America’s pre-salt fields require subsea separation and injection to free deck space. Europe’s North Sea retrofits compact systems to extend platform life by up to five years. These regional nuances confirm that the Oil & Gas Water Management Services market must tailor solutions to local resource, regulation, and infrastructure contexts.
Regulatory Landscape
Regulation is increasingly pushing oil and gas water management from disposal-oriented compliance toward treatment, recycling, and, in some jurisdictions, tightly controlled beneficial reuse. In the United States, the EPA advanced reuse-focused policy signals in 2026 through Water Reuse Action Plan (WRAP) 2.0 and also moved forward on offshore compliance via proposed updates to the Gulf of America NPDES general permit (GMG290000) in January 2026, reinforcing tighter discharge oversight and documentation expectations for offshore operators and their service providers.
At the state level, rules are diverging and adding basin-by-basin permitting complexity. Texas implemented new Railroad Commission waste-management rules under 16 TAC Chapter 4 effective July 1, 2025, and Texas S.B. 1145 shifted land-application permitting authority for treated produced water from the Railroad Commission to the Texas Commission on Environmental Quality (TCEQ) effective September 2025. In 2026, TCEQ proceeded with proposed rules to define a permit pathway for land application. In New Mexico, the Water Quality Control Commission advanced petition WQCC 26-18 in May 2026 to amend produced-water reuse rules, re-opening debate on off-oilfield reuse and increasing compliance variability for multi-state operators.
Competitive Landscape
Top Companies in Oil and Gas Water Management Services Market
The Oil & Gas Water Management Services market is moderately fragmented; the top 10 players hold close to 48% of 2025 revenue. Integrated oilfield-service majors such as Schlumberger, Halliburton, and Baker Hughes bundle logistics, treatment, and digital monitoring, a strategy attractive to supermajors but cost-intensive for independents. Midstream water specialists such as WaterBridge and Solaris secure long-term contracts that lock in pipeline throughput and deter greenfield entry by capital-constrained rivals.
Environmental-services leaders Veolia and SUEZ differentiate through proprietary membranes and centralized remote-operations centers, targeting jurisdictions with stringent discharge caps. White-space opportunities cluster around mobile treatment, zero-liquid-discharge, and subsea injection. Baker Hughes’ trailer-mounted units, Aquatech’s crystallizers, and Veolia’s subsea system each address these niches, respectively. Firms that master real-time analytics and predictive maintenance are winning disproportionate share, while legacy haulers relying on manual dispatch are losing ground.
Oil And Gas Water Management Services Industry Leaders
-
Halliburton Company
-
Baker Hughes Co.
-
Schlumberger Ltd.
-
Veolia Environnement SA
-
Select Energy Services Inc.
- *Disclaimer: Major Players sorted in no particular order

Oil And Gas Water Management Services Market Companies Covered in this Report
- Aquatech International LLC
- Baker Hughes Company
- Granite Construction Inc.
- Halliburton Company
- Nuverra Environmental Solutions
- Ovivo Inc.
- Schlumberger Limited
- Severn Trent Services Ltd.
- Veolia Environnement SA
- Select Energy Services Inc.
- SUEZ SA
- TETRA Technologies Inc.
- WaterBridge Holdings LLC
- XRI Holdings (XRI Water)
- Fountain Quail Energy Services
- Solaris Water Midstream LLC
- TechKem Water Technologies
- Helix Water Solutions
- Hydrozonix LLC
- Cudd Energy Services
Market Opportunities and Future Outlook
A whitespace is forming around scalable treatment-and-reuse models that reduce reliance on Class II disposal, particularly in basins where seismic scrutiny and trucking costs are higher. Corporate pilots in the Permian reflect this shift: Western Midstream announced the start-up of a second produced-water treatment pilot (JIP 2) in June 2026 near the Red Bluff Reservoir in Reeves County, Texas, designed to receive 2,000 bpd and produce 1,000 bpd of reclaimed freshwater. This supports an operating template for centralized treatment tied to midstream water infrastructure.
Resource recovery from produced water is also expanding the service scope beyond recycling into commercial products, bringing in new partners and contract structures. Select Water Solutions announced produced-water-based critical-mineral initiatives in 2026, including a lithium carbonate buildout with LibertyStream Infrastructure Partners (with a first 1,000-tonne unit slated for commissioning by December 2026) and a definitive agreement with ISE Chemicals to develop commercial iodine production facilities using Select's produced-water infrastructure across Texas, New Mexico, and Oklahoma. Alongside regulatory process work in Texas (TCEQ rulemaking tied to SB 1145) and contested but active rulemaking in New Mexico (WQCC 26-18), this is creating room for providers that can document contaminant controls, deliver fit-for-purpose reclaimed water, and manage multi-jurisdiction permitting for off-lease reuse applications.
Recent Industry Developments in Oil And Gas Water Management Services Market
- June 2026: Select Water Solutions entered into a definitive agreement with ISE Chemicals Corporation to develop commercial-scale iodine extraction and refining facilities utilizing produced water sourced through Select's infrastructure in Texas, New Mexico, and Oklahoma. The agreement pushes produced-water programs beyond disposal and recycling into resource recovery, widening the addressable service mix and improving economics for water infrastructure utilization.
- June 2026: Western Midstream announced the start-up of its second produced-water treatment pilot facility (JIP 2) near the Red Bluff Reservoir in Reeves County, Texas, designed to receive 2,000 barrels per day of produced water. The pilot provides a practical reference point for centralized treatment connected to midstream water networks, supporting operator efforts to reduce freshwater sourcing and limit trucking.
- May 2025: Veolia secured USD 750 million in new flagship contracts for water technologies across energy and semiconductors, including complete water treatment solutions for injection into FPSO units in Brazil and the United Arab Emirates, with equipment deliveries beginning from mid-2026. The awards reinforce demand for higher-spec water treatment in offshore and complex operating environments, supporting providers with proven technology and delivery capacity.
Oil And Gas Water Management Services Market Report Scope and Research Methodology
Market Definition and Coverage
This market covers services used to manage oil and gas water streams, starting from sourcing and transport and moving through treatment, recycling, storage, and final disposal. It includes produced water, flowback water, and other wastewater generated during drilling, completion, production, and refining.
Scope exclusions: We exclude sales of standalone equipment and chemicals when they are not priced and delivered as part of a defined water management service contract.
Segments Covered in This Report
- By Water Source
- Produced Water
- Flowback Water
- Seawater
- Brackish/Make-Up Water
- Others
- By Treatment Technology
- Physical Separation (Hydro-cyclones, etc.)
- Membrane Filtration (RO, NF, UF)
- Chemical Treatment (Coagulation, Oxidation)
- Evaporation and Crystallization
- Biological Treatment
- By Service Type
- Water Disposal
- Water Hauling
- Produced-water Treatment
- Sourcing and Transfer
- Others
- By Location
- Onshore
- Offshore
- By Sector
- Upstream
- Midstream
- Downstream
- By Geography
- North America
- United States
- Canada
- Mexico
- Europe
- Norway
- United Kingdom
- Russia
- Netherlands
- Germany
- Rest of Europe
- Asia-Pacific
- China
- India
- Japan
- South Korea
- ASEAN Countries
- Australia and New Zealand
- Rest of Asia-Pacific
- South America
- Brazil
- Argentina
- Colombia
- Rest of South America
- Middle East and Africa
- Saudi Arabia
- United Arab Emirates
- Iran
- Nigeria
- South Africa
- Rest of Middle East and Africa
- North America
Data Sources, Market Sizing, and Validation
Desk Research
Desk research helped set the market boundaries and assemble consistent activity and water indicators that can be tracked across regions. We referenced public sources such as the US Energy Information Administration for upstream and refining context, the US Environmental Protection Agency for wastewater and disposal related rules, and the US Geological Survey for water supply and quality context. In key producing areas, we also reviewed state level regulator disclosures (for example Texas RRC and North Dakota DMR) to understand produced water reporting patterns and disposal activity.
To complete the picture, we used company filings and investor materials to identify service mix, contract language, and geographic exposure, then converted those into inputs for pricing and utilization checks. Where needed, paid subscriptions supported company financials, patent searches, and shipment-level import and export signals that align with treatment and handling infrastructure. The sources listed above are illustrative only, and many other public documents were also used for data collection, cross checks, and research clarification.
Primary Interviews and Surveys
Primary work focused on expert interviews and short surveys with water management service providers, E&P and midstream operations teams, disposal and recycling specialists, and engineering consultants who track produced water handling. We covered APAC, EMEA, and the Americas so local regulation, disposal constraints, and reuse economics could be compared, then assumptions were adjusted until they matched how services are delivered and priced in real contract terms.
Distribution of primary research fieldwork respondents
| Company type | Respondent position | Region |
|---|---|---|
| Top tier: 31% | CXOs: 16% | APAC: 41% |
| Mid tier: 48% | Functional/Unit leaders: 38% | EMEA: 34% |
| Smaller Players: 21% | Managers: 46% | Americas: 25% |
Market-Sizing & Forecasting
Market sizing started with a top-down approach where drilling and production activity indicators are used to reconstruct the addressable water handling pool by region, and then serviceable shares are applied based on typical operating practices. To keep the model repeatable, the inputs emphasize a short list of trackable variables, such as drilled and completed well counts, produced water and flowback volumes, disposal well capacity and utilization signals, recycling and reuse penetration, and typical service pricing per barrel for transport, treatment, and disposal.
Those totals were then corroborated using selective bottom-up approximations, mainly through roll ups of sampled service revenue disclosures and channel checks on price times volume for representative basins and service lines, before final numbers were adjusted. When a country has weak public reporting on produced water, gaps were handled using analog basins with similar well productivity and water cuts, followed by expert review to avoid overstating demand. Forecasting was completed using scenario analysis supported by a light multivariate regression, where drivers like drilling activity, water cut trends, disposal permitting friction, and reuse targets are linked to service demand, and then expert consensus is used to select realistic ranges.
Data Validation & Update Cycle
Validation was done in steps so the final outputs stay tied to observable market signals. Model results were compared with independent indicators such as implied water volumes, disposal capacity use, and service pricing outcomes, and any large variance triggered a recheck of the input series and regional mix. Outliers were reviewed by a second analyst, and then an internal review confirmed that units, time periods, and currency treatment stayed consistent throughout the workbook.
This report is refreshed annually, and interim updates are made when material events occur, such as major regulatory changes, sharp drilling swings, or disposal constraints in large basins. Before delivery, a final analyst pass is completed so the current year view reflects the latest public releases and recent feedback from industry discussions.
Mordor Intelligence's Oil Gas Water Management Services Market Size Compared Against Other Published Estimates
Published market sizes for oil and gas water management services often differ because the service basket, the base year, and the activity signals used to anchor demand are not consistent across sources. Differences also show up when one estimate is tied to produced water volumes while another leans more on broad oilfield services spending or supplier revenue narratives.
The main gap comes from whether transport and storage tied to produced water logistics are counted as water management services, where Mordor Intelligence includes these items only when they are delivered under a defined service contract linked to handled volumes and disposal or reuse outcomes. Base year timing also matters in this market because drilling programs, disposal capacity constraints, and per barrel pricing can shift quickly, which then changes revenue totals even if water volumes move slowly.
Benchmark comparison
| Source | Market Size | Gaps in Research Methodology |
|---|---|---|
| Mordor Intelligence | USD 19.35 B (2026) | |
| Global Publisher A | USD 21.79 B (2024) | Uses an earlier base year, and scope language can blend wider oilfield water activity into the total, so later shifts in disposal constraints and contract pricing are not fully reflected. |
| Industry Publisher B | USD 20.79 B (2024) | Applies a faster growth path based on an integrated services scope, which can assume quicker scaling of recycling and higher per barrel pricing without consistent basin-level utilization checks. |
Across the three figures, the spread is explained more by scope alignment and base year timing than by calculation technique alone. When the service lines are mapped to clear water volume drivers and then reviewed against capacity and pricing reality checks, the result becomes easier to trace and more stable for planning decisions.
Key Questions Answered in the Report
How large is the Oil and Gas Water Management Services market in 2026?
The Oil and Gas Water Management Services market size stood at USD 19.35 billion in 2026 and is projected to reach USD 22.07 billion by 2031, registering a CAGR of 2.67% during 2026-2031.
Which treatment technology is gaining share the fastest?
Membrane filtration is the fastest-growing technology, expanding at a 3.2% CAGR as reverse-osmosis and nanofiltration costs decline.
Why is produced-water treatment outpacing disposal growth?
Tightening discharge rules, ESG financing incentives, and rising disposal-well seismic scrutiny make treatment and reuse more economical in several basins.
Which region offers the highest growth potential through 2031?
Asia-Pacific leads with a projected 4.1% CAGR, driven by China's Sichuan shale gas and India's offshore developments under zero-discharge mandates.
What is the competitive advantage of digital water-management platforms?
Real-time monitoring and predictive maintenance reduce chemical use by up to 18% and downtime by 26%, delivering measurable cost savings for operators.
How does oil-price volatility influence investment in water infrastructure?
Price swings defer capital-intensive projects such as crystallizers, pushing operators toward short-term hauling contracts despite higher operating costs over time.