Pipeline Services Market Size and Share
Market Overview
| Study Period | 2021 - 2031 |
|---|---|
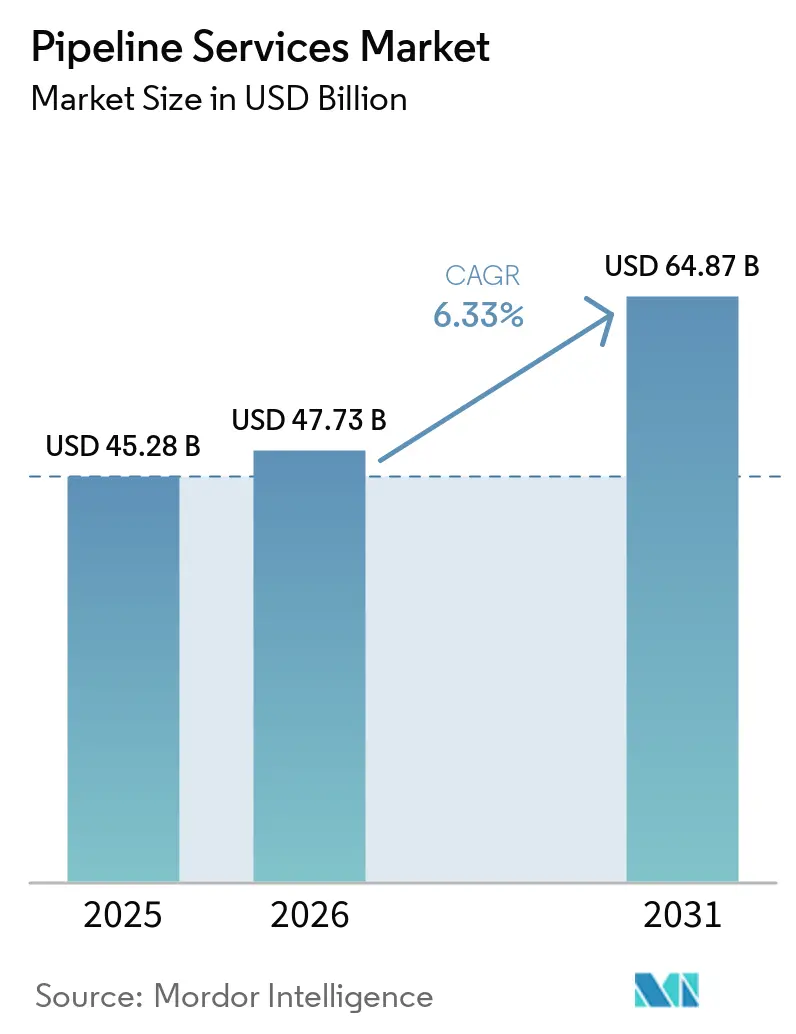
| Market Size (2026) | USD 47.73 Billion |
| Market Size (2031) | USD 64.87 Billion |
| Growth Rate (2026 - 2031) | 6.33% CAGR |
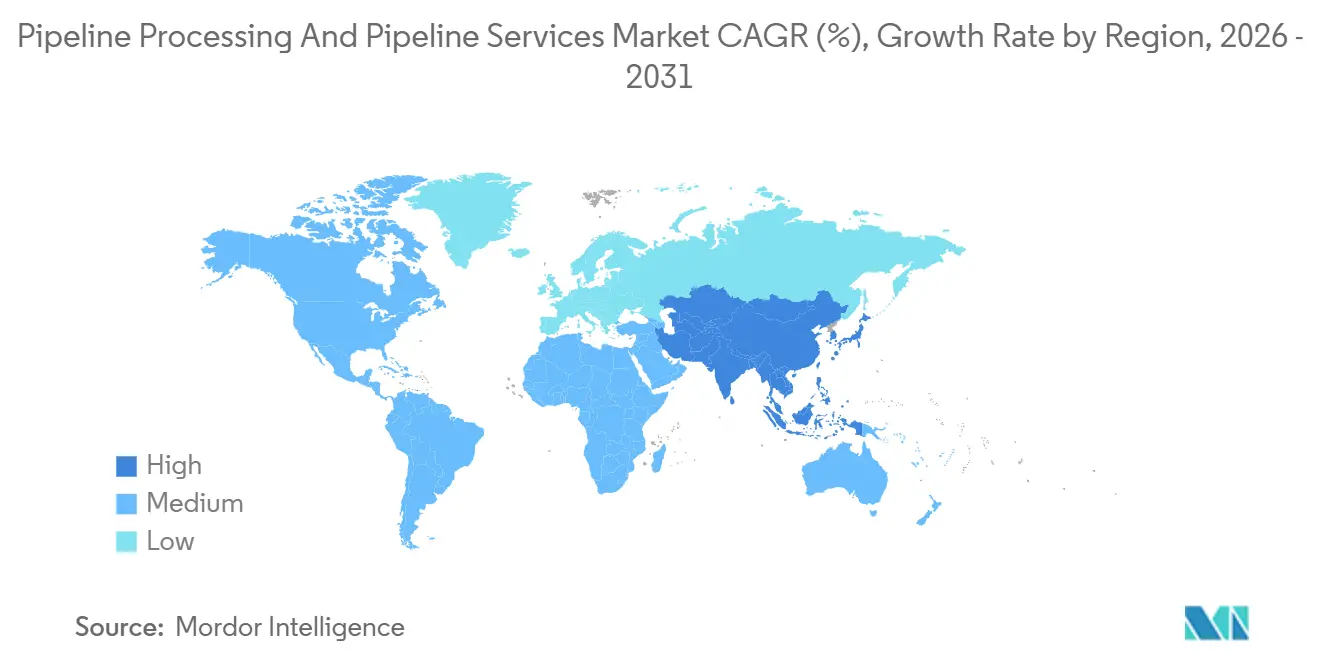
| Fastest Growing Market | Asia Pacific |
| Largest Market | North America |
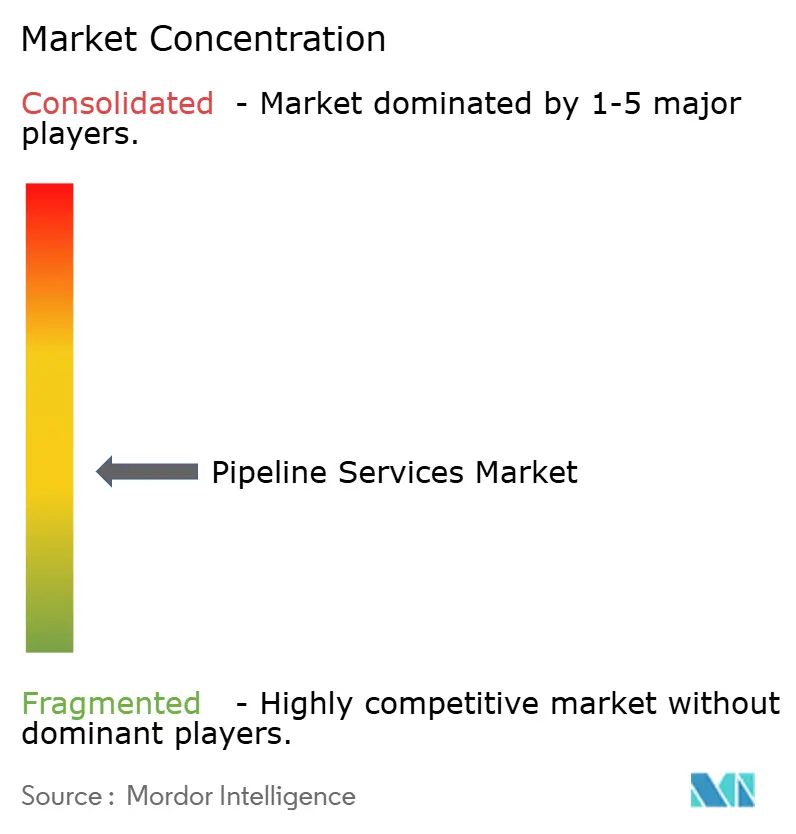
| Market Concentration | Medium |
Major Players *Disclaimer: Major Players sorted in no particular order Image © Mordor Intelligence. Reuse requires attribution under CC BY 4.0. | |
Pipeline Services Market Analysis by Mordor Intelligence
The Pipeline Services Market size is projected to expand from USD 45.28 billion in 2025 and USD 47.73 billion in 2026 to USD 64.87 billion by 2031, registering a CAGR of 6.33% between 2026 to 2031. Robust spending on life-extension programs for aging oil and gas lines, together with a wave of hydrogen and carbon-dioxide pipeline projects, is driving steady demand for pre-commissioning, inspection, and maintenance packages. Operators are shifting from reactive repairs toward data-rich integrity programs that deploy inline sensors, cloud analytics, and robotics to pinpoint trouble spots before leaks occur. Municipal water utilities are also scaling investments to replace cast-iron mains installed a century ago, while petrochemical complexes are installing corrosion-resistant alloy pipelines to handle aggressive media. Competitive intensity is rising as full-service oilfield providers leverage digital twins to secure multi-year integrity contracts, and niche inspection firms differentiate with AI-enhanced magnetic-flux-leakage tools capable of sub-millimeter detection [1]ROSEN Group, “RoCorr MFL-A Ultra Launch,” rosen-group.com. At the same time, volatile crude prices and a chronic shortage of certified inspectors are pressuring budgets, prompting exploration of outcome-based service contracts that share risk between operators and vendors [2]Vibha Rani, “Aramco Awards $8.8 B Gas System Contract,” Reuters, reuters.com.
Key Report Takeaways
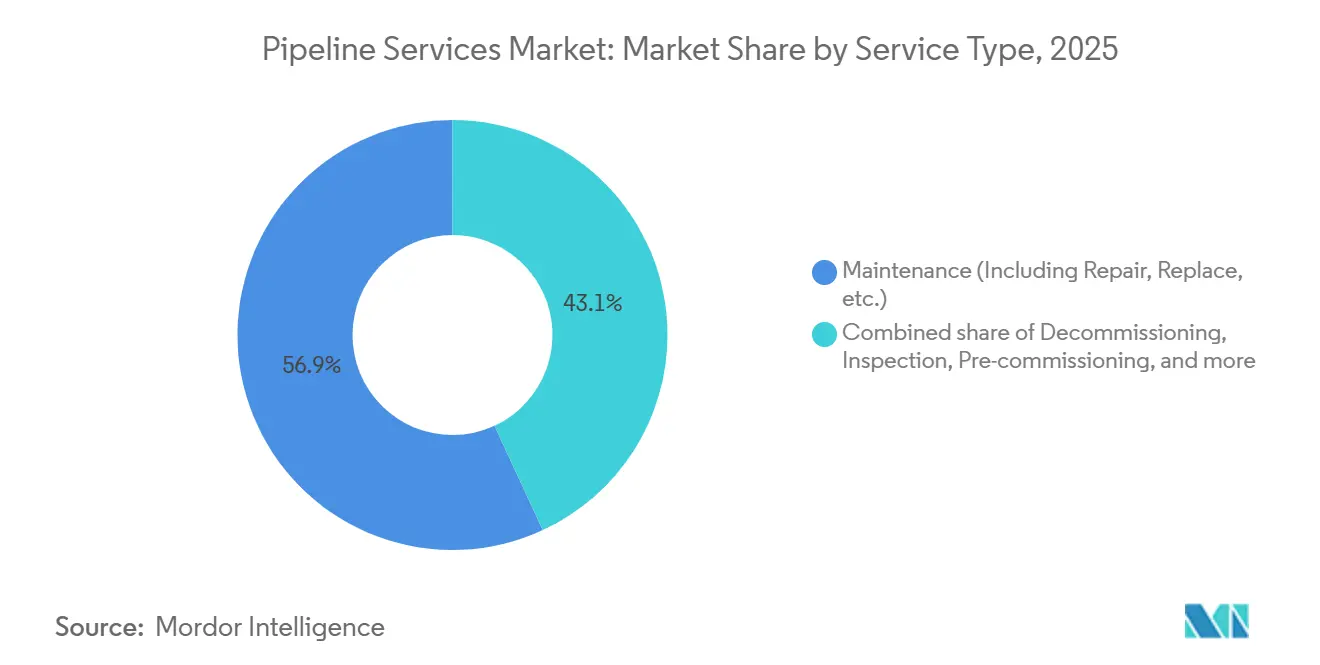
- By service type, maintenance services commanded 56.90% of the pipeline processing and pipeline services market share in 2025, while pre-commissioning services are projected to register the fastest growth through 2031.
- By pipeline type, oil pipelines held 40.10% of the pipeline processing and pipeline services market size in 2025, while water and industrial pipelines are forecast to expand at 7.90% CAGR through 2031.
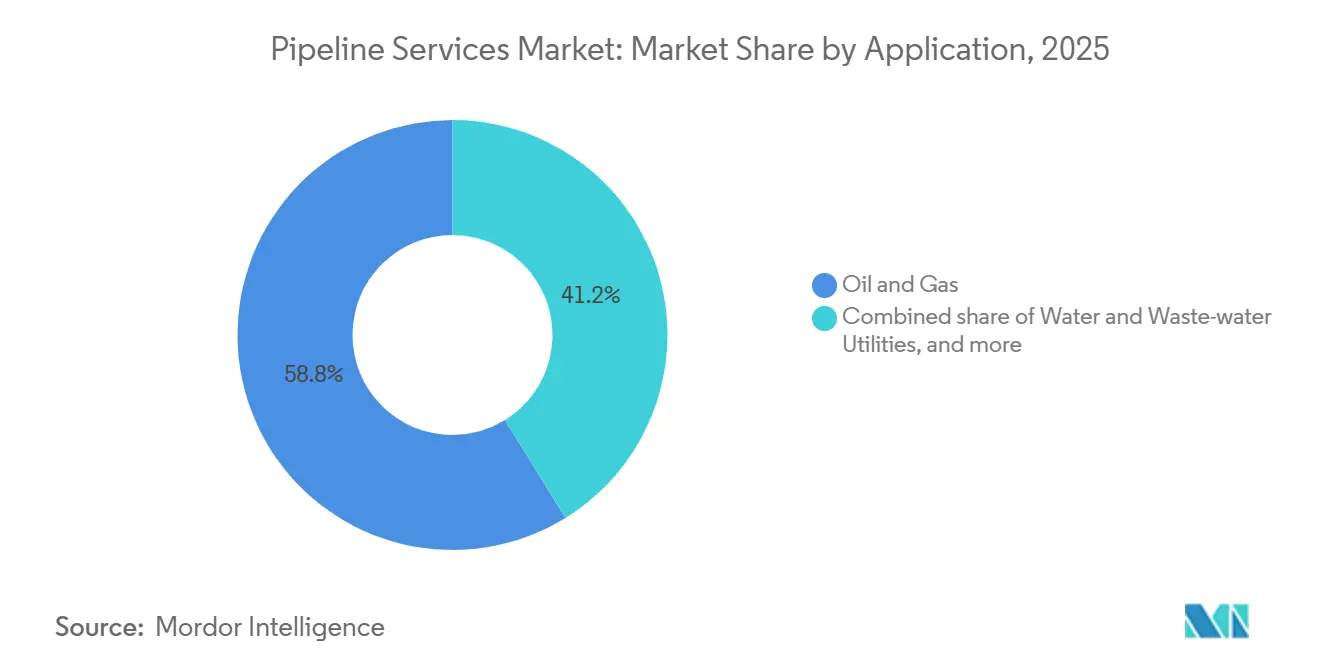
- By application, oil and gas accounted for 58.80% of the pipeline processing and pipeline services market revenue in 2025, while water and wastewater utilities are expected to grow at the highest CAGR of 8.50% through 2031.
- By geography, North America dominated with 36.30% of the global pipeline processing and pipeline services market share in 2025, while Asia-Pacific is projected to record the fastest CAGR of 7.80% through 2031.
Note: Market size and forecast figures in this report are generated using Mordor Intelligence’s proprietary estimation framework, updated with the latest available data and insights as of January 2026.
Global Pipeline Services Market Trends and Insights
Drivers Impact Analysis*
| Driver | (~) % Impact on CAGR Forecast | Geographic Relevance | Impact Timeline |
|---|---|---|---|
| Growing global oil & gas demand; pipeline network expansion | + 1.8% | Global, with concentration in Middle East, Asia-Pacific, and North America | Medium term (2-4 years) |
| Rising cross-border pipeline CAPEX & EPC contracts | + 1.3% | Middle East & Africa core, spill-over to Asia-Pacific and South America | Medium term (2-4 years) |
| Aging pipeline assets needing life-extension services | + 1.5% | North America & Europe core, emerging in Asia-Pacific | Long term (≥ 4 years) |
| Operational-efficiency push: inline inspection, pigging analytics | + 1.2% | Global, early adoption in North America and Europe | Short term (≤ 2 years) |
| Emergence of hydrogen & CO₂ pipelines needing novel cleaning/commissioning | + 0.9% | Europe and Middle East core, spill-over to Asia-Pacific and North America | Medium term (2-4 years) |
| Source: Mordor Intelligence | |||
Growing Global Oil and Gas Demand Driving Pipeline Network Expansion
Mega-projects such as Saudi Aramco’s USD 8.8 billion Master Gas System Phase 3 and Energy Transfer’s USD 2.1 billion Permian addition are adding thousands of kilometers of gathering and transmission lines, locking in multi-decade service contracts for hydrostatic testing and intelligent pigging [3]Vibha Rani, “Aramco Awards $8.8 B Gas System Contract,” Reuters, reuters.com. In Southeast Asia, the Trans-ASEAN framework targets 4,500 kilometers of interconnected pipelines by 2030, which will require pre-commissioning specialists able to achieve sub-1% false-call rates during leak checks [4]Staff Writer, “ASEAN Nations Sign Gas Corridor Deal,” Financial Times, ft.com. West Africa’s planned Nigeria–Morocco Gas Pipeline stretches 5,660 kilometers across 13 countries, underscoring the global reach of new-build activity. Each of these corridors demands bespoke material selection, strain-based design, and continuous integrity monitoring to navigate deserts, tropical climates, and coastal crossings. Vendors capable of bundling engineering, sensor deployment, and regulatory support are best positioned to capitalize on the emerging capacity wave.
Aging Pipeline Assets Requiring Life-Extension Services
Roughly 65% of U.S. natural-gas transmission lines were installed before 1970, a profile mirrored by Europe’s North Sea grid, where average asset age exceeds 40 years. Inline inspection data reveal stress-corrosion cracking and seam-weld flaws that, left unaddressed, can trigger ruptures. Enbridge’s USD 5.3 billion Mainline replacement and India’s USD 1.2 billion offshore integrity program illustrate the capital at stake. Composite wraps, fiber-optic acoustic sensing, and predictive analytics are extending asset life by 15-20 years, deferring billions in replacement outlays. Regulatory pressure is rising: PHMSA now mandates high-consequence area inspections every 5 years, accelerating adoption of data-driven maintenance. Insurance premiums tied to loss-history metrics further reinforce proactive inspection cycles.
Operational-Efficiency Push Through Inline Inspection and Pigging Analytics
New tools such as ROSEN’s RoCorr MFL-A Ultra detect 0.3-millimeter wall loss at 3 meters per second, halving run times versus legacy fleets. T.D. Williamson’s SmartPlug isolates live pipelines without depressurization, trimming downtime from 72 to 18 hours and saving USD 4.2 million per event. Cloud dashboards aggregate pigging, cathodic-protection, and leak-detection data so operators can target the riskiest joints first, cutting mean-time-to-repair by 35%. Outcome-based service contracts are emerging, where vendors guarantee inspection accuracy or share penalties. Savings of 12-18% in operating budgets are being funneled into robotics capable of navigating unpiggable laterals.
Emergence of Hydrogen and CO₂ Pipelines Requiring Novel Cleaning and Commissioning
Projects such as the United Kingdom’s HyNet North West and Germany’s OGE hydrogen-readiness upgrade require nitrogen purging, vacuum drying, and helium leak-testing to avoid embrittlement and oxygen contamination. ADNOC’s Habshan–Fujairah CO₂ line employs duplex stainless steel and quarterly ultrasonic checks to track stress cracking. Service providers with expertise in non-metallic compatibility, pressure-cycling fatigue, and ISO 14064 monitoring enjoy first-mover advantages. As hydrogen corridors proliferate, equipment rental pools for drying units, leak-test skids, and corrosion-resistant pigs are expanding. Operators favor vendors that can certify lines to API 1171 and ISO 16708 on a single mobilization, compressing commissioning schedules.
Restraints Impact Analysis*
| Restraint | (~) % Impact on CAGR Forecast | Geographic Relevance | Impact Timeline |
|---|---|---|---|
| High service cost & downtime impact | -0.7% | Global, acute in North America and Europe | Short term (≤ 2 years) |
| Stringent HSE & environmental compliance burden | -0.5% | North America & Europe core, expanding to Asia-Pacific | Medium term (2-4 years) |
| Volatile crude & gas prices deferring O&M budgets | -0.6% | Global, most severe in North America and South America | Short term (≤ 2 years) |
| Skilled-labour shortage for advanced pigging/robotics | -0.4% | North America & Europe acute, emerging in Asia-Pacific | Medium term (2-4 years) |
| Source: Mordor Intelligence | |||
High Service Cost and Downtime Impact
Large-diameter inline inspections average USD 18,000-25,000 per mile, with mobilization and data analysis adding 30-40%, a burden for midstream firms lacking scale economies. A 72-hour outage on a 500,000 bpd crude line equates to USD 36 million in lost throughput at USD 72 per barrel, incentivizing operators to defer non-critical runs during high-margin periods. Certified API 1169 inspectors command USD 120,000-160,000 salaries, and vacancy rates top 18%, inflating contractor rates. Volatile oil prices deferred USD 12 billion in North American midstream capital outlays in 2024, narrowing budgets for optimization projects. Outcome-based agreements, where vendors absorb some performance risk, are gaining ground but have yet to scale across smaller operators.
Stringent HSE and Environmental Compliance Burden
PHMSA’s December 2024 rule mandates methane-leak surveys every six months and five-year inline inspections in high-consequence areas, adding USD 8,000-12,000 per mile to annual operating costs. Europe’s revised Industrial Emissions Directive caps fugitive emissions at 0.05% of throughput, forcing installation of continuous-monitoring systems and quarterly third-party audits. Canada’s imminent Clean Fuel Regulations will penalize pipelines exceeding 12 g CO₂e per megajoule transported, accelerating shifts to electric-drive compressors and renewable power contracts. Permitting for cross-border lines can involve 40,000-page dossiers and 18-24-month delays, inflating pre-construction spend by up to USD 30 million. Operators now embed HSE specialists within project teams and deploy blockchain audit trails to streamline paperwork, but compliance remains a drag on near-term margins.
*Our forecasts treat driver/restraint impacts as directional, not additive. The impact forecasts reflect baseline growth, mix effects, and variable interactions.
Segment Analysis
By Service Type: Maintenance Dominance Reflects Aging Asset Base
The maintenance segment accounted for 56.9% of the pipeline processing and pipeline services market in 2025 as operators prioritized life-extension over greenfield builds. Composite wraps, hot-tap isolation, and cloud analytics compress repair cycles while avoiding costly shutdowns. Predictive algorithms that blend pigging data with soil-corrosion maps enable operators to delay non-critical digs until risk thresholds are met. Pre-commissioning, centered on nitrogen purging and vacuum drying, is gaining share as hydrogen and CO₂ lines proliferate, though from a smaller base. Integrity management services benefit from PHMSA rules mandating five-year inspection intervals in high-consequence areas.
Inspection services continue to evolve, with sub-millimeter detection lowering false-positive rates and enabling confident deferment of remediation. Decommissioning is emerging in the North Sea, where 40-year-old lines are retired via robotic cutting and subsea debris removal. Vendors able to integrate robotics, AI-enhanced sensors, and cloud visualization cut mean-time-to-repair by 35% and are rewarded with multi-year master service agreements. As a result, the pipeline processing and pipeline services market size tied to maintenance is forecast to rise in lockstep with global refurbishment budgets.


By Pipeline Type: Water Infrastructure Outpaces Traditional Hydrocarbons
Oil pipelines retained a 40.1% revenue share in 2025, yet water and industrial pipelines are expanding at a 7.9% CAGR as municipal bond issues surpass USD 18 billion for leak-detection and line replacements. Natural-gas corridors in China and India underpin steady growth for inspection and compression services. Refined-product lines integrate batch-tracking and drag-reducing agents that cut energy and contamination losses. The American Water Works Association estimates USD 1 trillion will be required through 2035 to renew U.S. municipal pipe networks, ensuring a durable pipeline processing and pipeline services market size for trenchless rehabilitation and acoustic-leak-detection providers.
Petrochemical complexes along the U.S. Gulf Coast and in the Middle East install corrosion-resistant alloys to handle aggressive feedstocks, demanding quarterly ultrasonic inspections and advanced corrosion modeling. The pivot toward water resilience and industrial diversification signals a rebalancing away from legacy crude-oil corridors. Vendors that offer multi-material inspection fleets and water-specific analytics stand to capture outsized shares as municipalities prioritize environmental stewardship.
By Application: Water Utilities Surge Amid Infrastructure Renewal
Oil and gas remained the dominant application at 58.8% in 2025, buoyed by Saudi Aramco’s USD 8.8 billion gas-expansion phase and new Permian takeaway capacity. Yet water and wastewater utilities clocked an 8.5% CAGR, the fastest in the study period, propelled by strict lead-service-line replacement mandates under the EPA’s revised Lead and Copper Rule. Municipalities deploy smart meters and pressure-management zones to cut non-revenue water by 20-30%, amplifying demand for leak-survey and analytics talent.
Chemical and petrochemical operators invest in alloy lines and real-time corrosion monitoring to handle ethylene oxide, sulfuric acid, and similar aggressive media. Mining slurries and district-heating networks add niche opportunities for vibration sensing and flow optimization using digital twins. Cross-application technology transfer, such as moisture analyzers originally built for LNG plants now used in water pipelines, broadens the addressable pipeline processing and pipeline services market.
Geography Analysis
North America contributed 36.3% of global revenue in 2025, underpinned by the USD 30.9 billion Trans Mountain expansion and Enbridge’s Mainline replacement. The region operates 2.7 million miles of pipelines, 65% of which were laid before 1970, placing corrosion mitigation at the center of spending plans. New PHMSA rules mandate methane surveys every six months in high-consequence areas, accelerating the adoption of optical-gas-imaging drones and fiber-optic sensing. Integrated providers leverage digital twins to win multi-year integrity deals, while niche firms capture decommissioning scopes for redundant offshore lines.
Asia-Pacific posts the quickest growth at 7.8% through 2031 as China adds 15,000 kilometers of trunk lines and India completes the 450-kilometer Mehsana-Bhatinda section. The Trans-ASEAN gas corridor and Indonesia’s city-water overhaul drive demand for leak-detection and trenchless rehabilitation. Offshore operators in Australia experiment with autonomous inspection vehicles for deepwater tie-backs, cutting cycle time by 40%. Regional regulators tighten fugitive-emission standards, nudging operators toward continuous-monitoring platforms.
Europe balances aging hydrocarbon assets with energy-transition projects. Composite wraps and electrochemical protection extend North Sea pipelines by up to 20 years, while the HyNet North West and MosaHYc hydrogen corridors require novel cleaning and material-compatibility checks. Germany’s OGE retrofit demonstrates how targeted investment can make legacy lines hydrogen-ready within two years. Meanwhile, Nigeria’s 5,660-kilometer gas link to Morocco underscores the Middle East and Africa’s appetite for mega-projects that demand robust integrity programs. South America remains smaller, yet Brazil’s pre-salt developments and Argentina’s Vaca Muerta shale spur subsea integrity and gathering-system installations.

Competitive Landscape
The pipeline services market is semi fragmented. Baker Hughes, Halliburton, and Schlumberger plays a mjor role in the market through broad service portfolios, digital twin platforms, and enterprise-wide agreements. Specialized firms such as ROSEN Group and T.D. Williamson hold 15-20% by focusing on high-resolution inline inspection and hot-tap isolation. Integrated majors bundle inspection with cloud analytics to lock in clients, while niche players exploit white space in decommissioning and hydrogen pre-commissioning, where embrittlement risks require fresh protocols.
Technology adoption drives competitive edges. ROSEN’s hybrid electromagnetic-acoustic transducer patent enables corrosion mapping and crack sizing in a single pigging run, halving inspection costs. Schlumberger’s 2025 acquisition of Eddyfi augments pulsed-eddy-current capabilities for corrosion-under-insulation surveys. Certification bodies SGS and Intertek expand API 1163 and ISO 16708 audits, providing a compliance moat that smaller firms struggle to breach.
Robotics startups field autonomous crawlers able to navigate unpiggable laterals using machine-vision navigation. Software vendors integrate inline reports, cathodic-protection reads, and leak alerts into cloud dashboards, lowering mean-time-to-repair by double-digit percentages. Operators increasingly favor end-to-end offerings that couple inspection hardware, analytics, and regulatory certification in one contract, edging single-service providers toward partnerships or consolidation.
Pipeline Services Industry Leaders
Baker Hughes Co
Schlumberger Limited (SLB)
Halliburton Company
ROSEN Group
T.D. Williamson Inc.
- *Disclaimer: Major Players sorted in no particular order

Recent Industry Developments
- August 2025: Applus+ in Singapore has secured a contract to deliver in-line inspection (ILI) services for six new 8-inch offshore pipelines using its DTI Trekscan free-swimming ultrasonic tool. This tool is specifically designed for complex, non-piggable offshore pipelines with tight bends and no launcher or receiver facilities.
- June 2025: The paper titled “Machine Learning Techniques in Ultrasonics-Based Defect Detection and Material Characterization: A Comprehensive Review” examines the application of machine learning (ML) in enhancing ultrasonic non-destructive evaluation (NDE) and structural health monitoring (SHM).
- March 2025: The paper titled “Machine Learning Techniques in Ultrasonics-Based Defect Detection and Material Characterization: A Comprehensive Review” examines the application of machine learning (ML) in enhancing ultrasonic non-destructive evaluation (NDE) and structural health monitoring (SHM).


Global Pipeline Services Market Report Scope
The Pipeline Services Market encompasses companies, technologies, and services dedicated to the transportation, treatment, monitoring, maintenance, and optimization of fluids, including crude oil, natural gas, refined petroleum products, water, and chemicals, through pipeline networks.
The global pipeline services market is segmented into service type, pipeline type, application, and geography. By service type, the market is segmented into pre-commissioning, integrity management and monitoring, inspection, maintenance, and decommissioning. By pipeline type, the market is segregated into oil, natural gas, refined products, water, and industrial. By application, the market is divided into oil and gas, chemicals and petrochemicals, water and wastewater utilities, and others. The market sizing and forecasts for each segment are based on the revenue generated (in USD).
| Pre-commissioning |
| Integrity Management and Monitoring |
| Inspection (Pigging, Flushing and Chemical Cleaning, Hydrostatic Testing, Drying, and Others) |
| Maintenance (Including Repair, Replace, etc.) |
| Decommissioning |
| Oil Pipelines |
| Natural-Gas Pipelines |
| Refined-Product Pipelines |
| Water and Industrial Pipelines |
| Oil and Gas |
| Chemicals and Petrochemicals |
| Water and Waste-water Utilities |
| Other Applications |
| North America | United States |
| Canada | |
| Mexico | |
| Europe | Germany |
| United Kingdom | |
| France | |
| Italy | |
| NORDIC Countries | |
| Russia | |
| Rest of Europe | |
| Asia-Pacific | China |
| India | |
| Japan | |
| South Korea | |
| ASEAN Countries | |
| Australia and New Zealand | |
| Rest of Asia-Pacific | |
| South America | Brazil |
| Argentina | |
| Colombia | |
| Rest of South America | |
| Middle East and Africa | Saudi Arabia |
| United Arab Emirates | |
| South Africa | |
| Nigeria | |
| Algeria | |
| Rest of Middle East and Africa |
| By Service Type | Pre-commissioning | |
| Integrity Management and Monitoring | ||
| Inspection (Pigging, Flushing and Chemical Cleaning, Hydrostatic Testing, Drying, and Others) | ||
| Maintenance (Including Repair, Replace, etc.) | ||
| Decommissioning | ||
| By Pipeline Type | Oil Pipelines | |
| Natural-Gas Pipelines | ||
| Refined-Product Pipelines | ||
| Water and Industrial Pipelines | ||
| By Application | Oil and Gas | |
| Chemicals and Petrochemicals | ||
| Water and Waste-water Utilities | ||
| Other Applications | ||
| By Geography | North America | United States |
| Canada | ||
| Mexico | ||
| Europe | Germany | |
| United Kingdom | ||
| France | ||
| Italy | ||
| NORDIC Countries | ||
| Russia | ||
| Rest of Europe | ||
| Asia-Pacific | China | |
| India | ||
| Japan | ||
| South Korea | ||
| ASEAN Countries | ||
| Australia and New Zealand | ||
| Rest of Asia-Pacific | ||
| South America | Brazil | |
| Argentina | ||
| Colombia | ||
| Rest of South America | ||
| Middle East and Africa | Saudi Arabia | |
| United Arab Emirates | ||
| South Africa | ||
| Nigeria | ||
| Algeria | ||
| Rest of Middle East and Africa | ||


Key Questions Answered in the Report
What is the projected value of the pipeline processing and pipeline services market by 2031?
The pipeline processing and pipeline services market size is forecast to reach USD 64.87 billion by 2031 based on a 6.33% CAGR from 2026-2031.
Which service segment currently leads spending?
Maintenance services dominate with a 56.9% share in 2025, reflecting the push to extend aging pipelines' service life.
Why are water utilities investing heavily in pipeline services?
Revised EPA rules and rising municipal bond funding have accelerated leak-detection and lead-service-line replacements, lifting water-utility spending at an 8.5% CAGR.
Which region is expanding the fastest?
Asia-Pacific is projected to grow at 7.8% through 2031 as China and India add extensive gas-pipeline capacity and municipal water lines.
How are emerging hydrogen pipelines influencing service demand?
Hydrogen projects require novel cleaning, drying, and material-compatibility checks, fostering new demand for pre-commissioning specialists and inspection technologies.
Page last updated on:


