Oil And Gas TIC Market Size and Share
Market Overview
| Study Period | 2019 - 2030 |
|---|---|
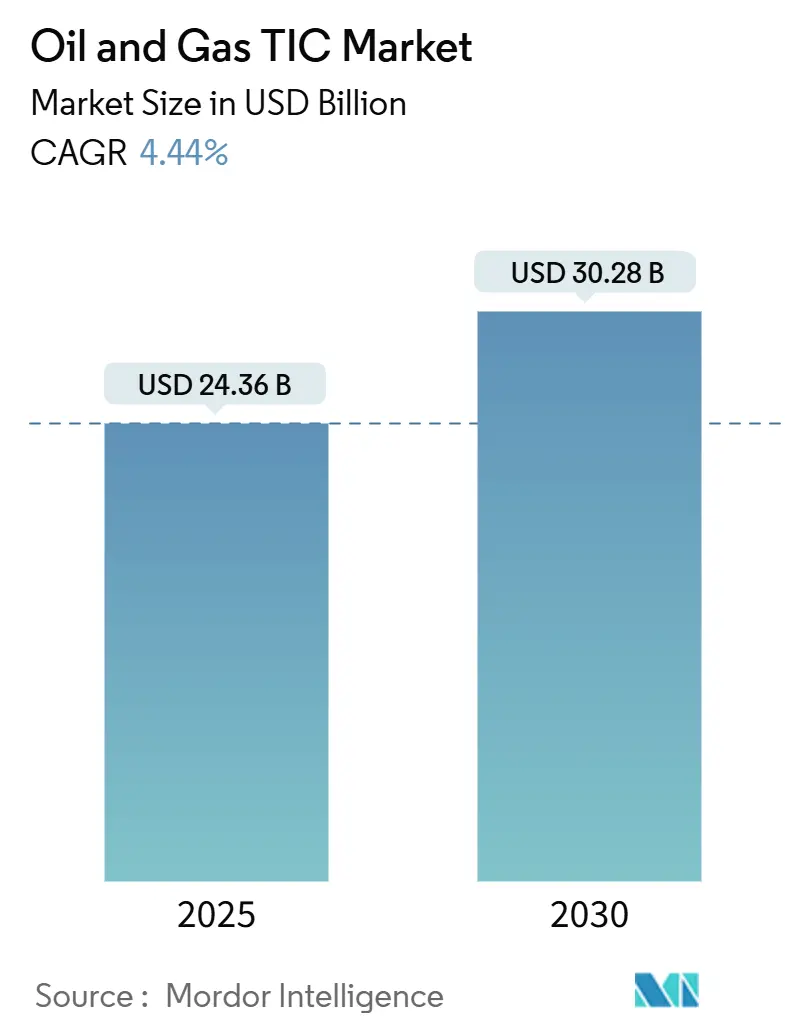
| Market Size (2025) | USD 24.36 Billion |
| Market Size (2030) | USD 30.28 Billion |
| Growth Rate (2025 - 2030) | 4.44% CAGR |
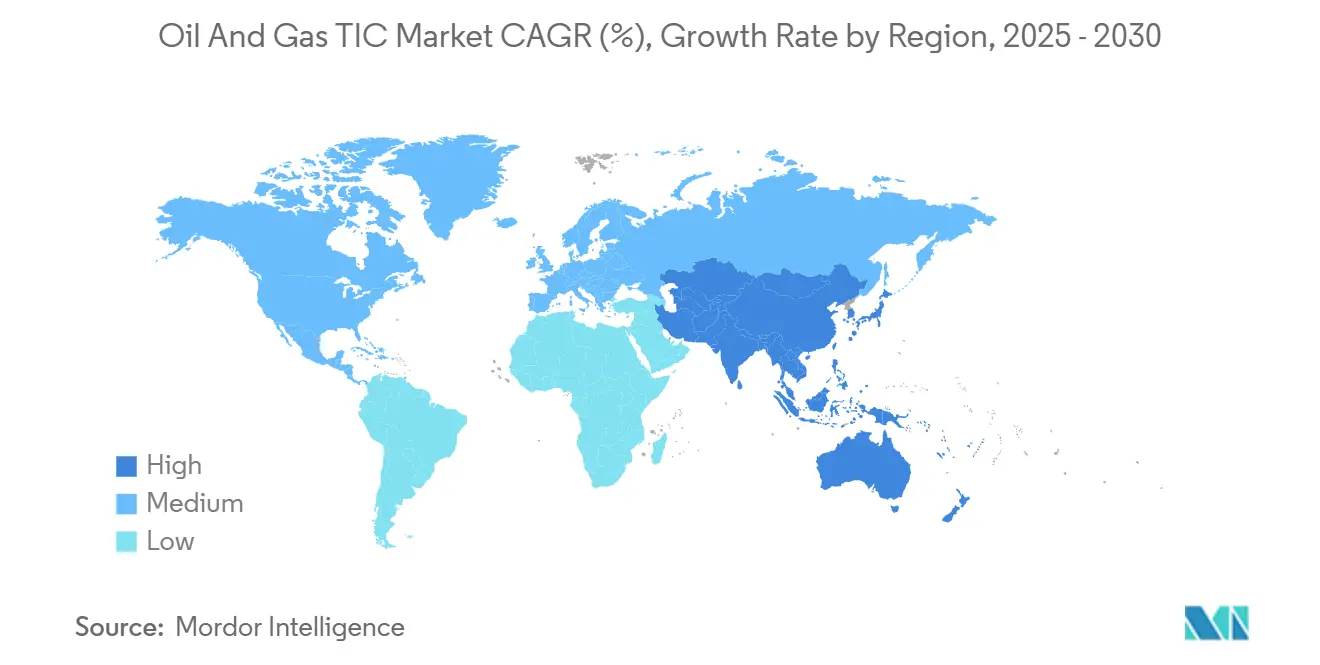
| Fastest Growing Market | Asia Pacific |
| Largest Market | Asia Pacific |
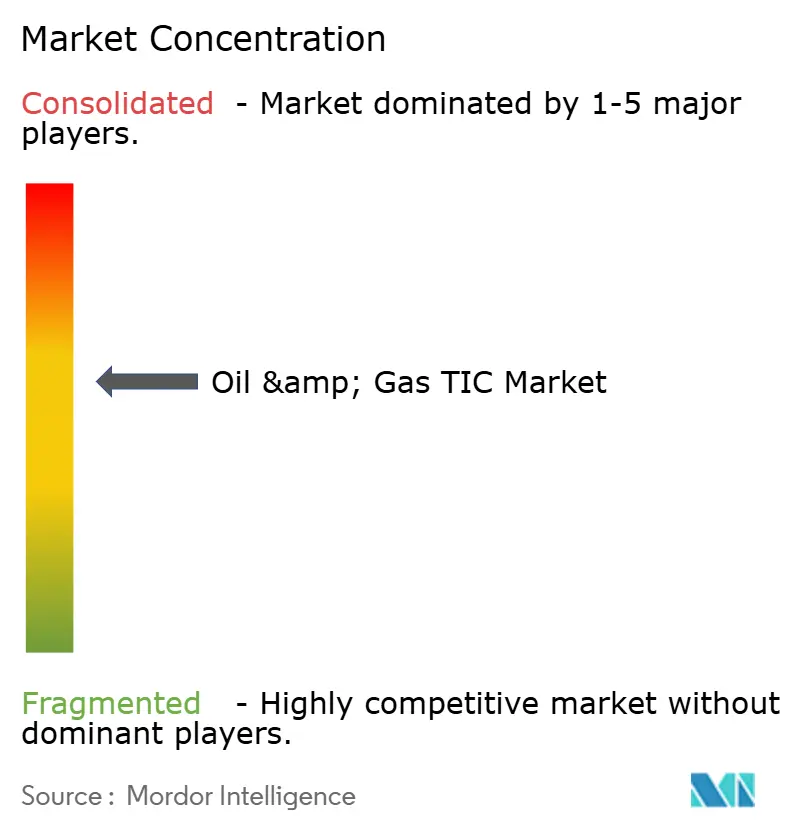
| Market Concentration | Medium |
Major Players *Disclaimer: Major Players sorted in no particular order Image © Mordor Intelligence. Reuse requires attribution under CC BY 4.0. | |
Oil And Gas TIC Market Analysis by Mordor Intelligence
The oil and gas testing inspection certification market reached USD 24.36 billion in 2025 and is projected to reach USD 30.28 billion by 2030, reflecting a 4.44% CAGR. The greater deployment of digital-first asset integrity programs, combined with widening regulatory scrutiny of methane emissions and extensive LNG export terminal construction, underpins the favorable outlook. The adoption of artificial-intelligence inspection analytics continues to reduce unplanned shutdowns while extending equipment life cycles, which, in turn, increases spending on predictive services. The systematic replacement of pipelines built during the 1960s–1980s energy boom is creating multi-year service contracts that favor providers with advanced inline inspection and corrosion assessment capabilities. Meanwhile, regional inspection demand is rising fastest in Asia-Pacific on the back of China’s Belt and Road Initiative pipelines and India’s expanding National Gas Grid. Consolidation rumors, most notably between SGS and Bureau Veritas, signal an intensification of competition for scale economies in technology investment and global delivery networks.
Key Report Takeaways
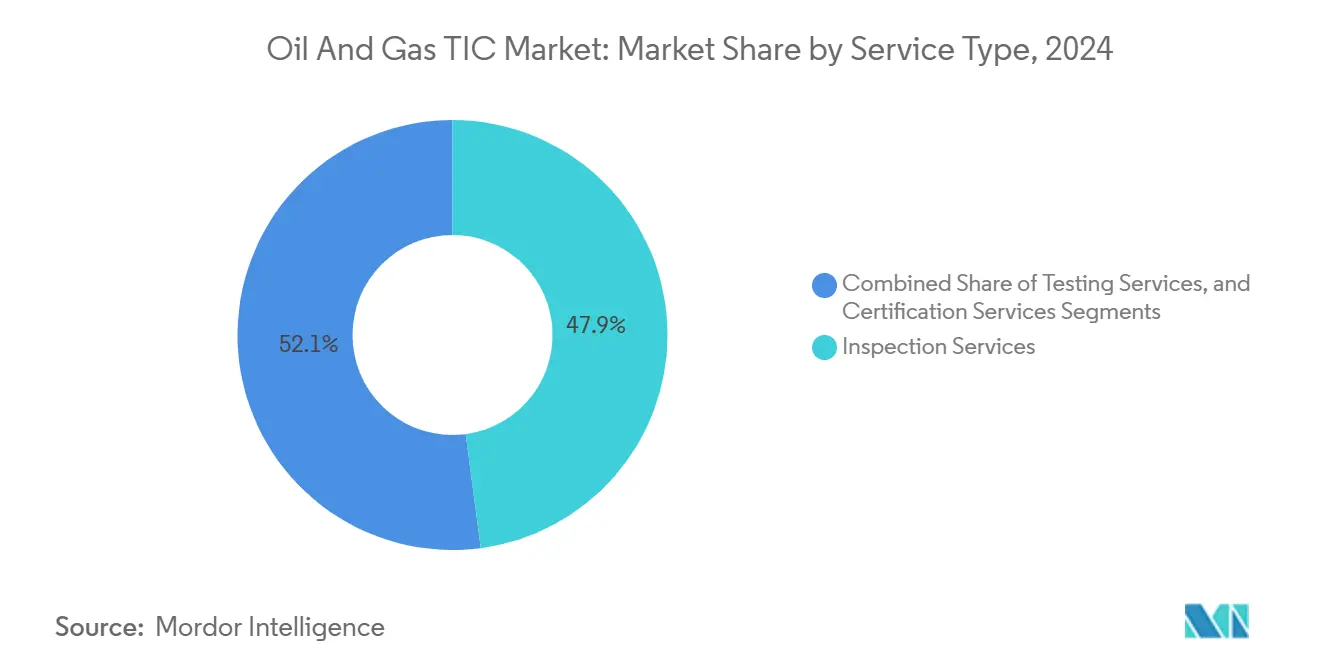
- By service type, inspection services led with 47.9% revenue share in 2024; certification services are projected to advance at a 5.1% CAGR through 2030.
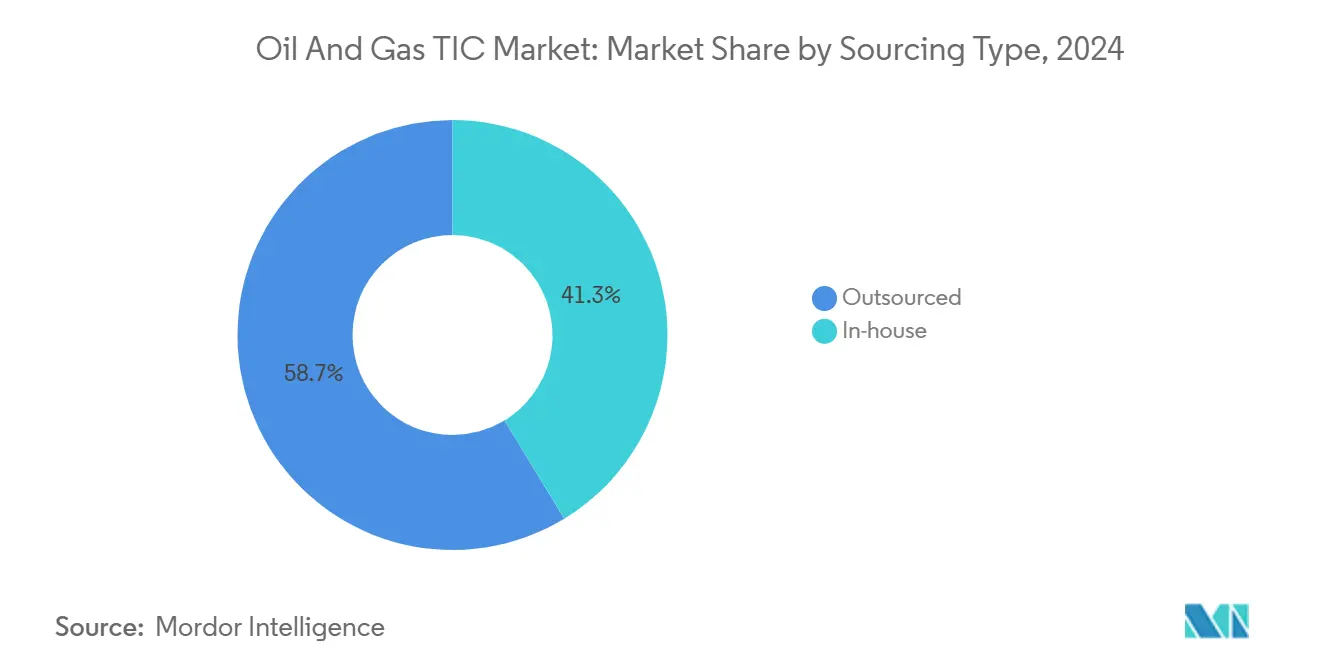
- By sourcing type, outsourced services held 58.7% of the oil and gas testing inspection certification market share in 2024, while the same segment is forecast to post the fastest 4.9% CAGR to 2030.
- By geography, Asia-Pacific accounted for 49.8% of 2024 revenue and is projected to remain the fastest-growing region at a 5.1% CAGR to 2030.
Global Oil And Gas TIC Market Trends and Insights
Drivers Impact Analysis*
| Driver | (~) % Impact on CAGR Forecast | Geographic Relevance | Impact Timeline |
|---|---|---|---|
| Digital-first asset integrity programs | +0.8% | Global; early adoption in North America and Europe | Medium term (2–4 years) |
| Intensifying ESG and methane-emissions scrutiny | +1.2% | Global, led by North America and the EU | Short term (≤ 2 years) |
| Aging pipeline infrastructure replacements | +0.9% | North America and Europe core; expanding to Asia-Pacific | Long term (≥ 4 years) |
| Stringent refinery turnaround schedules | +0.6% | Global refining hubs | Medium term (2–4 years) |
| Expansion of LNG export facilities | +0.7% | North America, Australia, Qatar | Medium term (2–4 years) |
| Emergence of remote inspection robotics | +0.5% | Asia-Pacific core; spill-over to North America and MEA | Long term (≥ 4 years) |
| Source: Mordor Intelligence | |||
Digital-first asset integrity programs drive market transformation
Artificial intelligence and machine learning have shifted inspection from reactive to predictive modes, enabling operators to cut unplanned downtime by up to 35% while lengthening asset life cycles.[1]SLB, “OptiSite Digital Platform Launch,” slb.com OptiSite and comparable platforms pool inline inspection, corrosion monitoring, and process data into unified dashboards that support rapid intervention decisions. TIC providers now monetize proprietary algorithms, digital twins, and real-time analytics alongside traditional field work, converting data stewardship into a recurring revenue model. Providers capable of combining robotics, cloud connectivity, and analytics increasingly win multiyear contracts for critical upstream and midstream assets. DNV’s latest platform iteration shows how software has become a central differentiator in a sector once defined purely by technician skills. Continuous monitoring is supplementing, rather than eliminating, mandatory periodic inspections, which preserves core revenue while capturing new high-margin digital services.
ESG scrutiny accelerates compliance-driven inspection demand
The U.S. EPA’s OOOOb and OOOOc rules require quarterly methane monitoring across oil and gas facilities, pushing operators toward leak-detection technologies such as optical gas imaging and drone surveillance. Europe’s Methane Emissions Reduction Regulation imposes similar mandates from 2024, expanding opportunities for providers skilled in quantification and verification methodologies. Canada’s draft methane regulations align with this trend, establishing a North American compliance corridor that standardizes inspection frequencies and methods. Fines that can reach multimillion-dollar levels add urgency to third-party verification to demonstrate due diligence. Providers with experience in drone-based mass-balance measurements and continuous sensing have seen a sharp rise in demand from both onshore and offshore facilities seeking to stay ahead of tighter disclosure rules.
Aging infrastructure replacement cycles create systematic inspection opportunities
Roughly 40% of U.S. natural-gas transmission pipelines are over 50 years old, making condition-assessment data pivotal for safe operation until replacement.[2]Pipeline and Hazardous Materials Safety Administration, “Pipeline Mileage and Facilities,” phmsa.dot.gov Risk-based inspection programs integrate historical incident records with ultrasonic crack-detection and corrosion mapping to establish data-driven prioritization schedules. Operators selecting replacement windows need independent verification of remaining-life estimates, anchoring multiyear inspection contracts that extend from preliminary surveys to post-installation validation. Similar patterns are emerging in Europe, where legacy pipeline networks built during the North Sea development era now require enhanced scrutiny before being repurposed for hydrogen transport. The scale and predictability of these programs continue to underpin the oil and gas testing, inspection certification market, particularly for providers owning high-resolution inline inspection tools capable of detecting sub-millimeter anomalies.
LNG export facility expansion drives specialized inspection requirements
Mega-projects such as Plaquemines LNG, Corpus Christi Stage 3, and Golden Pass LNG stipulate exhaustive testing ranging from cryogenic metallurgy to high-pressure piping weld integrity. Each facility triggers multi-year contracts encompassing construction QA/QC, commissioning, and operational readiness audits. International standards, including ASME Section VIII and API 620, impose multiple verification layers that can only be satisfied by highly specialized laboratories and field crews. High-risk cryogenic components demand advanced ultrasonic and radiographic examinations, placing a premium on providers equipped with automated scanners and digital X-ray systems. The coastal clustering of new terminals has led TIC companies to establish regional centers of excellence, providing faster mobilization, localized expertise, and integrated certification services.
Restraints Impact Analysis*
| Restraint | (~) % Impact on CAGR Forecast | Geographic Relevance | Impact Timeline |
|---|---|---|---|
| Volatile upstream CAPEX cycles | -0.7% | Global, particularly acute in the North America shale regions | Short term (≤ 2 years) |
| Shortage of certified inspectors in frontier regions | -0.4% | Africa, South America, Southeast Asia | Medium term (2–4 years) |
| Fragmented regulatory codes across jurisdictions | -0.3% | Multi-jurisdictional projects | Long term (≥ 4 years) |
| Rising preference for in-house digital twins | -0.6% | Global, led by major integrated oil companies | Medium term (2–4 years) |
| Source: Mordor Intelligence | |||
Upstream CAPEX volatility constrains service demand growth
Producers remain disciplined in their spending, even as pipeline replacement and low-carbon upgrades become urgent. Dallas Federal Reserve's fourth-quarter 2024 survey respondents expected only modest increases in North American drilling and completion budgets, reflecting persistent price volatility and shareholder pressure for free cash flow returns. Operators consequently defer non-critical inspection campaigns and negotiate narrower service scopes, crimping near-term revenue visibility for TIC providers. Projects already sanctioned remain active; however, discretionary activity, especially in unconventional plays, fluctuates rapidly with commodity prices, creating staffing and equipment utilization challenges for inspection companies.
Shortage of certified inspectors in frontier regions adds scheduling risk
Africa, South America, and parts of Southeast Asia face acute talent shortages, particularly for advanced non-destructive testing certifications such as ASNT Level III ultrasonic and phased-array weld inspection.[3]American Society for Nondestructive Testing, “Introduction to Nondestructive Testing,” asnt.org Travel restrictions, inconsistent training pipelines, and high turnover exacerbate gaps that delay project mobilization. Operators in these regions increasingly book international crews months in advance, driving up personnel costs and elongating lead times. TIC providers with global mobility programs and local apprenticeship initiatives mitigate these challenges, but competition for skilled technicians remains intense. The shortage can push smaller projects to adopt less sophisticated inspection approaches, potentially elevating operational risk and limiting provider revenue from premium services.
*Our forecasts treat driver/restraint impacts as directional, not additive. The impact forecasts reflect baseline growth, mix effects, and variable interactions.
Segment Analysis
By Service Type: Inspection Services Lead Digital Integration
Inspection services captured 47.9% of 2024 revenue in the oil and gas testing inspection certification market, underscoring their centrality to asset-integrity compliance. The dominance reflects growing reliance on inline inspection, drone-based visual surveys, and high-frequency ultrasonic testing that feed real-time analytics platforms. Robotic crawlers equipped with multiple sensors now perform simultaneous wall-thickness gauging, corrosion mapping, and video capture, reducing shutdown windows and enabling full-line coverage in fewer passes. Coupling this data with digital twins supports predictive maintenance that can reduce total inspection costs over each asset’s life cycle. Providers able to integrate inspection data into operator analytics environments command premium pricing and longer-term contracts.
Certification services, while holding a smaller base, are projected to expand at a 5.1% CAGR to 2030. Complex transnational infrastructure projects increasingly require third-party attestation for both traditional and digital inspection methodologies. Independent validation of AI-based defect-recognition algorithms has become a new revenue stream, as regulators insist on documented proof of accuracy and repeatability. Testing services continue to form the backbone of materials verification and environmental compliance programs, but their growth lags as online sensors gradually reduce reliance on periodic laboratory sampling. Nonetheless, high-value chemical, metallurgical, and failure-analysis tests remain indispensable during facility turnarounds and incident investigations.


By Sourcing Type: Outsourcing Dominance Reflects Specialized Expertise
Outsourced providers accounted for 58.7% of the 2024 spending in the oil and gas testing, inspection, and certification market. Operators often favor external specialists for advanced technologies, such as high-definition laser scanning, remote ultrasonic crawlers, and radiographic computed tomography, which require ongoing capital investments and dedicated technical staff. The outsourced segment is forecast to post the fastest 4.9% CAGR through 2030, driven by the rapid emergence of drone-enabled and subsea robotics services, areas where qualifications and equipment investments exceed most in-house budgets.
In-house inspection functions remain important for routine surveillance and day-to-day maintenance tasks, growing at a slower 4.1% CAGR. Many integrated oil companies employ hybrid models, reserving proprietary teams for core asset monitoring while outsourcing complex or high-risk tasks to third-party experts. Outcome-based contracting is gaining traction, shifting commercial models from time-and-materials to performance metrics linked to uptime or leak-rate reductions. Such frameworks encourage deeper collaboration between operators and service providers, aligning incentives toward continuous improvement and innovation.
Geography Analysis
Asia-Pacific generated 49.8% of 2024 revenue and is forecast to maintain the lead with a 5.1% CAGR to 2030, reinforcing its pivotal role in the oil and gas testing inspection certification market. China’s addition of more than 10,000 km of new gas pipelines annually under the Belt and Road continues to create robust demand for periodic integrity assessments and weld inspections. India’s 17,000-km National Gas Grid build-out requires specialized corrosion monitoring and geohazard surveys, particularly in high-consequence areas with dense populations. LNG capacity growth in Australia and Southeast Asia further boosts regional demand for cryogenic materials testing and export-terminal certification.
North America remains a critical revenue pillar, driven by aging asset replacement and stringent methane-emission rules that mandate quarterly or continuous leak monitoring. The region’s unconventional shale plays complicate inspection logistics, as well as pads and gathering systems disperse across wide areas, increasing reliance on drone overflights and satellite data for rapid coverage. Canada’s Coastal GasLink and Trans Mountain projects add sizeable inspection contracts tied to both construction QA/QC and environmental stewardship.
Europe shows steady, regulation-led growth. North Sea operators increasingly commission detailed residual-life studies to decide between decommissioning and hydrogen repurposing. EU methane rules, in force since 2024, institutionalize facility-wide leak detection and repair (LDAR) programs, stimulating demand for optical gas imaging and mass-balance quantification.[4]European Union, “Methane Emissions Reduction Regulation,” eur-lex.europa.eu Central and Eastern Europe’s interconnector pipelines, designed to diversify gas supply, require multi-jurisdictional certification, enhancing the value proposition of providers with pan-European accreditations. The Middle East and Africa markets advance at moderate rates, supported by new upstream developments and pipeline corridors, but often constrained by political risk and local skills shortages. Nonetheless, mega-projects such as Qatar’s North Field South and Uganda’s East African Crude Oil Pipeline continue to secure high-value inspection packages.

Competitive Landscape
Industry concentration is moderate, with the top five providers including SGS, Bureau Veritas, Intertek, TÜV SÜD, and DNV, which leverage global labs, proprietary software, and robotics fleets to differentiate themselves beyond price. If consummated, the potential SGS–Bureau Veritas merger would create a USD 33–35 billion entity with unmatched geographic reach and R&D budgets, which could reshape the competitive benchmarks for the oil and gas testing, inspection, and certification market. Technology adoption is the primary battleground: SGS is piloting AI-enabled pipe crawlers, DNV recently integrated automated defect recognition into its digital platform, and Intertek has created a hydrogen infrastructure division to capture early mover advantages in emerging fuel networks.
Smaller specialists carve niches in drone-based inspection, subsea robotics, and methane quantification, often partnering with OEMs to co-develop sensors tailored to oil and gas environments. Regional players, especially in Asia and the Middle East, leverage local accreditation and regulatory familiarity to secure national-content contracts that global giants may find cost-prohibitive to pursue directly. Strategic alliances, such as TÜV SÜD’s collaboration with software firms for real-time risk dashboards, enable incumbents to keep pace with digital disruption without bearing the full development costs.
Pricing dynamics increasingly hinge on outcome-based models, tying compensation to measurable reductions in leaks, downtime, or inspection backlogs. This shift rewards providers capable of integrating multidisciplinary expertise mechanical, materials science, data analytics into bundled service offerings. Customers value single-interface contracts that simplify compliance across multiple jurisdictions and standards. Accordingly, providers that invest in robust certification across ASME, ISO 9001, ISO 14001, and occupational safety standards gain a reputational edge that translates into tender pre-qualification advantages.
Oil And Gas TIC Industry Leaders
SGS SA
Bureau Veritas SA
Intertek Group plc
TÜV SÜD AG
TÜV Rheinland AG
- *Disclaimer: Major Players sorted in no particular order

Recent Industry Developments
- January 2025: SGS and Bureau Veritas entered preliminary merger discussions aimed at creating a USD 33–35 billion TIC leader with combined annual revenue above USD 12 billion.
- January 2025: ACES Group acquired Inspection Technology Company in Saudi Arabia, extending Middle East coverage to support Vision 2030 infrastructure programs.
- December 2024: MISTRAS Group launched “MISTRAS Data Solutions,” a USD 15 million platform investment that unifies predictive analytics, digital twins, and automated reporting.
- November 2024: Fulkrum secured a multi-million-dollar contract to deliver inspection services for Sempra Infrastructure’s Port Arthur LNG Phase 1.


Global Oil And Gas TIC Market Report Scope
| Testing Services |
| Inspection Services |
| Certification Services |
| In-house |
| Outsourced |
| North America | United States | |
| Canada | ||
| Mexico | ||
| South America | Brazil | |
| Argentina | ||
| Rest of South America | ||
| Europe | Germany | |
| United Kingdom | ||
| France | ||
| Italy | ||
| Spain | ||
| Rest of Europe | ||
| Asia-Pacific | China | |
| Japan | ||
| India | ||
| South Korea | ||
| Southeast Asia | ||
| Rest of Asia-Pacific | ||
| Middle East and Africa | Middle East | Saudi Arabia |
| United Arab Emirates | ||
| Turkey | ||
| Rest of Middle East | ||
| Africa | South Africa | |
| Nigeria | ||
| Rest of Africa | ||
| By Service Type | Testing Services | ||
| Inspection Services | |||
| Certification Services | |||
| By Sourcing Type | In-house | ||
| Outsourced | |||
| By Geography | North America | United States | |
| Canada | |||
| Mexico | |||
| South America | Brazil | ||
| Argentina | |||
| Rest of South America | |||
| Europe | Germany | ||
| United Kingdom | |||
| France | |||
| Italy | |||
| Spain | |||
| Rest of Europe | |||
| Asia-Pacific | China | ||
| Japan | |||
| India | |||
| South Korea | |||
| Southeast Asia | |||
| Rest of Asia-Pacific | |||
| Middle East and Africa | Middle East | Saudi Arabia | |
| United Arab Emirates | |||
| Turkey | |||
| Rest of Middle East | |||
| Africa | South Africa | ||
| Nigeria | |||
| Rest of Africa | |||


Key Questions Answered in the Report
How large is the oil and gas testing inspection certification market in 2025?
The market stands at USD 24.36 billion in 2025 and is projected to reach USD 30.28 billion by 2030, reflecting a 4.44% CAGR.
Which service type holds the biggest revenue slice?
Inspection services dominate with a 47.9% share in 2024, driven by demand for advanced non-destructive testing and drone-based surveys.
What region contributes the most revenue?
Asia-Pacific leads with 49.8% of global revenue and also posts the highest 5.1% CAGR through 2030.
What is pushing demand in North America?
Aging pipeline infrastructure and strict methane-emission regulations are driving steady demand for inspection and certification services.
How will digital twins influence third-party inspection providers?
While large operators adopt in-house digital twins, TIC firms remain vital for independent verification and specialized assessments that regulators still require.
Could consolidation reshape competitive dynamics?
A potential SGS–Bureau Veritas merger worth up to USD 35 billion would create the sector’s largest player and could shift pricing and technology investment benchmarks.
Page last updated on:


