Offshore Wind Turbine Market Size and Share
Market Overview
| Study Period | 2020 - 2030 |
|---|---|
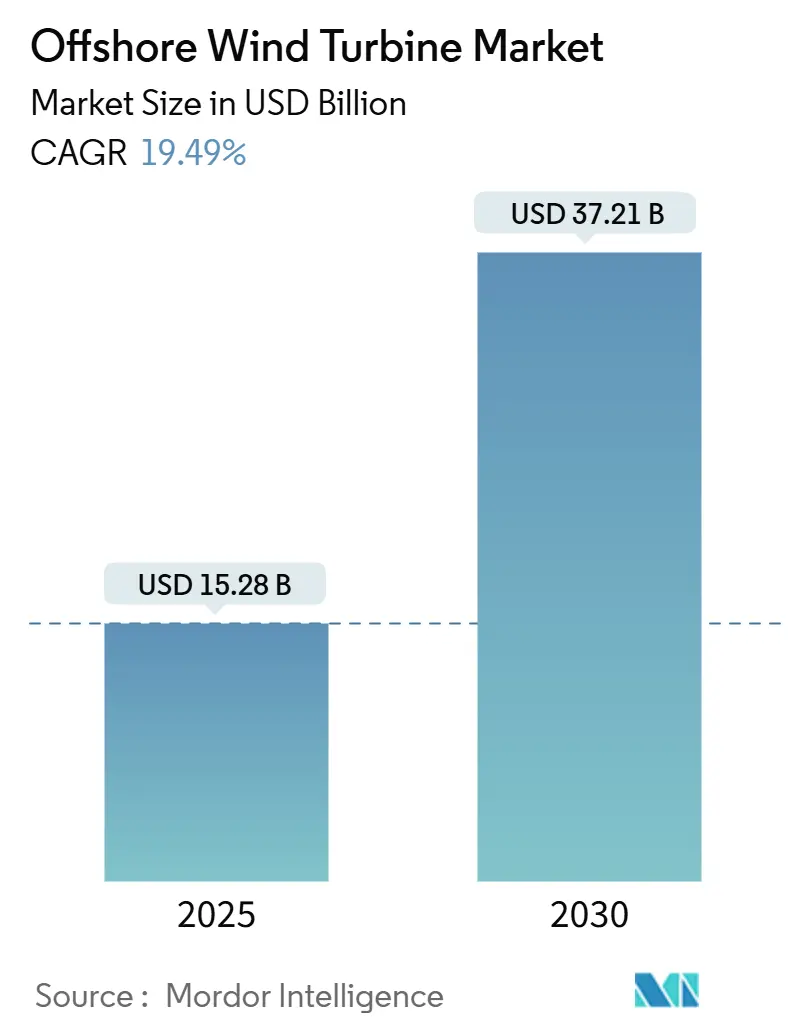
| Market Size (2025) | USD 15.28 Billion |
| Market Size (2030) | USD 37.21 Billion |
| Growth Rate (2025 - 2030) | 19.49% CAGR |
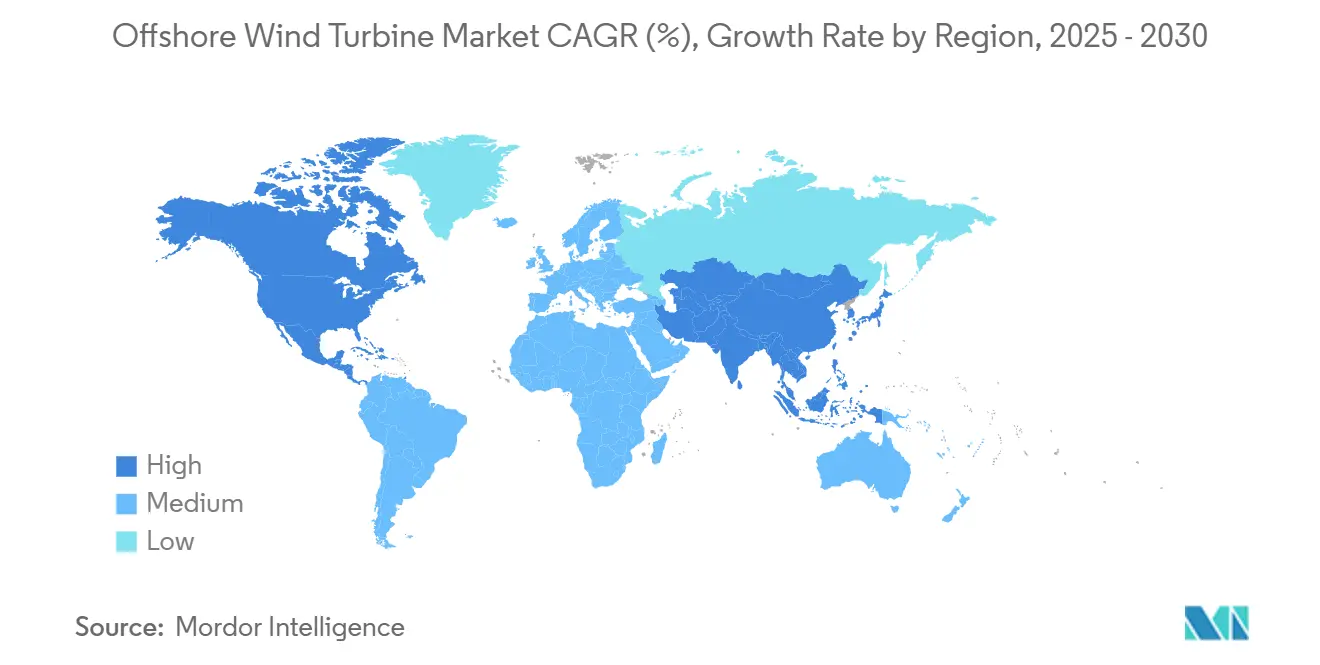
| Fastest Growing Market | North America |
| Largest Market | Europe |
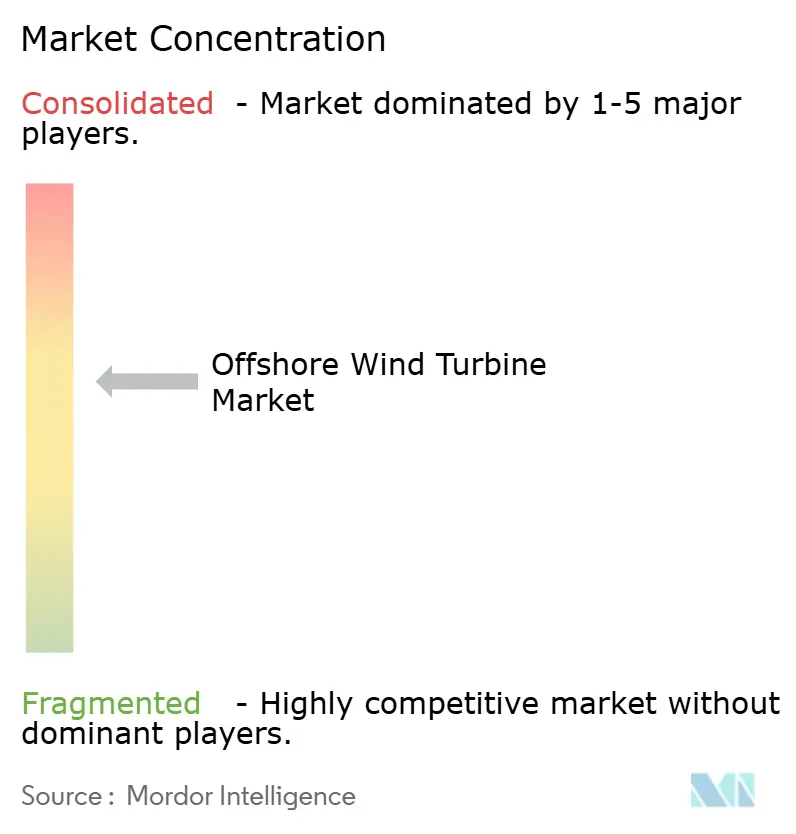
| Market Concentration | Medium |
Major Players *Disclaimer: Major Players sorted in no particular order Image © Mordor Intelligence. Reuse requires attribution under CC BY 4.0. | |
Offshore Wind Turbine Market Analysis by Mordor Intelligence
The Offshore Wind Turbine Market size is estimated at USD 15.28 billion in 2025, and is expected to reach USD 37.21 billion by 2030, at a CAGR of 19.49% during the forecast period (2025-2030).
Falling levelized costs for machines exceeding 15 MW, deeper auction pipelines, and large-scale port upgrades create a strong demand runway. Ultra-large rotor designs increase annual energy production, while digital control systems reduce downtime and enhance revenue. Floating foundations open new deep-water sites, enabling developers to sidestep congested coastal zones. Inflation and grid connection bottlenecks remain near-term hurdles; however, hybrid wind-to-hydrogen hubs and AI-driven operations are unlocking new value pools for the offshore wind turbine market.
Key Report Takeaways
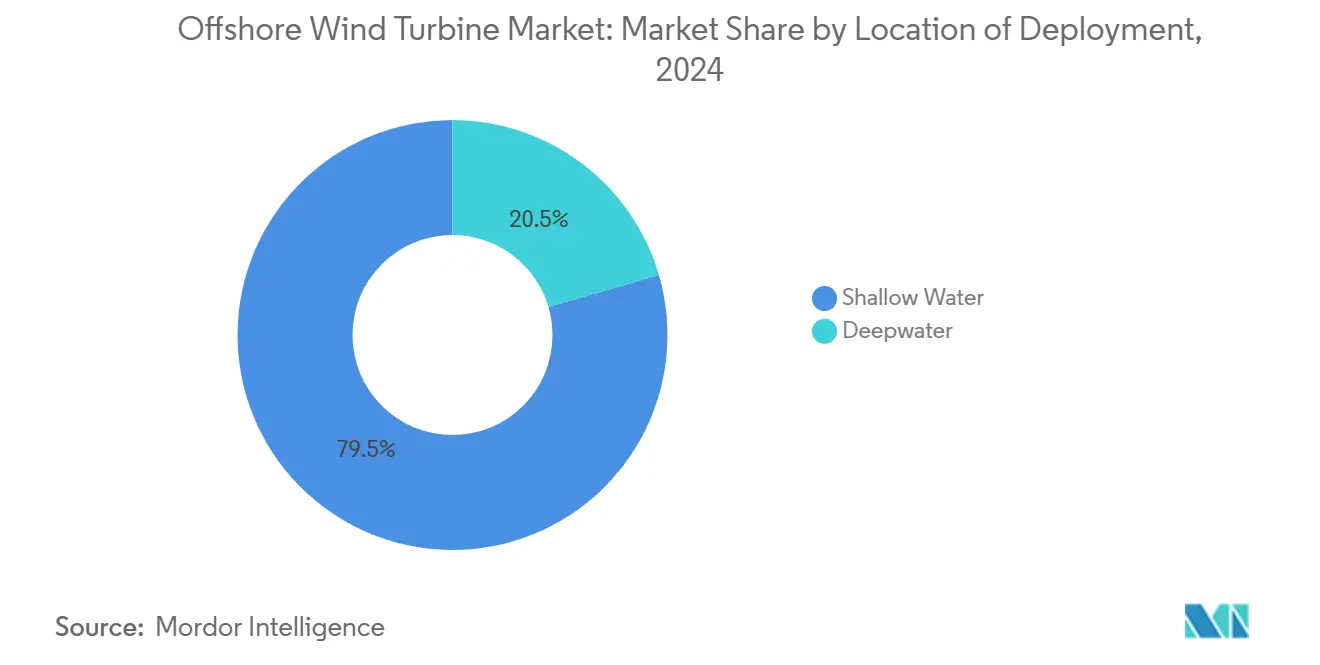
- By location of deployment, shallow-water sites captured 79.5% of the offshore wind turbine market share in 2024, whereas deep-water projects are projected to advance at a 22.6% CAGR through 2030.
- By foundation type, fixed concepts accounted for 61.9% of the offshore wind turbine market size in 2024, while floating platforms were projected to have the fastest forecast CAGR of 24.4% from 2024 to 2030.
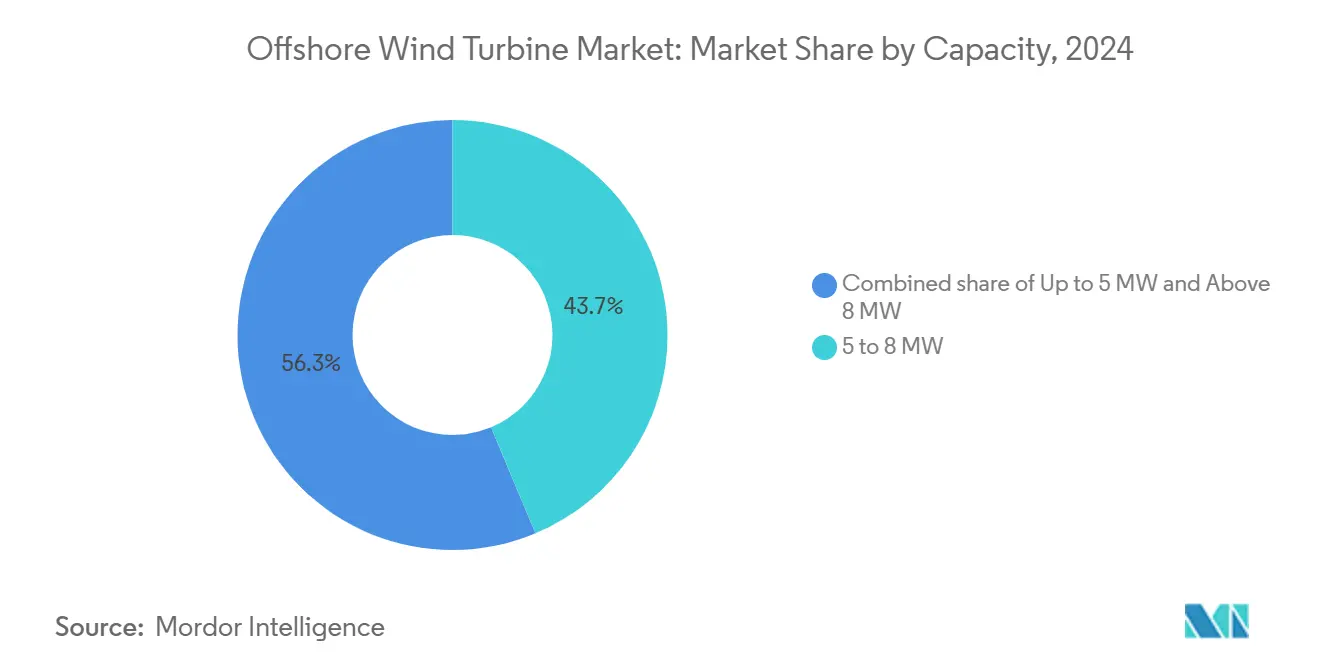
- By capacity, 5 to 8 MW units held a 43.7% share of the offshore wind turbine market size in 2024; turbines above 8 MW are poised to grow at a 28.5% CAGR over the 2025-2030 period.
- By component, rotor blades led with 28.6% share in 2024, whereas power electronics and control systems are set to expand at a 22.7% CAGR.
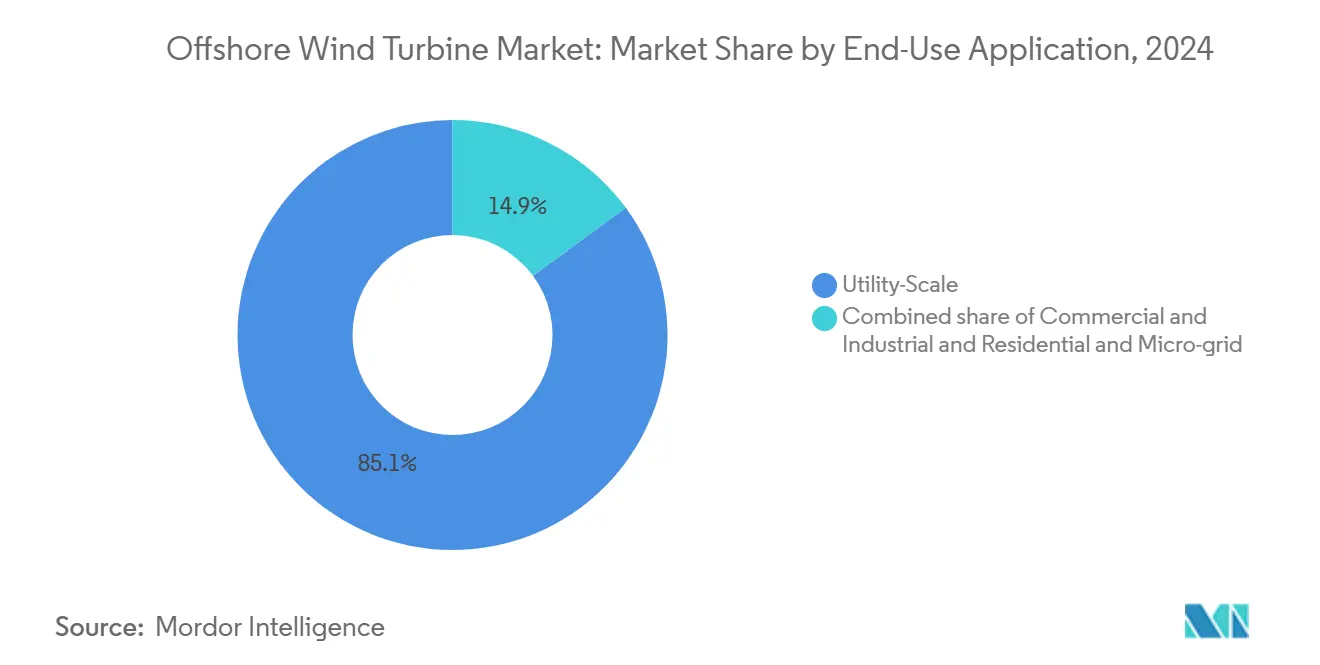
- By end-use application, utility-scale projects dominated with an 85.1% share in 2024; however, commercial and industrial buyers showed the fastest growth at a 26.5% CAGR.
- By geography, Europe held 48.2% of othe offshore wind turbine market share in 2024, while North America is forecast to surge at a 75.2% CAGR to 2030.
Global Offshore Wind Turbine Market Trends and Insights
Drivers Impact Analysis*
| Driver | (~) % Impact on CAGR Forecast | Geographic Relevance | Impact Timeline |
|---|---|---|---|
| Rising energy demand for decarbonised baseload | +4.2% | Global, with peak demand in Europe & Asia-Pacific | Medium term (2-4 years) |
| Rapid cost-down of >15 MW class turbines | +3.1% | Global, led by European & Chinese manufacturers | Short term (≤ 2 years) |
| Government net-zero targets & auction pipelines | +3.8% | Europe, North America, Asia-Pacific core markets | Medium term (2-4 years) |
| National-security push for energy independence | +2.4% | North America, Europe, with spillover to APAC | Long term (≥ 4 years) |
| Hybrid offshore-to-X hubs (wind-to-hydrogen) | +1.7% | Europe, Australia, early gains in North Sea regions | Long term (≥ 4 years) |
| AI-driven O&M productivity gains | +1.3% | Global, with early adoption in mature markets | Short term (≤ 2 years) |
| Source: Mordor Intelligence | |||
Rising Energy Demand for Decarbonized Baseload
Electric utilities are adding offshore wind capacity to offset the retirement of thermal assets and to meet net-zero mandates. Newly installed arrays achieved an average capacity factor of 41% in 2024, providing grid operators with a steadier renewable supply. Recorded procurement rounds scheduled for 2025 will increase contracted volumes, and industrializing economies in the Asia-Pacific plan sizable offshore pipelines to reinforce energy security. The converging goals of reliability and carbon mitigation assure sustained policy backing for the offshore wind turbine market.
Rapid Cost-Down of above 15 MW Class Turbines
The commercial rollout of 15 MW platforms is reshaping project economics. Vestas secured more than 7 GW in firm orders for the V236-15 MW model, reducing foundation counts per gigawatt and trimming installation time. Siemens Gamesa is testing 21-23 MW prototypes that promise further yield gains. Supply-chain scale-up in Europe and Asia leverages new blade and nacelle factories, reinforcing the downward cost trajectory and heightening competitiveness for the offshore wind turbine market.
Government Net-Zero Targets & Auction Pipelines
Eight U.S. states are expected to underwrite 45.73 GW of offshore wind by 2040, while the UK aims for up to 50 GW by 2030.[1]NREL, “U.S. Offshore Wind Supply Chain Roadmap 2024,” nrel.gov Germany’s EUR 3 billion auction for 2.5 GW and Denmark’s capacity award, which could power the entire country, reflect a robust appetite among developers. Coordinated auction calendars across continents provide manufacturers with multi-year visibility, encouraging capital allocation toward larger component plants that serve the offshore wind turbine market.
National-Security Push for Energy Independence
Supply-chain shocks spurred governments to localize key parts. The United States has directed more than USD 10 billion toward domestic blade, tower, and cable facilities since 2021. The Crown Estate launched a GBP 15 million accelerator to bolster the United Kingdom’s manufacturing depth.[2]The Crown Estate, “Supply Chain Accelerator Launch 2025,” thecrownestate.co.uk Similar programs appear in the Asia-Pacific region, balancing China’s export leadership and creating resilient procurement paths for future offshore wind turbine market growth.
Restraints Impact Analysis*
| Restraint | (~) % Impact on CAGR Forecast | Geographic Relevance | Impact Timeline |
|---|---|---|---|
| Inflation-driven capex & financing headwinds | -2.8% | Global, with acute impact in emerging markets | Short term (≤ 2 years) |
| Grid-connection bottlenecks & HVDC backlog | -2.4% | Europe, North America, with spillover to Asia-Pacific | Medium term (2-4 years) |
| Seabed-use & biodiversity permitting delays | -2.1% | Europe, North America, Australia coastal regions | Medium term (2-4 years) |
| Global monopile & cable-core supply crunch | -1.8% | Global, with peak constraints in Asia-Pacific manufacturing | Short term (≤ 2 years) |
| Source: Mordor Intelligence | |||
Inflation-Driven Capex and Financing Headwinds
Equipment makers face higher steel and logistics costs, while rising interest rates inflate project hurdle rates. Ørsted shelved the Hornsea 4 plan after costs outran contracted revenues.[3]Ørsted, “Hornsea 4 Project Update 2024,” orsted.com Emerging markets struggle to secure hard-currency financing, and developers increasingly rely on state loan guarantees to maintain their build-out schedules.
Grid-Connection Bottlenecks and HVDC Backlog
Lead times for 320 kV subsea cables exceed three years. LS Cable & System is investing USD 200 million in a Virginia plant, but the first spools are not expected to ship until after 2027. Delays force phased commissioning, tempering near-term additions to the offshore wind turbine market.
*Our forecasts treat driver/restraint impacts as directional, not additive. The impact forecasts reflect baseline growth, mix effects, and variable interactions.
Segment Analysis
By Location of Deployment: Deep-Water Uptick Gains Pace
Shallow arrays accounted for 79.5% of the offshore wind turbine market size in 2024, primarily due to the presence of mature jack-up vessel fleets and lower development risks. A growing shortage of coastal sites pushes developers farther offshore, sending deep-water installations up at a 22.6% CAGR. Hywind Tampen achieved capacity factors above 50%, validating the economics of floating wind in harsher seas.
Deeper sites offer stronger, steadier winds that lift revenue. BW Ideol’s factory-standard hull aims to deliver one floater per week, thereby shrinking lead times. Spain earmarked nineteen deep-water zones that target up to 3 GW by 2030, illustrating rising state support for floating schemes.


By Foundation Type: Floating Designs Challenge Fixed Dominance
Fixed structures held a 61.9% market share of the offshore wind turbine market in 2024, thanks to decades of experience with monopiles and jackets. Floating platforms, however, are expected to experience a 24.4% CAGR as industrialization reduces costs. The European Investment Bank has begun financing commercial floater arrays, signaling lender confidence.
Technip Energies operates the PAREF anchor program to mitigate environmental impact, while Aker Solutions unveiled three floater variants to suit diverse metocean conditions. Fixed foundations will remain prevalent in shallower basins, but cost parity is looming as floater supply chains reach volume production.
By Capacity: Ultra-Large Machines Redefine Benchmarks
The 5-8 MW class accounted for 43.7% of the offshore wind turbine market size in 2024; however, turbines above 8 MW are expected to post a 28.5% CAGR from 2024 to 2030. The average nameplate capacity reached 9.8 MW in 2024, and 15 MW platforms are now entering serial production.
A greater swept area raises energy output and reduces the number of foundations per gigawatt. Siemens Gamesa’s 21 MW prototype aims for a 30% increase in annual generation. Sub-5 MW units will transition to niche repower roles, solidifying a long-term shift toward ultra-large rotors within the offshore wind turbine market.
By Component: Electronics Surge Beside Blade Leadership
Rotor blades retained a 28.6% share, reflecting the demand for larger diameters and advanced composites. Digital control modules and power electronics are experiencing the fastest growth at a 22.7% CAGR, as AI algorithms optimize pitch and yaw to maximize revenue.[4]DNV, “Energy Transition Outlook 2024,” dnv.com
Nacelles and drivetrains experience modest gains through the use of permanent-magnet generators, while segmented towers mitigate transport limitations. Component standardization trims O&M budgets and accelerates serial output across the offshore wind turbine market.
By End-Use Application: Commercial Buyers Scale Up
Utility fleets commanded an 85.1% share in 2024; however, corporate renewable power agreements are expected to spur a 26.5% CAGR in the commercial segment. Technology firms and heavy-industry players pursue direct offtake to meet science-based targets. Smaller floating arrays near industrial clusters can bypass grid constraints, broadening customer diversity for the offshore wind turbine market.
Geography Analysis
Europe anchored 48.2% of the offshore wind turbine market share in 2024. Two decades of supportive policy built clustered supply chains around the North Sea. Germany’s EUR 3 billion bid round and the UK’s 5.3 GW award highlight persistent momentum. The Netherlands plans to tender 4 GW in Q3 2025, while Denmark aims to achieve capacity equal to national demand. Innovation leadership extends to companies like OranjeWind, which combines wind energy with green hydrogen.
North America records the steepest curve with a 75.2% CAGR to 2030. State commitments of 45.73 GW and USD 10 billion in local-content funding, along with port upgrades such as the Mid-Atlantic Logistics Hub, propel scale-up.[5]Port of Virginia, “Mid-Atlantic Offshore Wind Logistics Hub,” portofvirginia.com California aims to develop 25 GW of floating wind energy by 2045, creating a vast Pacific pipeline, even as a temporary federal leasing pause introduces uncertainty.
Asia-Pacific continues as a manufacturing powerhouse. China accounted for 65% of global capacity additions in 2024, while South Korea’s 87-trillion-won plan and Japan’s Wind Hunter project push next-gen applications. Emerging Latin American tenders in Brazil and Colombia broaden the global spread of the offshore wind turbine market.

Competitive Landscape
European OEMs maintain technical leadership, but Chinese rivals leverage cost and volume advantages. Vestas booked EUR 17.3 billion in revenue in 2024 and a record 17 GW intake, yet scaling its V236 across multiple factories strains margins. Goldwind, Envision, and Mingyang advanced export sales in H1 2024 using 18–20 MW models at sharp pricing.
Strategic tie-ups proliferate. BP and JERA formed a 13 GW development venture, while Saipem seeks to merge with Subsea 7 to create a EUR 20 billion installation giant. Service differentiation is increasingly hinging on AI-enabled diagnostics and floating-platform patents, as evidenced by SeaTwirl’s divisible turbine receiving European IP protection.
Inflation and warranty provisions prompted Siemens Gamesa to forecast break-even only by 2026, signaling squeeze risks. Players with robust balance sheets and digital service portfolios are better placed to weather volatility. Market share shifts will hinge on the execution of mega-project backlogs and localized production strategies within the offshore wind turbine market.
Offshore Wind Turbine Industry Leaders
Siemens Gamesa Renewable Energy SA
Vestas Wind Systems AS
Goldwind Science & Technology Co., Ltd.
Ming Yang Smart Energy Group Limited
GE Vernova Inc.
- *Disclaimer: Major Players sorted in no particular order

Recent Industry Developments
- April 2025: In a move to bolster energy independence in Europe, Iberdrola has secured a strategic partnership with Kansai, Japan's second-largest electricity provider and a major player in Asia.
- March 2025: Ørsted and Nuveen Infrastructure have completed final testing for the Gode Wind 3 Offshore Wind Farm, marking the project's full commissioning.
- December 2024: JERA and bp have unveiled a new joint venture, JERA Nex bp, with ambitions to develop and manage offshore wind projects targeting a cumulative capacity of 13 GW by 2030.
- October 2024: Ørsted divested a 12.45% stake in four UK offshore wind farms to Brookfield for a hefty GBP 1.745 billion.


Global Offshore Wind Turbine Market Report Scope
Offshore wind turbines operate by transforming the kinetic energy in the wind over water into rotational kinetic energy used to generate electricity. Turbines can be installed both in ocean waters and inland lakes and are typically around 80-100 meters high with a rotor blade diameter of 20-50 meters.
The offshore wind turbine market is segmented by location, foundation type, capacity, and geography (North America, Europe, Asia-Pacific, South America, and the Middle East and Africa). By location, the market is segmented into shallow water and deep water. By foundation type, the market is segmented into fixed foundation and floating foundation. By capacity, the market is segmented into less than 5 MW and above 5 MW.
The report offers the market size and forecasts for offshore wind turbines in revenue (USD) for all the above segments.
For each segment, the market sizing and forecasts have been done based on revenue (USD).
| Shallow Water |
| Deepwater |
| Fixed Foundation |
| Floating Foundation |
| Up to 5 MW |
| 5 to 8 MW |
| Above 8 MW |
| Rotor Blades |
| Nacelle and Drivetrain |
| Generator |
| Tower |
| Power-Electronics and Control |
| Utility-Scale |
| Commercial and Industrial |
| Residential and Micro-grid |
| North America | United States |
| Rest of North America | |
| Europe | Germany |
| France | |
| United Kingdom | |
| Spain | |
| NORDIC Countries | |
| Italy | |
| Netherlands | |
| Belgium | |
| Rest of Europe | |
| Asia-Pacific | China |
| India | |
| Japan | |
| South Korea | |
| Vietnam | |
| Rest of Asia-Pacific | |
| South America | Brazil |
| Argentina | |
| Rest of South America | |
| Middle East and Africa | Saudi Arabia |
| United Arab Emirates | |
| South Africa | |
| Rest of Middle East and Africa |
| By Location of Deployment | Shallow Water | |
| Deepwater | ||
| By Foundation Type | Fixed Foundation | |
| Floating Foundation | ||
| By Capacity | Up to 5 MW | |
| 5 to 8 MW | ||
| Above 8 MW | ||
| By Component | Rotor Blades | |
| Nacelle and Drivetrain | ||
| Generator | ||
| Tower | ||
| Power-Electronics and Control | ||
| By End-Use Application | Utility-Scale | |
| Commercial and Industrial | ||
| Residential and Micro-grid | ||
| By Geography | North America | United States |
| Rest of North America | ||
| Europe | Germany | |
| France | ||
| United Kingdom | ||
| Spain | ||
| NORDIC Countries | ||
| Italy | ||
| Netherlands | ||
| Belgium | ||
| Rest of Europe | ||
| Asia-Pacific | China | |
| India | ||
| Japan | ||
| South Korea | ||
| Vietnam | ||
| Rest of Asia-Pacific | ||
| South America | Brazil | |
| Argentina | ||
| Rest of South America | ||
| Middle East and Africa | Saudi Arabia | |
| United Arab Emirates | ||
| South Africa | ||
| Rest of Middle East and Africa | ||


Key Questions Answered in the Report
What is the current offshore wind turbine market size?
The offshore wind turbine market size reached USD 15.28 billion in 2025 and is projected to hit USD 37.21 billion by 2030.
Which region will grow the fastest through 2030?
North America is expected to post a 75.2% CAGR, boosted by 45.73 GW of state-level commitments and major port upgrades.
How fast are floating foundations gaining ground?
Floating platforms are forecast to expand at a 24.4% CAGR to 2030, far outpacing fixed-foundation growth.
Why are ultra-large turbines important?
Turbines above 15 MW deliver higher energy yield and reduce the number of foundations, lowering levelized costs and improving project returns.
What are the main constraints facing new offshore wind projects?
Inflation-linked capex, grid-connection delays, and limited subsea cable capacity are the key near-term bottlenecks.
How is AI improving offshore wind operations?
Machine-learning analytics predict component failures early, cutting unplanned downtime by up to 30% and enhancing asset availability.
Page last updated on:


