Market Overview
| Study Period | 2021 - 2031 |
|---|---|
| Forecast Data Period | 2026 - 2031 |
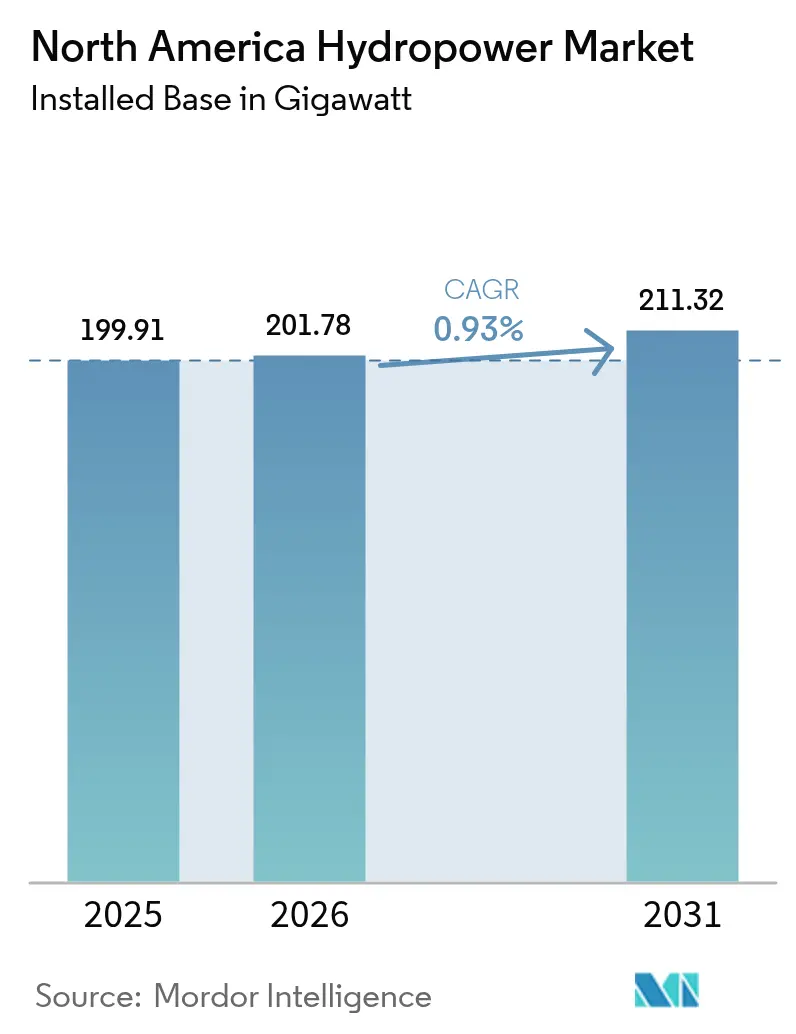
| Base Year Market Size (2025) | 199.91 gigawatt |
| Market Volume (2026) | 201.78 gigawatt |
| Market Volume (2031) | 211.32 gigawatt |
| Growth Rate (2026 - 2031) | 0.93% CAGR |
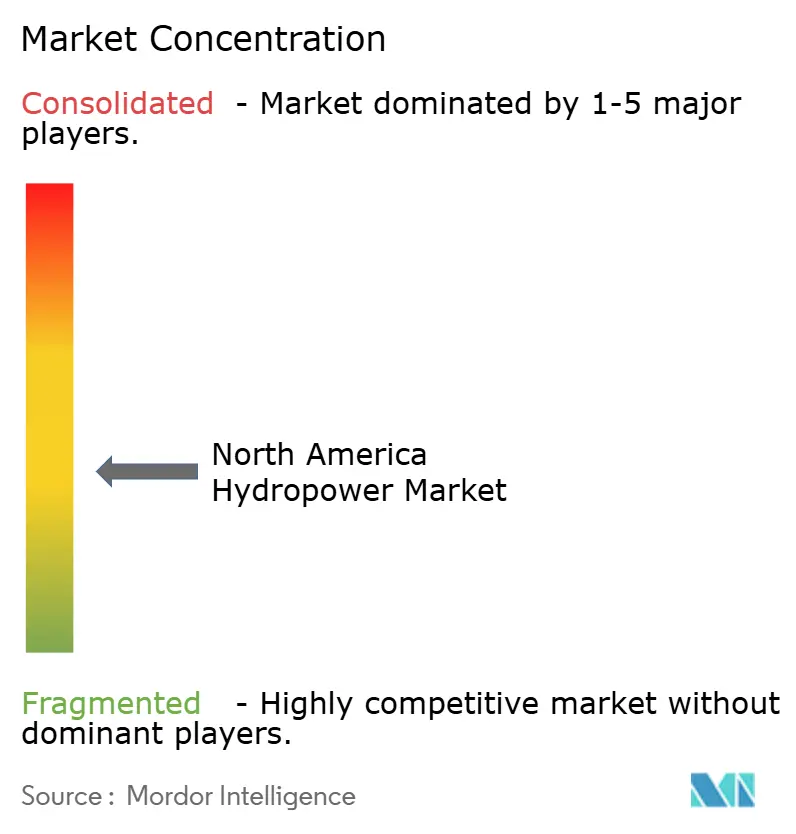
| Market Concentration | Medium |
Major Players *Disclaimer: Major Players sorted in no particular order Image © Mordor Intelligence. Reuse requires attribution under CC BY 4.0. | |
North America Hydropower Market Analysis by Mordor Intelligence
The North America Hydropower Market size was valued at 199.91 gigawatt in 2025 and estimated to grow from 201.78 gigawatt in 2026 to reach 211.32 gigawatt by 2031, at a CAGR of 0.93% during the forecast period (2026-2031).
Mature asset bases and supportive federal spending channel growth toward modernization rather than ground-up construction. Unprecedented allocations under the Bipartisan Infrastructure Law and the Inflation Reduction Act are shifting investment priorities toward turbine upgrades, dam safety, and digital controls that squeeze more output from the existing fleet. Grid operators are leaning on hydro flexibility to complement record additions of wind and solar, while cross-border transmission buildouts keep Canadian surplus flowing south. Competitive dynamics are evolving as independent power producers deploy capital faster than vertically integrated utilities, especially in pumped-storage and small-hydro niches. Together, these factors maintain steady expansion even as permitting hurdles continue to slow greenfield developments across the North America hydropower market.
Key Report Takeaways
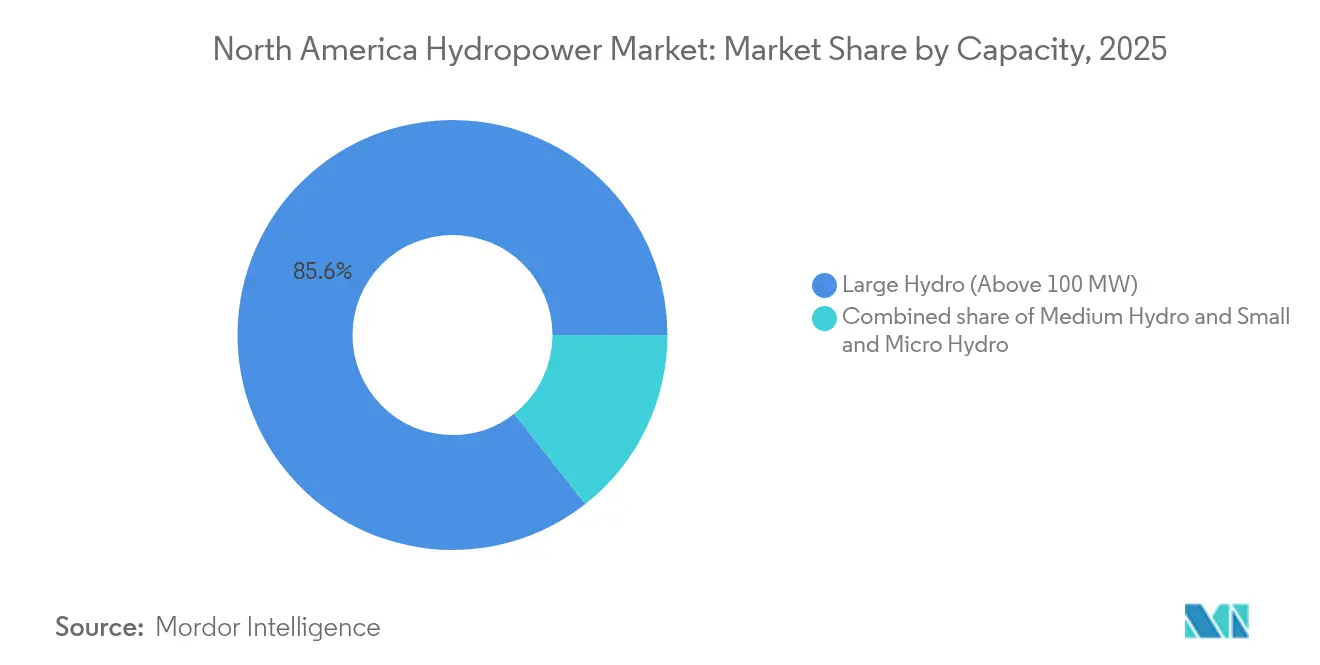
- By capacity, large installations above 100 MW held 85.60% of the North America hydropower market share in 2025, whereas small and micro plants below 10 MW are forecast to grow at a 3.28% CAGR through 2031.
- By technology, reservoir-based systems accounted for 69.20% of the North America hydropower market size in 2025, while pumped-storage projects are set to expand at a 4.75% CAGR.
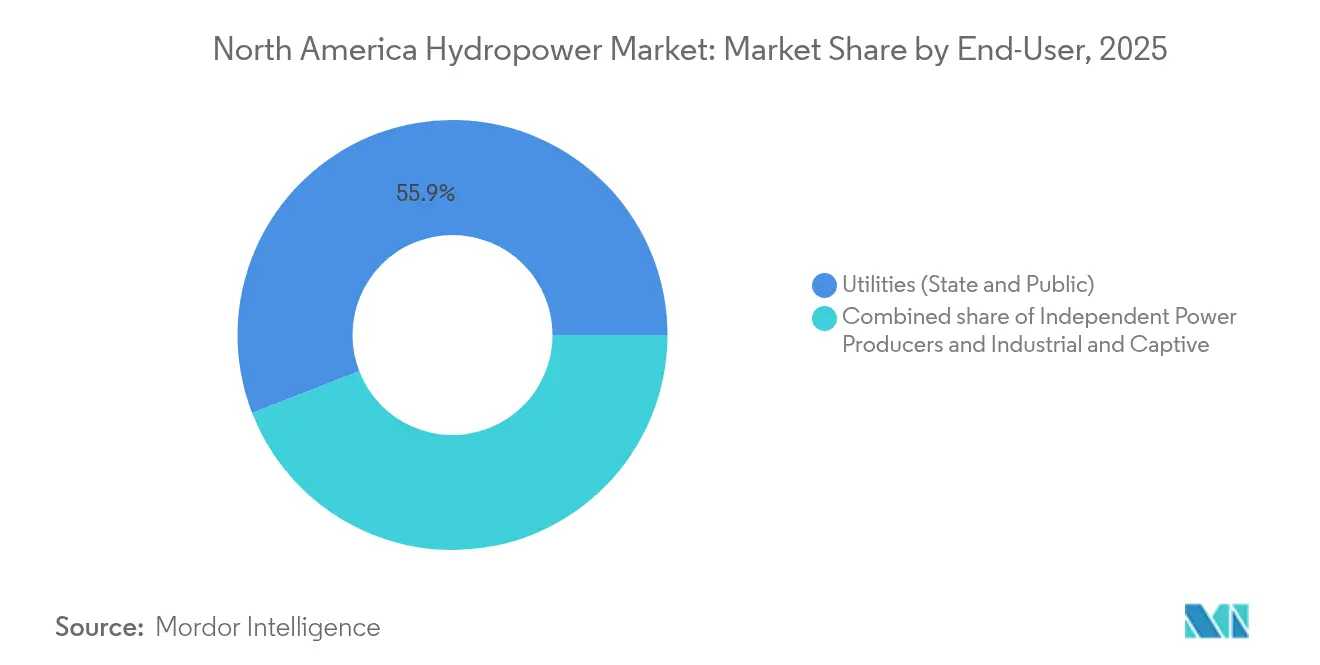
- By end user, state and public utilities retained 55.90% of the North America hydropower market size in 2025, yet independent power producers will post the fastest uptick at 3.98% CAGR to 2031.
- By country, the United States commanded 50.80% of the North America hydropower market share in 2025, whereas Mexico represents the fastest-growing geography at 3.68% CAGR.
Note: Market size and forecast figures in this report are generated using Mordor Intelligence’s proprietary estimation framework, updated with the latest available data and insights as of 2026.
North America Hydropower Market Trends and Insights
Drivers Impact Analysis*
| Driver | (~) % Impact on CAGR Forecast | Geographic Relevance | Impact Timeline |
|---|---|---|---|
| Modernization funding via U.S. BIL & IRA incentives | 0.40% | United States, spillover to cross-border projects | Medium term (2-4 years) |
| Canada-to-U.S. clean-power import contracts | 0.20% | Eastern Canada & Northeastern U.S., Great Lakes region | Long term (≥ 4 years) |
| PSH surge to balance growing wind & solar | 0.15% | Global North America, concentrated in grid-constrained regions | Medium term (2-4 years) |
| Digital twin retrofits lifting plant efficiency | 0.10% | Global, early adoption in large utility-scale facilities | Short term (≤ 2 years) |
| Non-powered-dam retrofit pipeline unlocking >10 GW | 0.10% | United States, concentrated in Southeast & Pacific Northwest | Long term (≥ 4 years) |
| Western drought resiliency megaproject spending | 0.05% | Western United States, Colorado River basin states | Medium term (2-4 years) |
| Source: Mordor Intelligence | |||
Modernization Funding via U.S. BIL & IRA Incentives
Federal law released USD 430 million in 2024 strictly for hydro refurbishments, with 30% investment tax credits covering qualified mechanical and digital upgrades. Owners are redirecting capex from new dams to higher-efficiency runners, generator rewinds, and dam-safety retrofits that extend useful life by 30 years. Domestic-content provisions embedded in the legislation spur local turbine manufacturing, reducing supply-chain exposure to overseas vendors. These rules also raise component prices, requiring utilities to sharpen project-level returns through advanced performance analytics. The funding pipeline, therefore, underwrites the near-term momentum of the North America hydropower market, especially at legacy multipurpose sites that anchor regional grid reliability.
Canada-to-U.S. Clean-Power Import Contracts
Long-term power purchase agreements now funnel 1,200 MW of Québec hydro to Massachusetts via the New England Clean Energy Connect line, locking in 20 years of predictable cash flows.[1]Hydro-Québec, “NECEC Contract Overview,” hydroquebec.com Seasonal flow surpluses north of the border dovetail with winter demand peaks in New England, enhancing grid adequacy without additional U.S. reservoir buildout. The contracts justify further upstream watershed projects in Québec while slashing fossil peaker dispatch in New England. They also underpin bilateral investments in transmission corridors that strengthen continental trading depth across the North America hydropower market.
PSH Surge to Balance Growing Wind & Solar
FERC cleared 2,800 MW of pumped-storage capacity in 2024, the largest single-year approval since the 1990s. Variable-speed turbines now push round-trip efficiencies past 85%, making PSH cost-competitive for discharge durations beyond eight hours. Closed-loop hillside reservoirs sidestep river-connectivity objections that have historically slowed hydro licensing. As wind and solar covered 28% of U.S. generation in 2024, grid planners elevated PSH as a dispatchable tool for inertia, ramping, and frequency regulation, cementing its role inside the North America hydropower market.
Digital-Twin Retrofits Lifting Plant Efficiency
Oak Ridge National Laboratory’s RAPID-RUNNERS pilot recorded 15% generation gains at aging stations by adjusting blade pitch and water flow in real time through cloud-based simulation twins.[2]Oak Ridge National Laboratory, “RAPID-RUNNERS Final Report,” ornl.gov Operators apply machine-learning models to maintenance cycles, reducing forced-outage hours and spare-part inventories. Utilities thereby capture extra megawatt-hours without civil works expenditure, accelerating payback on sensor deployments. These early results encourage wider rollouts at fleet-scale, particularly across large baseload assets that dominate the North America hydropower market size.
Multi-Year FERC Licensing Timelines & Litigation Risk
New projects averaged 7.2 years in the federal queue during 2024, while 40% of filings faced court challenges that stretched approvals by another two to three years. The uncertainty inflates interest during construction costs and complicates revenue modeling for investors. Pumped-storage proposals are disproportionately affected because environmental assessments must address both water reuse and site alterations. Developers therefore pivot toward brownfield upgrades, diverting fresh megawatt ambitions away from the North America hydropower market’s greenfield space.
Aging Civil Infrastructure Above 50 Years
Two-thirds of U.S. hydro structures require significant rehabilitation by 2034, with aggregate capex needs topping USD 80 billion. Spillway concrete, penstocks, and switchyard components approach the end of engineered life, forcing utilities to prioritize safety over capacity gains. Capital reallocation toward dam stabilization trims financial headroom for expansion, moderating growth in the North America hydropower market size even amid supportive policy.
*Our forecasts treat driver/restraint impacts as directional, not additive. The impact forecasts reflect baseline growth, mix effects, and variable interactions.
Segment Analysis
By Capacity: Large Installations Drive Modernization
Installations above 100 MW delivered the bulk of continental output and captured 85.60% of the North America hydropower market share in 2025. These assets benefit most from federal modernization dollars, as one percentage-point efficiency gain yields gigawatt-hour scale dividends. Variable-speed runners, generator rewinds, and digital twins combine to lift annual energy production without reservoir expansion, aligning with stringent environmental norms. Medium plants between 10-100 MW provide sub-regional reliability, often tied to industrial off-takers that value 24/7 baseload. Revenue stacking from capacity, energy, and ancillary services buttresses refurbishment economics, anchoring their steady, although slower, growth trajectory.
Small and micro facilities below 10 MW headline the growth narrative at a 3.28% CAGR to 2031, aided by expedited FERC review and state-level feed-in tariffs. Conversions of non-powered dams supply shovel-ready sites complete with civil works, slashing payback periods. Modular equipment packages manufactured domestically now reach 92% average efficiency, rivaling larger units. Rural cooperatives and municipal utilities adopt these distributed plants to hedge against transmission congestion and wildfire-related outages. Such decentralization pushes the North America hydropower market toward a more diversified asset mix, mitigating single-point failure risks across the grid.


By Technology: Pumped Storage Gains Grid Integration Priority
Reservoir-based systems anchored 69.20% of the North America hydropower market size in 2025, delivering firm water, flood control, and recreational benefits alongside electricity. Upgrades focus on aerating turbines to enhance dissolved oxygen, satisfying water-quality permits without sacrificing efficiency. Run-of-river designs remain attractive where river gradients allow natural flow, minimizing land inundation, yet provide less dispatch flexibility during peak load swings.
Pumped-storage stands out as the fastest-growing slice with a projected 4.75% CAGR, stimulated by 12-hour discharge profiles that batteries cannot match economically beyond eight hours. Closed-loop projects like the 2,800 MW Goldendale facility avoid direct river interaction, easing ecological assessments and appealing to investors hungry for long-duration storage plays inside the North America hydropower market. Meanwhile, conduit and in-stream micro systems carve a niche in irrigation districts and water-supply pipelines, benefiting from negligible incremental environmental footprints and streamlined permitting.
By End User: Independent Producers Challenge Utility Dominance
Public and state-owned entities still accounted for 55.90% of the North America hydropower market size in 2025, leveraging legacy ownership of major river impoundments. Their investment strategies center on safety retrofits, often financed through rate recovery mechanisms. However, independent power producers (IPPs) are advancing at 3.98% CAGR as wholesale markets in PJM, ISO-NE, and ERCOT prize flexible, carbon-free dispatch. IPPs such as Brookfield Renewable Partners optimize multi-asset portfolios, arbitraging hourly price spreads, and monetize ancillary service revenues that vertically integrated utilities seldom maximize.
Industrial self-generators occupy a smaller but strategic lane, using captive hydro to insulate against volatile spot prices and decarbonize production lines. Food processing, aluminum smelting, and data centers increasingly contract behind-the-meter hydro to lock in emission-free baseload. The widening mix of owners diversifies operational philosophies and capital sources, accelerating innovation across the North America hydropower market.
Geography Analysis
The United States continues to anchor the North America hydropower market, wielding 50.80% of regional capacity in 2025 on the strength of Pacific Northwest giants such as Grand Coulee and Chief Joseph. Bipartisan Infrastructure Law funding elevated refurbishment pipelines, with USD 430 million earmarked in 2024 for turbine overhauls, fish ladders, and cyber-secure control upgrades. FERC’s fast-track license pathway for sub-10 MW plants trims paperwork to under 18 months, seeding a distributed-generation wave across rural Appalachia and the Midwest. Simultaneously, prolonged drought sliced California reservoir levels to 40% below historic norms, triggering emergency gas-peaking dispatch and spurring calls for flexible storage. The U.S. Army Corps’ inventory of non-powered dams surfaced 10 GW of ready conduits for small hydro, positioning the country for incremental growth without new impoundments.
Canada contributes roughly 38.20% of continental capacity in 2025 and exports nearly 35 TWh south each year, illustrating its outsized grid-balancing role in the North America hydropower market. Hydro-Québec’s 36 GW fleet benefits from high annual runoff and glaciated storage, allowing firm deliveries during U.S. winter peaks. Ontario Power Generation’s CAD 2.8 billion refurbishment at Sir Adam Beck extends productive life by three decades while installing fish-friendly runners and AI-driven vibration monitoring. British Columbia’s 1,100 MW Site C build progresses toward 2028 completion, poised to service industrial electrification tied to LNG export terminals and electric-vehicle adoption on the West Coast.
Mexico remains the growth pacesetter thanks to energy-sector reforms and an underutilized 50 GW technical potential identified by the International Renewable Energy Agency. CFE’s 2024 modernization package installs digital governors that raise plant capacity 12% without additional water withdrawals, aligning with the nation’s 35% clean-power target. Three new run-of-river stations in Chiapas and Oaxaca add 800 MW by 2028, aided by streamlined environmental impact regulations that shorten approval cycles to two years. Cross-border ties with Texas and California promise merchant export avenues during seasonal surpluses, fostering capital inflows and technology transfer that further entwine Mexico within the North America hydropower market.
Competitive Landscape
Market structure exhibits moderate concentration: the five largest owners control roughly 62% of installed capacity, placing the competitive index at 6 on a 10-point scale. Asset-heavy utilities such as BC Hydro, Tennessee Valley Authority, and U.S. Bureau of Reclamation focus on modernization rather than expansion, reflecting public-service mandates and fiscal prudence. IPPs demonstrate faster asset turnover; Brookfield Renewable Partners’ USD 1.2 billion purchase of FirstLight Power in 2024 added 1.5 GW of Hydro and pumped-storage to its portfolio, underscoring institutional appetite for flexible renewable assets.[3]Brookfield Renewable Partners, “Q3 2024 Investor Presentation,” brookfieldrenewable.comPattern Energy and NextEra position pumped-storage pipelines to monetize capacity and ancillary services that battery systems cannot yet match for multi-hour duration.
OEM competition intensifies as GE Vernova, Voith, and Andritz invest in variable-speed turbine design, sealing large refurbishment contracts across the continent. GE Vernova captured a USD 180 million order at Manitoba’s Keeyask project, while Voith installed new runners at Grand Coulee, netting 8% efficiency gains without structural alterations. Patent filings related to hydro digitalization climbed 25% year on year in 2024, led by sensor fusion and AI-based anomaly detection, signaling the sector’s embrace of Industry 4.0 within the North America hydropower market.
Niche disruptors target micro-hydro kits and conduit installations, leveraging modular fabrication to cut field time. Firms like Natel Energy deploy fish-safe turbines in irrigation canals across the West, exploiting water rights exemptions that large dams cannot access. Meanwhile, civil-engineering specialists carve a role retrofitting aging penstocks and spillways, a segment buoyed by USD 80 billion in required upgrades, spotlighted by the American Society of Civil Engineers. Altogether, strategic emphasis pivots from capacity race to asset optimization, reinforcing Hydro’s role as the backbone of the North America hydropower market amid the solar-plus-storage boom.
North America Hydropower Industry Leaders
Hydro-Québec
Ontario Power Generation
Tennessee Valley Authority
BC Hydro
Brookfield Renewable Partners
- *Disclaimer: Major Players sorted in no particular order

Recent Industry Developments
- October 2025: The government announced nearly $17 million in funding for two Indigenous-led hydropower projects in Quebec: the 7.5 MW Innavik Remote Hydro Project, Canada’s largest off-grid hydropower facility, and the planned 17 MW Matawak project at the Matawin dam.
- June 2025: GE Vernova Inc. announced it has secured an order from Rio Tinto to upgrade eight turbine-alternator units at the Isle Maligne hydropower plant in Saguenay-Lac-Saint-Jean, Quebec. The modernization of the nearly 100-year-old plant will enhance performance and extend the units’ lifetime, supporting energy supply to Rio Tinto’s five low-carbon aluminum smelters in the region.
- January 2025: The Ontario government announced pre-development of a 1 GW / 11 GWh pumped hydro project in Meaford, investing up to CA$285 million. Co-developed by TC Energy and the Saugeen Ojibway Nation, the project will store water from Georgian Bay to generate low-carbon electricity during peak demand.
- September 2024: The U.S. DOE will provide up to $430 million to 293 hydroelectric projects in 33 states for grid resiliency, dam safety, and environmental upgrades, leveraging a total of $2.8 billion with private investment. The projects, averaging 79 years old, aim to modernize aging infrastructure while protecting jobs and contractors.


North America Hydropower Market Report Scope
Hydropower, or hydroelectric power, is one of the oldest and most significant renewable energy sources. It uses the natural flow of moving water to generate electricity. For each segment, the market sizing and forecasts have been done based on installed capacity in gigawatts (GW).
The North American hydropower market report includes:
By Capacity
| Large Hydro (Above 100 MW) |
| Medium Hydro (10 to 100 MW) |
| Small and Micro Hydro (Below 10 MW) |
By Technology
| Reservoir-Based |
| Run-of-River |
| Pumped-Storage |
| In-Stream and Micro-conduit |
By Component (Qualitative Analysis only)
| Turbines |
| Generators |
| Control and Automation |
| Balance-of-Plant |
By End-User
| Utilities (State and Public) |
| Independent Power Producers |
| Industrial and Captive |
By Country
| United States |
| Canada |
| Mexico |
| By Capacity | Large Hydro (Above 100 MW) |
| Medium Hydro (10 to 100 MW) | |
| Small and Micro Hydro (Below 10 MW) | |
| By Technology | Reservoir-Based |
| Run-of-River | |
| Pumped-Storage | |
| In-Stream and Micro-conduit | |
| By Component (Qualitative Analysis only) | Turbines |
| Generators | |
| Control and Automation | |
| Balance-of-Plant | |
| By End-User | Utilities (State and Public) |
| Independent Power Producers | |
| Industrial and Captive | |
| By Country | United States |
| Canada | |
| Mexico |


Key Questions Answered in the Report
What is the installed capacity of the North America hydropower market in 2026?
Total installed capacity reached 201.78 GW in 2026, supported largely by U.S. and Canadian facilities.
How fast is pumped-storage growing in North America?
Pumped-storage is projected to rise at a 4.75% CAGR through 2031 as grid operators seek long-duration storage solutions.
Which country is expanding hydro capacity the fastest?
Mexico leads growth with a 3.68% CAGR, supported by CFE’s USD 500 million modernization program and new run-of-river builds.
Why are small and micro plants gaining traction?
Streamlined permitting, modular equipment, and non-powered dam conversions allow sub-10 MW projects to reach commercial operation in under 18 months.
How does federal U.S. funding influence modernization?
The Bipartisan Infrastructure Law and Inflation Reduction Act together deliver grants and 30% tax credits that finance turbine upgrades and digitalization across aging plants, extending asset life and boosting efficiency.
Page last updated on:


