
Market Overview
| Study Period | 2020 - 2031 |
|---|---|
| Market Size (2026) | USD 19.60 Billion |
| Market Size (2031) | USD 35.32 Billion |
| Growth Rate (2026 - 2031) | 12.50 % |
| Fastest Growing Market | Asia Pacific |
| Largest Market | North America |
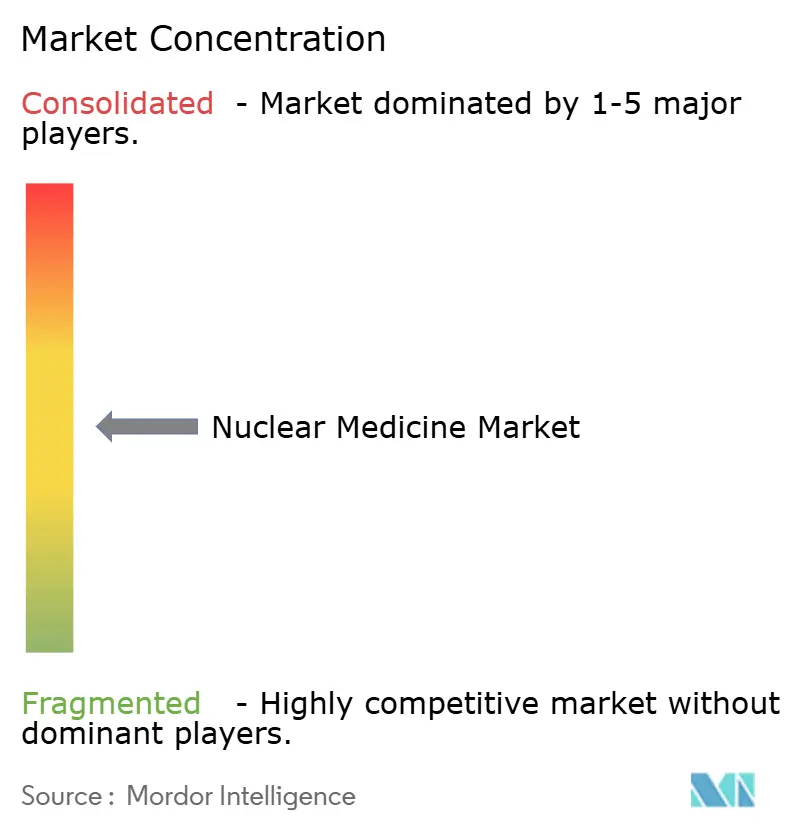
| Market Concentration | Medium |
Major Players *Disclaimer: Major Players sorted in no particular order Image © Mordor Intelligence. Reuse requires attribution under CC BY 4.0. | |
Nuclear Medicine Market Analysis by Mordor Intelligence
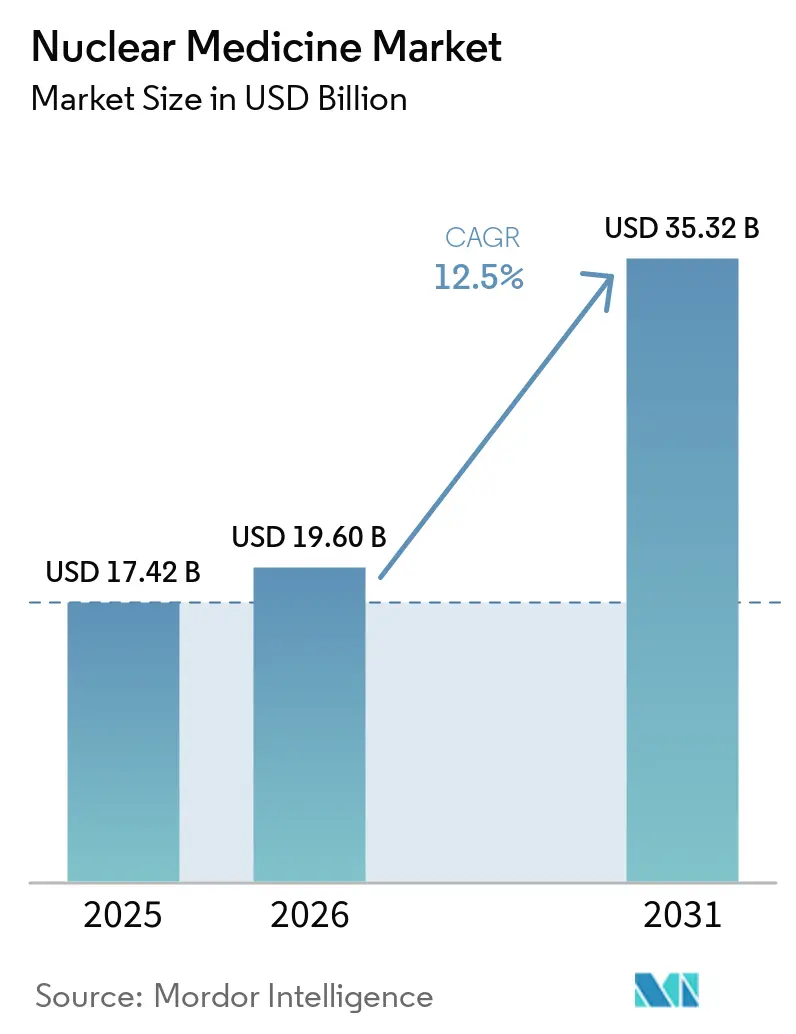
The Nuclear Medicine Market size is expected to grow from USD 17.42 billion in 2025 to USD 19.60 billion in 2026 and is forecast to reach USD 35.32 billion by 2031 at 12.5% CAGR over 2026-2031.
The current expansion is fueled by a structural pivot toward precision oncology, wider reimbursement for novel tracers, and hospital investments that integrate diagnostic imaging with targeted radiotherapy. Growth momentum is visible across both mature and emerging economies as cyclotron capacity rises, regulatory agencies endorse theranostic pairs, and artificial-intelligence (AI) workflows shorten reporting times. Market leaders are accelerating vertical integration to secure isotope supply and capture logistics margin, while contract manufacturers scale non-reactor molybdenum-99 production, reducing dependence on aging reactors. Intensifying venture capital interest in alpha emitters and AI-driven quantification tools underscores the long-term upside of the nuclear medicine market.
Key Report Takeaways
- By product type, diagnostics accounted for 76.12% of the nuclear medicine market share in 2025; therapeutics are forecast to grow at a 15.45% CAGR through 2031.
- By radioisotope, technetium-99m captured 43.28% of the nuclear medicine market size in 2025, whereas lutetium-177 is projected to grow at a 14.31% CAGR between 2026-2031.
- By application, oncology led with 41.84% revenue share in 2025; neurology is expected to expand at a 14.29% CAGR through 2031.
- By end user, hospitals accounted for 49.69% of the 2025 market, while specialized radiopharmacies are growing at a 13.61% CAGR to 2031.
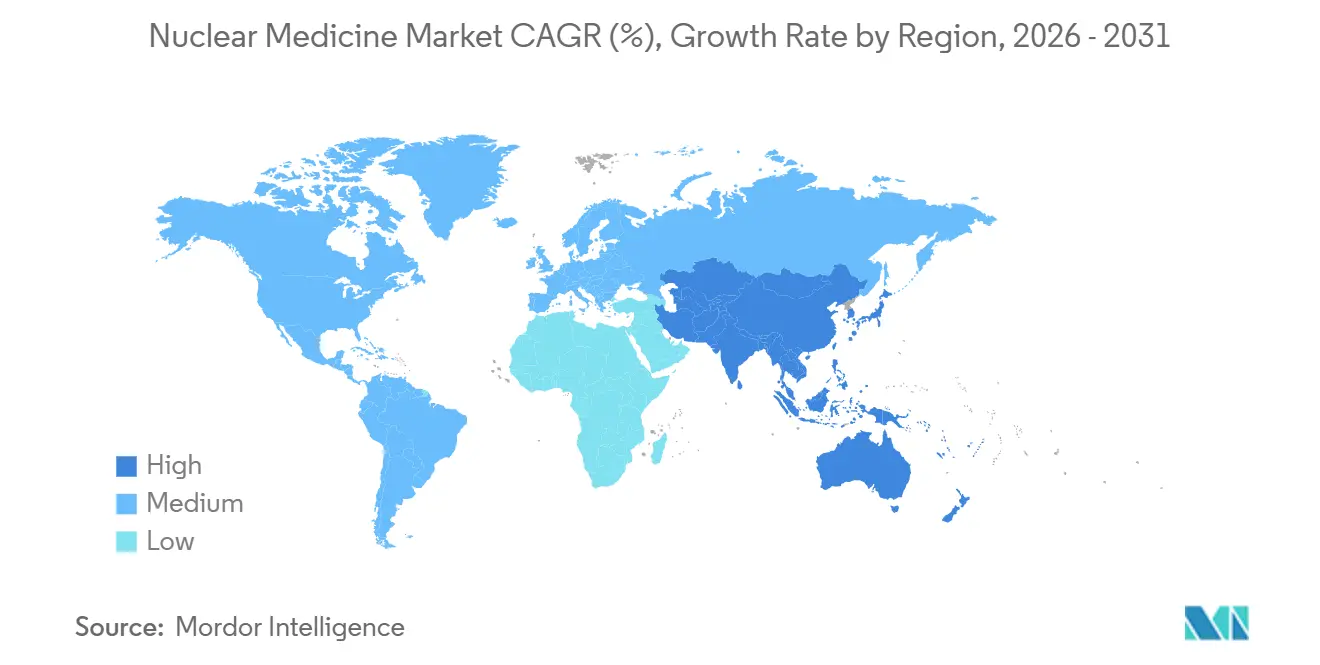
- By geography, North America retained 39.43% revenue share in 2025, whereas Asia-Pacific is projected to post a 14.56% CAGR over the forecast period.
Note: Market size and forecast figures in this report are generated using Mordor Intelligence’s proprietary estimation framework, updated with the latest available data and insights as of January 2026.
Market Trends and Insights
Drivers Impact Analysis of Nuclear Medicine Market*
| Driver | (~) % Impact on CAGR Forecast | Geographic Relevance | Impact Timeline |
|---|---|---|---|
| Rising burden of targeted diseases (cardiovascular, cancer, neurological) | +2.8% | Global, with the highest incidence in North America and Europe | Long term (≥ 4 years) |
| Growing adoption of targeted radiotherapy | +2.4% | North America, Europe, APAC emerging markets | Medium term (2-4 years) |
| Technological advancement in imaging modalities | +1.9% | North America, Europe, Japan, South Korea | Medium term (2-4 years) |
| Increasing focus of government & private players | +1.6% | APAC core (China, India), the Middle East, and Latin America | Long term (≥ 4 years) |
| Expansion of non-reactor Mo-99 production technologies | +1.2% | North America, Europe, with spill-over to APAC | Short term (≤ 2 years) |
| Integration of AI-enabled radiotracer quantification workflows | +0.9% | North America, Europe, select APAC centers | Medium term (2-4 years) |
| Source: Mordor Intelligence | |||
Rising Burden of Targeted Diseases Drives Precision Diagnostics
Cancer incidence reached 2 million new U.S. cases in 2025, while cardiovascular disease remained the principal cause of global mortality, pushing cardiology departments to replace stress-only perfusion studies with hybrid PET-CT viability scans that guide revascularization.[1]American College of Cardiology, “2025 Nuclear Cardiology Guidelines,” acc.org The World Health Organization reports that neurological disorders affect 1 in 3 people worldwide, spurring health systems to install cyclotrons and train nuclear-medicine physicians to manage the rising caseload. FDA and EMA companion-diagnostic mandates for targeted oncology drugs embed imaging into treatment algorithms and secure recurring procedure volumes. The combined disease burden, therefore, anchors long-term growth of the nuclear medicine market. Investments in public screening programs and research grants further reinforce demand visibility. As a result, cyclotron vendors and radiopharmacy operators are expanding capacity in major metropolitan areas and secondary cities alike.
Targeted Radiotherapy Adoption Reshapes Treatment Paradigms
Peptide receptor radionuclide therapy using lutetium-177 DOTATATE achieved a 79% disease-control rate in neuroendocrine tumor trials, eclipsing chemotherapy benchmarks and prompting guideline inclusion in the United States and Europe. Medicare’s 2025 coverage expansion for lutetium-177 PSMA-617 extended overall survival by 4 months in metastatic prostate cancer, triggering hospital investment in purpose-built therapy suites. Alpha-emitters such as radium-223 deliver high-linear-energy transfer over short ranges, reducing bone-marrow toxicity and appealing to oncologists treating frail patients. Theranostic pairs linking gallium-68 imaging to lutetium-177 therapy enable real-time dosimetry and limit unnecessary cycles, translating into lower overall care costs. Reimbursement parity between external-beam radiation and radiopharmaceutical therapy in Germany and France removes a historical barrier and accelerates European adoption.
Imaging Modality Advances Enhance Diagnostic Precision
Digital time-of-flight PET detectors improve signal-to-noise ratios by 40% and detect lesions as small as 5 mm, halving scan times and increasing scanner utilization.[2]Siemens Healthineers, “Digital PET Technology Whitepaper,” siemens-healthineers.com Hybrid PET-MRI systems fuse metabolic and anatomical data without additional radiation, driving uptake in pediatric oncology and brain tumor imaging. Solid-state SPECT cameras with cadmium-zinc-telluride crystals double sensitivity over sodium-iodide systems, enabling lower doses for vulnerable populations. Portable gamma cameras now support intraoperative sentinel-node mapping, shortening surgical time and improving oncologic outcomes. Machine-learning algorithms trained on 500,000 PET scans auto-segment tumors, reducing inter-observer variability in multicenter trials.
Expansion of Non-Reactor Mo-99 Production Mitigates Supply Risk
NorthStar Medical Radioisotopes’ neutron-capture facility in Wisconsin produces 3,000 6-day curies of molybdenum-99 weekly without highly enriched uranium, diversifying North American supply. BWXT Medical’s photonuclear process yields carrier-free Mo-99, improving technetium-99m generator performance and extending shelf life by 20%. Australia’s OPAL reactor supplies 25% of global Mo-99 and shortens delivery times within Southeast Asia. Harmonized IAEA shipping standards remove redundant import permits, accelerating cross-border distribution. Stabilized Mo-99 output reduces price volatility and procedure cancellations for imaging centers, bolstering the nuclear medicine market.
Restraints Impact Analysis of Nuclear Medicine Market*
| Restraint | (~) % Impact on CAGR Forecast | Geographic Relevance | Impact Timeline |
|---|---|---|---|
| Complex multi-agency regulatory approval | -1.8% | EU, emerging economies, global | Long term (≥ 4 years) |
| Short half-life isotope supply-chain risk | -2.3% | Global, remote regions | Short term (≤ 2 years) |
| High cost of procedures and equipment | -1.5% | Emerging markets, cost-pressured regions | Medium term (2-4 years) |
| Scarcity of skilled radiopharmacists | -1.1% | APAC and developing economies | Long term (≥ 4 years) |
| Source: Mordor Intelligence | |||
Complex Multi-Agency Regulatory Approval Delays Market Entry
Radiopharmaceuticals must navigate separate FDA, EMA, and national pathways, each demanding extensive chemistry-manufacturing datasets and radiation dosimetry studies, extending timelines to 24 months and costing USD 50 million per compound. Divergent pediatric investigation requirements add further studies even when adult indications dominate, delaying European launches. Concordance data for theranostic companion diagnostics increase regulatory complexity, while long-term safety registries stretch smaller developers’ resources. These barriers consolidate innovation among large pharmaceutical firms and slow the pace of new entrants into the nuclear medicine industry.
Short Half-Life Isotopes Impose Logistical Constraints
Fluorine-18’s 110-minute half-life requires cyclotron proximity within a two-hour flight radius, limiting access in low-density geographies and increasing reliance on expensive charter flights.[3]International Atomic Energy Agency, “Radioisotope Transport Guidelines,” iaea.org Technetium-99m generators decay 0.5% per hour, creating inventory challenges for hospitals with variable scan volumes. Gallium-68 generators lose activity over 12 months, necessitating frequent replacements that disrupt schedules. Cold-chain failures during transit can render isotopes unusable, particularly in tropical climates with weak logistics infrastructure. These constraints spur interest in longer-lived isotopes like copper-64 and zirconium-89, yet regulatory approval remains several years away.
*Our forecasts treat driver/restraint impacts as directional, not additive. The impact forecasts reflect baseline growth, mix effects, and variable interactions.
Nuclear Medicine Market Segment Analysis
By Product Type:
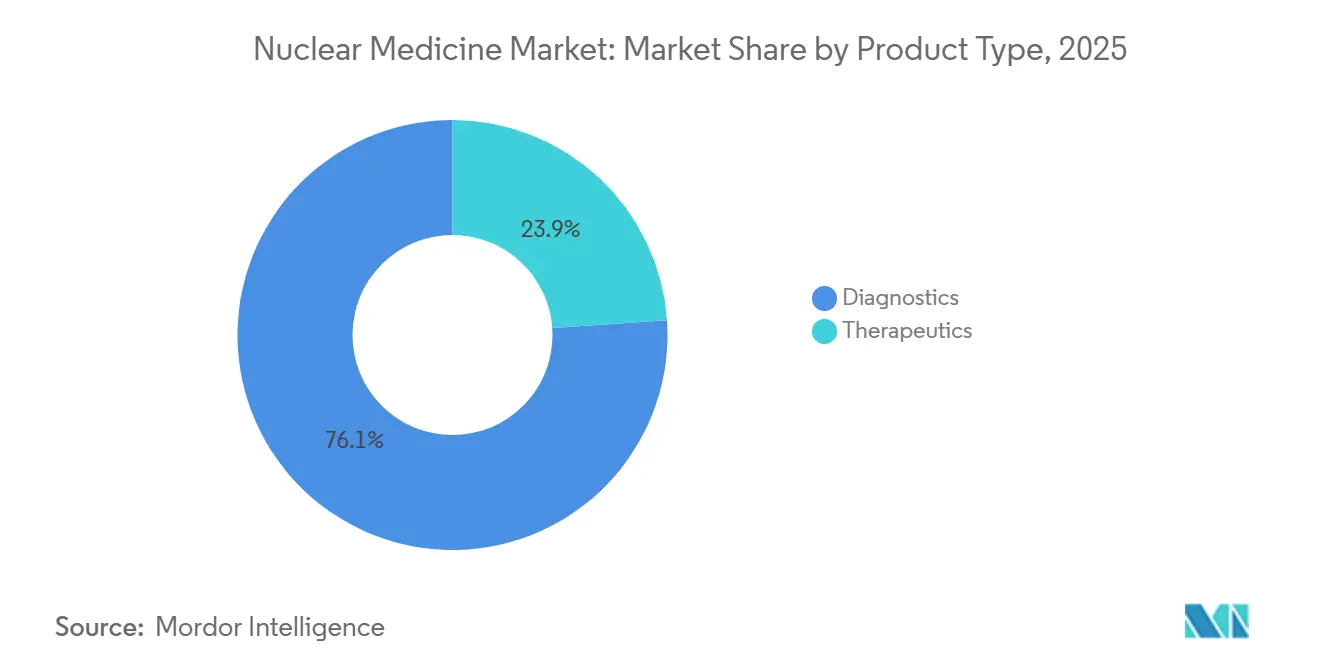
Therapeutics Outpace Diagnostics on Theranostic MomentumDiagnostics controlled 76.12% of revenue in 2025, supported by widespread SPECT myocardial perfusion and PET oncology protocols, yet nuclear medicine therapeutics are projected to grow at 15.45% CAGR through 2031 as hospitals embrace lutetium-177 and actinium-225 regimens. This pivot will lift therapeutics’ contribution to the nuclear medicine market size, while diagnostics maintain a foundational role in patient selection and follow-up. SPECT preserves share in cardiology and bone imaging because of lower scanner costs, but PET continues to win oncology and neurology volumes due to superior resolution and quantification accuracy. Alpha-emitter doses command premium prices (USD 30,000 versus USD 8,000 for beta-emitters), reflecting their ability to eradicate radio-resistant tumors with fewer cycles. Beta-emitters such as yttrium-90 and lutetium-177 dominate liver and neuroendocrine tumor therapy, underpinned by robust safety data. Brachytherapy isotopes, including iodine-125, show flat growth as robotic surgery and external-beam modalities advance.
Therapeutic growth will lift pharmacy revenues and drive capital expenditure on hot cells, shielded infusion suites, and dosimetry software. Suppliers that bundle diagnostic tracers with matched therapies will capture higher wallet share. As theranostics mature, integrated pathways will lower total care costs, reinforcing payer support and sustaining nuclear medicine market expansion.


By Radioisotope:
Lutetium-177 Surges on PSMA Therapy AdoptionTechnetium-99m retained a 43.28% share in 2025, driven by high-volume cardiology and bone scans. Yet lutetium-177 doses are rising at a 14.31% CAGR as PSMA therapy enters mainstream oncology practice, expanding the nuclear medicine market share of therapeutic isotopes. Fluorine-18 remains the backbone of PET imaging, but novel tracers targeting PSMA and fibroblast activation protein expand its utility beyond oncology into inflammation and cardiac fibrosis. Iodine-131 remains standard for thyroid disorders, though usage plateaus amid surgery advances and oral kinase inhibitors.
Emerging isotopes such as gallium-68 and copper-64 are gaining momentum at academic centers running early-access programs, paving the way for broader adoption once supply chains mature. Suppliers investing in flexible production line configurations will be best positioned to meet demand variance across isotope classes.
By Application:
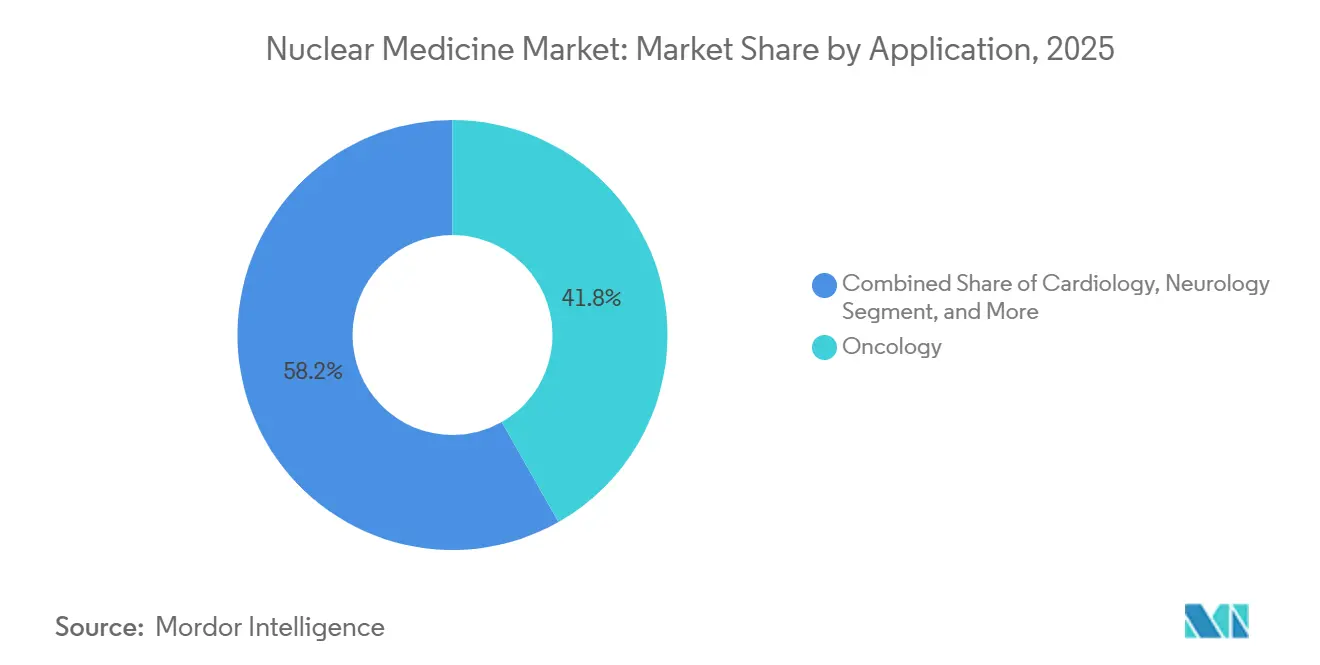
Neurology Accelerates on Alzheimer’s Diagnostic DemandOncology accounted for 41.84% of revenue in 2025; however, neurology is expected to post a 14.29% CAGR as amyloid-beta and tau PET tracers enter routine Alzheimer’s workups. Cardiology volumes stabilize as stress-only SPECT protocols reduce isotope consumption without sacrificing diagnostic value. Endocrinology applications grow in line with the overall nuclear medicine market, benefiting from readily available iodine-123 and gallium-68 DOTATATE. Orthopedic bone scintigraphy faces pressure from MRI in younger cohorts but remains relevant for elderly patients with metal implants. Infection and renal imaging remain niche but indispensable in complex cases, preserving a diversified procedure mix and underpinning the nuclear medicine market.

By End User:
Specialized Radiopharmacies Capture Logistics ValueHospitals generated 49.69% of 2025 sales by virtue of embedded radiopharmacies and research programs, yet specialized radiopharmacies are expanding at a 13.61% CAGR through 2031. Centralized compounding reduces on-site radiation hazards, slashes capital costs, and ensures unit-dose delivery within the half-life windows of isotopes. Imaging centers increasingly outsource tracer supply while deploying mobile PET-CT units to reach rural populations. Research institutes account for 8% of isotope volumes as they validate new tracers ahead of commercialization. Ambulatory surgical centers are beginning to adopt portable gamma cameras for radioguided oncologic procedures, creating incremental demand for low-volume isotopes. This evolving channel mix will shape procurement strategies and vendor partnerships across the nuclear medicine industry.
Geography Analysis
North America Nuclear Medicine Market
North America led with 39.43% revenue share in 2025, supported by over 2,500 PET-CT scanners and Medicare coverage for 18 PET tracers. The United States hosts 120 hospitals offering lutetium-177 PSMA therapy and 40 actinium-225 clinical-trial sites, accelerating regulatory approvals and fostering research synergies. Canada’s transition to non-reactor Mo-99 production mitigates prior supply disruptions, while Mexico’s public-private scanner installations extend access to its 130 million population.
Europe Nuclear Medicine Market
Europe boasts high PET penetration, with Germany operating 180 cyclotrons that enable same-day fluorine-18 deliveries to 95% of residents. National health systems reimburse amyloid PET and gallium-68 PSMA, reinforcing procedural volumes. Italy and Spain invest in theranostic centers that consolidate diagnostics and therapy under one roof, lowering care costs. Poland and Hungary modernize legacy gamma cameras, lifting demand for updated isotopes and software.
APAC Nuclear Medicine Market
Asia-Pacific is the fastest-growing region at 14.56% CAGR, led by China’s installation of 300 PET-CT scanners in 2025 and India’s expansion of cyclotron sites to 27 by 2027. Japan’s aging population drives Alzheimer’s and cardiac viability imaging, with national insurance coverage since 2024. South Korea subsidizes PET-CT equipment for rural hospitals, cutting wait times to 5 days. Australia’s regulatory approvals for copper-64 and zirconium-89 tracers position it as a regional clinical-trial hub, while ASEAN nations form shared radiopharmacy networks to overcome scale challenges.

Regulatory Landscape
Nuclear medicine radiopharmaceuticals are handled under tightly controlled drug and radiation-safety regimes, with added complexity when products are treated as drug-device combinations. In the United States, the FDA Office of Combination Products determines jurisdiction and requires compliance with drug CGMP (21 CFR 210/211) alongside device quality-system requirements (21 CFR 820), or a streamlined approach under 21 CFR Part 4 for combination products, which increases documentation and inspection readiness demands for radiopharmacies and manufacturers.
In Europe, the regulatory pathway depends on the principal mode of action, with integral drug-device combinations typically reviewed within the medicinal products framework when pharmacological action is primary, while Medical Device Regulation (EU) 2017/745 can trigger additional Notified Body interactions for certain configurations. For radiation protection, IAEA Safety Standards (including SSG-46) provide a widely referenced baseline for safe medical use of ionizing radiation. A June 2025 IAEA technical meeting also highlighted gaps around updated guidance for modern radionuclides and pediatric nuclear medicine, including the need for more harmonized patient discharge approaches after radionuclide therapies.
Value Chain Analysis
The nuclear medicine value chain begins with isotope production, using reactor and non-reactor routes for key medical isotopes plus cyclotron-based production for PET isotopes. This is followed by target processing, radiochemical purification, radiolabeling and finished-dose manufacturing under GMP, quality control and batch release, and then time-critical distribution to hospitals, imaging centers, and specialized radiopharmacies. Because many isotopes have short half-lives, last-mile logistics and scheduling become a main source of value, with specialized couriers and regional production hubs used to protect delivered activity and reduce waste.
Bottlenecks tend to cluster around reliable isotope availability, specialized hot-cell and shielding infrastructure, and qualified radiopharmacy operations that can support multi-product GMP compliance. Suppliers and service providers are therefore adding capacity and moving toward vertical integration across production and distribution, including SHINE Technologies completing its acquisition of Lantheus SPECT manufacturing assets (including the North Billerica facility) in January 2026, and Cardinal Health adding a high-capacity actinium-225 production line at its Center for Theranostics Advancement in Indianapolis in April 2026. In Europe, Curium’s June 2026 plan to add a new production line at Saclay, France for Lu-177-PSMA-I&T aims to align upstream isotope capability with downstream clinical demand for theranostics.
Competitive Landscape
The nuclear medicine market is moderately concentrated: the top five players, GE HealthCare, Siemens Healthineers, Cardinal Health, Curium, and Novartis, collectively hold the majority of the revenue share. Incumbents pursue vertical integration, acquiring radiopharmacies and isotope facilities to secure supply and expand margins, typified by Cardinal Health’s purchase of 12 U.S. pharmacies in 2024. Contract manufacturing gains momentum as pharmaceutical firms outsource complex isotope production to specialists such as Jubilant Radiopharma and IBA Molecular, reducing capital exposure. Alpha-emitter therapeutics constitute a competitive frontier, with Actinium Pharmaceuticals, Fusion Pharmaceuticals, and Orano Med racing to establish reliable actinium-225 supply chains. Vendors embed AI into imaging platforms to win tenders through workflow efficiencies, demonstrated by Siemens Healthineers’ oncology auto-segmentation modules. Regulatory costs under FDA 21 CFR Part 212 and EMA GMP Annex 3 elevate entry barriers, favoring players with established quality systems and validated cleanrooms.
Nuclear Medicine Industry Leaders
GE Healthcare
Cardinal Health Inc.
Siemens Healthineers
Novartis AG
Curium Pharma
- *Disclaimer: Major Players sorted in no particular order
Nuclear Medicine Market Companies Covered in this Report
- Actinium Pharmaceuticals
- Bayer
- Blue Earth Diagnostics
- Bracco Imaging S.p.A.
- BWXT Medical Ltd.
- Cardinal Health
- Cerveau Technologies
- Curium Pharma
- Eckert & Ziegler Radiopharma
- GE Healthcare
- IBA Molecular
- Isotopia Molecular Imaging
- Jubilant Radiopharma
- Lantheus
- NorthStar Medical Radioisotopes
- Novartis
- Siemens Healthineers
- SOFIE Biosciences
- Spectrum Dynamics Medical
- Telix Pharmaceuticals Ltd.

Market Opportunities and Future Outlook
Expanded licensed production and simplified compliance pathways are becoming a focal opportunity set, since they support scale-up for hospitals and specialized radiopharmacies. In May 2026, the US Nuclear Regulatory Commission proposed the rule "Modernizing NRC Regulations for Byproduct Material Use" to ease the regulatory burden on radiopharmaceutical licensees, and this modernization creates room for faster site onboarding, standardized operating models, and multi-site distribution networks.
Procurement and partnering opportunities are also opening through supply expansion and localization efforts across both diagnostics and therapeutics. Several 2026 actions illustrate the direction of travel: Curium announced an over EUR 32 million investment (June 2026) to add Lutetium-177 production capacity at Saclay, France; IBA signed multi-site cyclotron agreements in India (February 2026, with Shreeji) and in the United States (March 2026, with Telix) to broaden PET radiopharmaceutical manufacturing footprints; and RadioMedix reported FDA approval for Ga-68 PSMA-11 (June 2026), supporting broader access to prostate cancer PET diagnostics. Taken together, these moves support growth for integrated suppliers offering isotope production, radiolabeling, and distribution as bundled services, while also creating demand pull for CDMOs and specialized radiopharmacies tied to therapy-suite buildouts and expanding tracer menus.
Recent Industry Developments in Nuclear Medicine Market
- June 2026: Siemens Healthineers announced a GBP 26 million investment in a new 8X radiopharmacy in Dunstable, UK, designed to deliver eight times the production capacity of a standard facility. The buildout strengthens regional radiopharmaceutical supply resilience and supports higher-throughput theranostics programs with more predictable dose availability.
- November 2025: GE HealthCare received CE Mark for StarGuide GX, a digital 4D SPECT/CT system positioned for theranostics workflows and multi-energy imaging, including isotopes used in emerging alpha-based programs. The clearance broadens deployment options across Europe and supports more standardized quantitative imaging in sites building paired diagnostic-therapy pathways.
- December 2024: Cardinal Health commenced routine weekly production of cGMP-compliant actinium-225 at its Center for Theranostics Advancement in collaboration with TerraPower Isotopes. Establishing routine output strengthens domestic supply for clinical and commercial programs that depend on reliable alpha-emitter availability.


Nuclear Medicine Market Report Scope and Research Methodology
Market Definition and Coverage
For this study, the nuclear medicine market covers the value of radiopharmaceuticals and medical radioisotopes used for diagnostic imaging or targeted therapy in clinical settings, counted at the point of sale into healthcare delivery.
Scope exclusions: Imaging equipment (PET/SPECT systems and gamma cameras) and conventional CT or X-ray contrast agents are not counted.
Segments Covered in This Report
- By Product Type
- Diagnostics
- SPECT
- PET
- Therapeutics
- Alpha Emitters
- Beta Emitters
- Brachytherapy Isotopes
- Diagnostics
- By Radioisotope
- Technetium-99m
- Fluorine-18
- Iodine-131
- Lutetium-177
- Others
- By Application
- Oncology
- Cardiology
- Neurology
- Endocrinology
- Orthopedics & Pain Management
- Other Applications
- By End User
- Hospitals
- Diagnostic Imaging Centers
- Specialized Radiopharmacies
- Research Institutes
- Ambulatory Surgical Centers
- By Geography
- North America
- United States
- Canada
- Mexico
- Europe
- Germany
- United Kingdom
- France
- Italy
- Spain
- Rest of Europe
- Asia-Pacific
- China
- Japan
- India
- Australia
- South Korea
- Rest of Asia-Pacific
- Middle East and Africa
- GCC
- South Africa
- Rest of Middle East and Africa
- South America
- Brazil
- Argentina
- Rest of South America
- North America
Data Sources, Market Sizing, and Validation
Desk Research
Desk research is used to set the model guardrails, and to keep assumptions realistic before they are stress-tested in interviews. We typically reference public sources such as IAEA publications on nuclear medicine access, the U.S. FDA databases for radiopharmaceutical approvals, U.S. NRC materials on medical isotope handling, OECD health statistics for procedure and capacity signals, and peer-reviewed journal articles that track PET and SPECT utilization trends.
Along with these, we review company annual reports and investor presentations, clinical society and association websites, and reputable press coverage on isotope supply events and tracer launches. Where it helps with consistency, we use subscriptions for company financials and intelligence, news and financials, and patent databases to organize what is publicly disclosed and reduce the risk of missing key developments. The desk research sources mentioned here are illustrative only, since other public and paid sources are used during data collection, validation, and clarification.
Primary Interviews and Surveys
Primary work is used to confirm what is actually being bought and used, and then to pin down pricing and mix assumptions that desk research rarely makes explicit. We speak with a spread of stakeholders such as radiopharm manufacturers and distributors, hospital and imaging center leaders, nuclear medicine physicians and pharmacists, and procurement or operations managers across APAC, EMEA, and the Americas. Their feedback is used to close gaps on isotope availability, modality mix shifts (PET versus SPECT), and typical pricing patterns by tracer and care setting.
Distribution of primary research fieldwork respondents
| Company type | Respondent position | Region |
|---|---|---|
| Top tier: 38% | CXOs: 13% | APAC: 43% |
| Mid tier: 48% | Functional/Unit leaders: 31% | EMEA: 31% |
| Smaller Players: 14% | Managers: 56% | Americas: 26% |
Market-Sizing & Forecasting
The market is sized using a top down build where procedure demand and tracer usage rates are reconstructed by modality, then converted to value using typical dose pricing by radioisotope and indication. To keep the math grounded, we apply selective bottom up checks such as roll ups from a sampled set of supplier revenues, channel checks with distributors, and volume times ASP calculations for high use tracers.
Key inputs used in the model include the split of PET versus SPECT procedures, dose per procedure assumptions, tracer mix by application (oncology, cardiology, neurology), site of care mix across hospitals and imaging centers, and isotope supply constraints that can cap volumes in certain periods. Where bottom up signals are incomplete for smaller geographies, we fill gaps using proxy indicators like installed PET and SPECT capacity and reported procedure intensity, then reconcile those to the global total.
For forecasting, we run scenario analysis since uptake is shaped by tracer approvals, reimbursement momentum, and supply reliability that can change quickly. The base case is anchored to demand drivers such as aging population trends and cancer incidence direction, then adjusted using expert inputs on expected tracer adoption and pricing progression.
Data Validation & Update Cycle
Outputs are checked against independent signals, including procedure volume direction, tracer launch timing, and observed changes in isotope supply, before the final totals are signed off. When a variance looks too large, we revisit the assumptions, replay the calculations, and re contact experts to confirm whether the issue is pricing, mix, or volume.
Reviews happen in steps, starting with analyst cross checks and followed by a second pass that challenges inputs and year over year movements. The report is refreshed annually, and interim updates are added when a material event occurs, such as a major supply disruption or a meaningful change in regulation or reimbursement. Right before delivery, a final review pass is completed so clients receive the most current view available.
Mordor Intelligence's Nuclear Medicine Market Size Compared With Other Published Estimates
Published market values for nuclear medicine can differ even when the topic name looks the same, because the counting boundary often shifts between radiopharmaceutical sales, imaging service revenue, and equipment related value. Differences also come from which year is treated as the base, how currency conversion is timed, and whether pricing is modeled as a flat average or as a tracer level ASP that changes with mix.
In our build, refresh timing and currency timing are handled tightly, and tracer level ASPs are updated when mix moves toward higher value therapeutic isotopes, which is why Mordor Intelligence reports USD 19.60 B (2026) on a scope that excludes imaging hardware.
Benchmark comparison
| Source | Market Size | Gaps in Research Methodology |
|---|---|---|
| Mordor Intelligence | USD 19.60 B (2026) | |
| Industry Publisher A | USD 11.77 B (2025) | Often framed as radiopharmaceuticals, but the sizing year is earlier and the scope emphasis can lean toward select PET and SPECT products, which can understate total value when therapeutics and broader isotope mix are weighted differently. |
| Global Research Group B | USD 21.27 B (2025) | Some estimates appear to blend broader nuclear medicine revenue pools and apply averaged pricing across modalities, which can lift totals if related services or adjacent categories are implicitly included and if currency conversion uses a different timing window. |
Taken together, the spread is mainly explained by what is counted (drug and isotope value only versus broader revenue pools), plus the base year and the way pricing and FX are refreshed. By keeping the scope boundary explicit and tying value to procedure signals and tracer mix, the final number stays traceable to inputs that can be rechecked and repeated.


Key Questions Answered in the Report
How big will be the nuclear medicine market in 2026?
The nuclear medicine market size is expected to reach USD 19.60 billion in 2026 and is forecast to reach USD 35.32 billion by 2031.
Which segment is growing fastest?
Therapeutic radiopharmaceuticals are projected to grow at a 15.45% CAGR through 2031, outpacing diagnostics.
What radioisotope leads current demand?
Technetium-99m commands 43.28% of 2025 revenue thanks to high-volume cardiology and bone scans.
Why is Asia-Pacific attractive to investors?
China and India are adding cyclotrons and PET-CT scanners, driving a 14.56% regional CAGR and new market opportunities.
What is the main supply-chain challenge?
Short half-lives of isotopes like fluorine-18 require regional production hubs, complicating logistics in remote areas.
Page last updated on:


 Your data is secure and never sold or shared.


