Tantalum Market Size and Share
Market Overview
| Study Period | 2020 - 2031 |
|---|---|
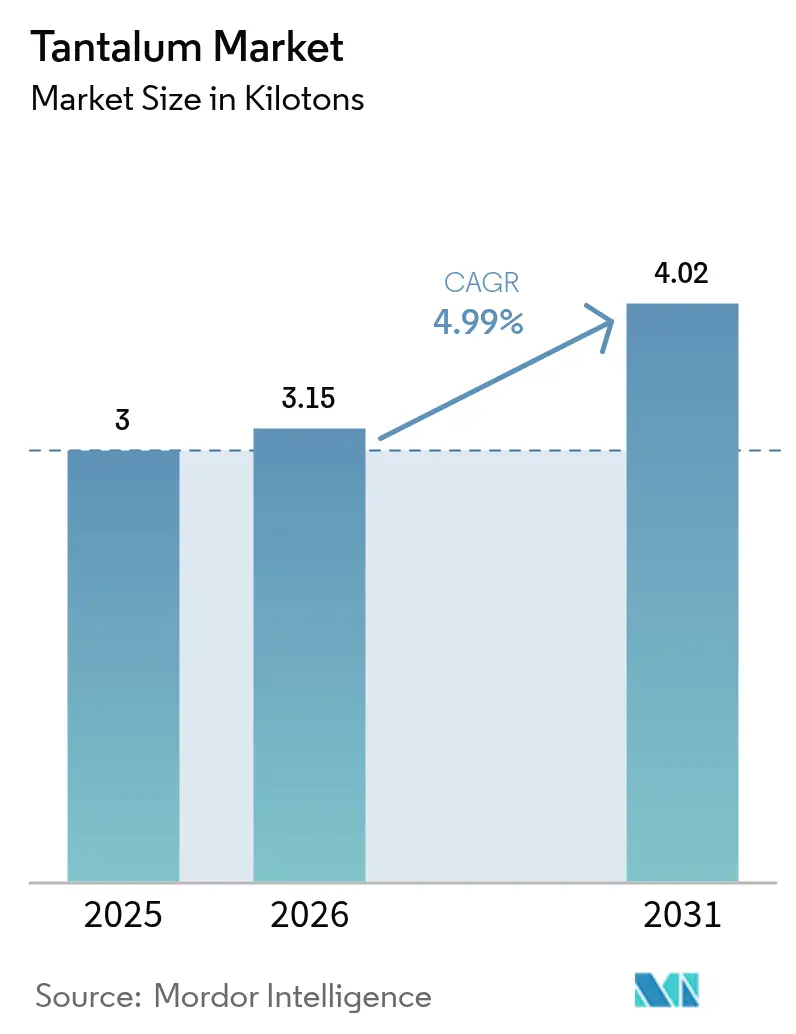
| Market Volume (2026) | 3.15 kilotons |
| Market Volume (2031) | 4.02 kilotons |
| Growth Rate (2026 - 2031) | 4.99% CAGR |
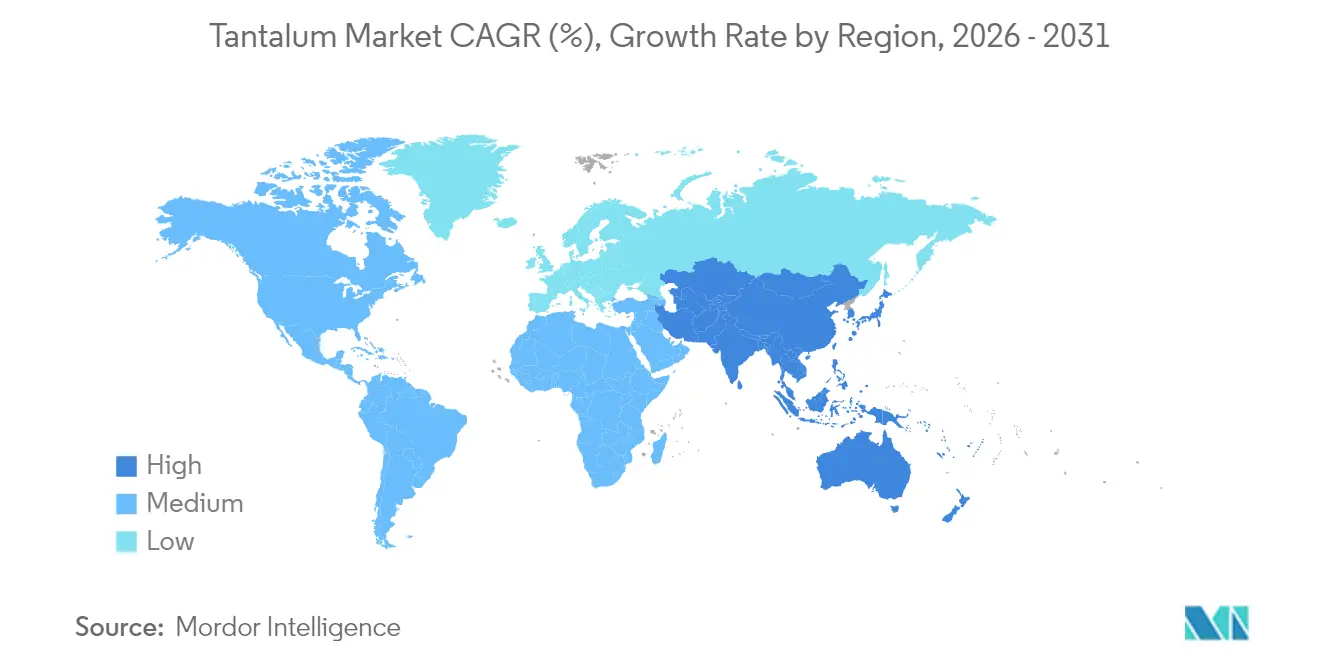
| Fastest Growing Market | Asia Pacific |
| Largest Market | Asia-Pacific |
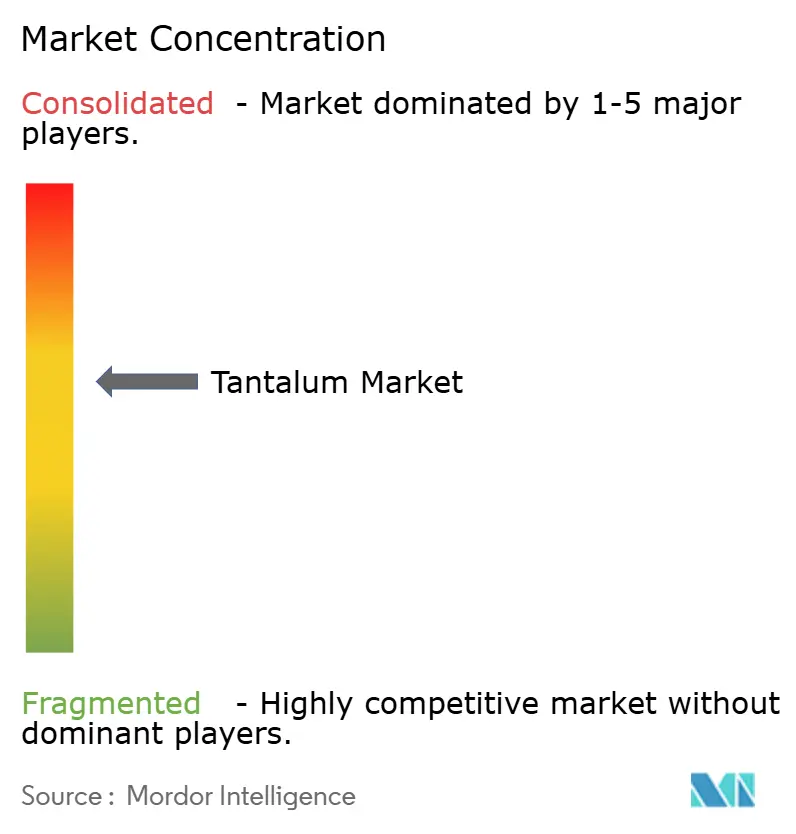
| Market Concentration | Medium |
Major Players *Disclaimer: Major Players sorted in no particular order Image © Mordor Intelligence. Reuse requires attribution under CC BY 4.0. | |
Tantalum Market Analysis by Mordor Intelligence
The Tantalum market size is expected to grow from 3 kilotons in 2025 to 3.15 kilotons in 2026 and is forecast to reach 4.02 kilotons by 2031 at 4.99% CAGR over 2026-2031. This growth trajectory reflects the metal’s unmatched combination of corrosion resistance, biocompatibility, and high dielectric strength that keeps demand resilient across capacitors, sputtering targets, super-alloys, and implantable medical devices. Robust electronics miniaturization, accelerating 5G deployment, and steady aerospace engine build rates remain primary demand catalysts. Parallelly, co-production from lithium pegmatite mines in Australia and Zimbabwe is easing structural supply risk even as concerns over conflict-mineral compliance and spot-price volatility persist. OEMs in aerospace and medical technology continue to prioritize security of supply over price, supporting long-term contracts that stabilize procurement despite the market’s opaque trading environment.
Key Report Takeaways
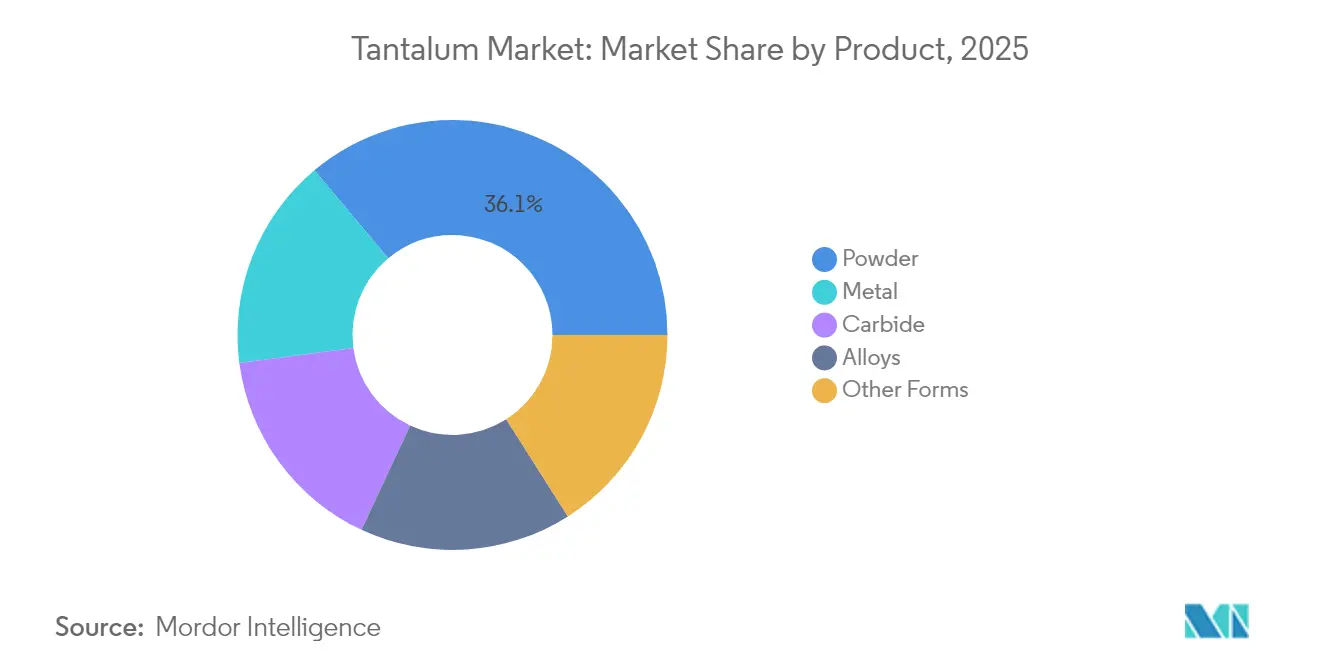
- By product, powder captured 36.10% of the tantalum market share in 2025 and is forecast to post a 5.43% CAGR through 2031.
- By purity, the less than 99.95% grade segment commanded 79.18% share of the tantalum market size in 2025 and is slated to grow at 5.11% CAGR between 2026-2031.
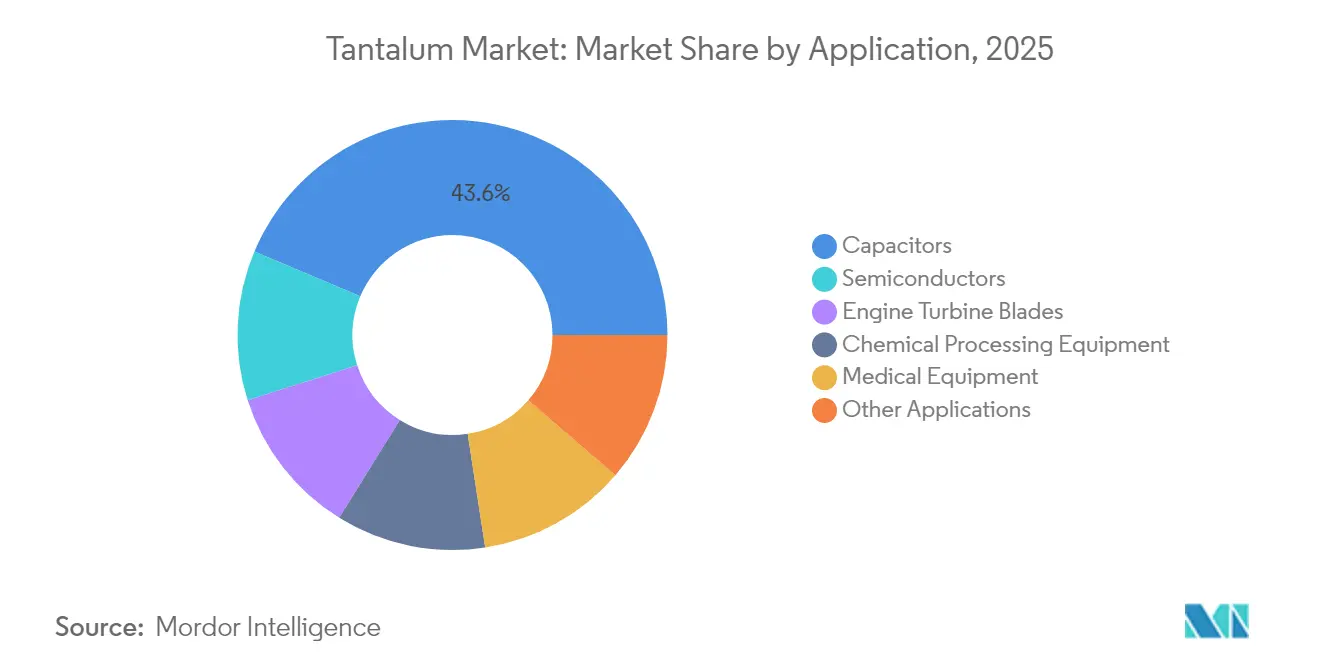
- By application, capacitors held 43.65% revenue share in 2025, while the same segment is projected to register the fastest 6.37% CAGR to 2031.
- By geography, Asia-Pacific led with 46.50% of overall market share in 2025; the region is anticipated to advance at a 5.93% CAGR during the forecast window.
Note: Market size and forecast figures in this report are generated using Mordor Intelligence’s proprietary estimation framework, updated with the latest available data and insights as of 2026.
Global Tantalum Market Trends and Insights
Driver Impact Analysis*
| Drivers | (~) % Impact on CAGR Forecast | Geographic Relevance | Impact Timeline |
|---|---|---|---|
| Surging demand for miniaturised tantalum capacitors in 5G-enabled devices | +1.2% | Asia-Pacific core, spill-over to North America and EU | Medium term (2-4 years) |
| Demand for tantalum sputtering targets in advanced semiconductor nodes | +0.9% | Global, concentrated in Taiwan, South Korea, China | Long term (≥ 4 years) |
| Rising production of super-alloy jet-engine components | +0.7% | North America and EU, expanding to Asia-Pacific | Long term (≥ 4 years) |
| Co-production with lithium hard-rock mines enhancing supply security | +0.6% | Australia, Zimbabwe, Brazil | Medium term (2-4 years) |
| Medical-grade tantalum coatings for neuro-implants | +0.4% | North America and EU, early adoption in developed markets | Long term (≥ 4 years) |
| Source: Mordor Intelligence | |||
Surging Demand for Miniaturised Tantalum Capacitors in 5G-Enabled Devices
5G infrastructure densification and handset upgrades are accelerating procurement of solid tantalum chip capacitors that can maintain capacitance stability under high-frequency switching. Component makers report that tantalum capacitors provide superior volumetric efficiency and lower equivalent series resistance than multi-layer ceramic types, features critical for space-constrained power-management circuits in flagship smartphones and small-cell base stations. Reliability across –55 °C to +175 °C temperature excursions makes tantalum devices the preferred choice for telecommunications OEMs keen to avoid field failures. Packaging road-maps now target case sizes as low as 0201, a node where powder-engineered anodes deliver high CV (capacitance–voltage) ratios without sacrificing mechanical integrity. The tantalum market benefits directly as device miniaturization lifts grams-per-unit usage despite broader material-lightweighting trends.
Demand for Tantalum Sputtering Targets in Advanced Semiconductor Nodes
Sub-7 nm logic and DRAM production flow-sheets specify tantalum and tantalum nitride diffusion-barrier layers that prevent copper migration while preserving low line resistance. Extreme ultraviolet lithography raises purity thresholds to 99.999%+, narrowing the supplier base to refiners with ultra-high-vacuum metallurgy capabilities. Long-term offtake agreements signed by leading Asian foundries in 2025 underscore how strategic this precursor has become in maintaining wafer yield. Equipment upgrades in South Korea, Taiwan, and mainland China are therefore translating into steady volumes for high-purity powder producers. Supply tightness remains a possibility whenever geopolitical disruptions affect concentrate flows from Central Africa, reinforcing the tantalum market’s tendency to price security at a premium.
Rising Production of Super-Alloy Jet-Engine Components
Next-generation turbofan and military propulsion programs specify nickel-based super-alloys with 2-12% tantalum to achieve operating temperatures exceeding 1,100 °C, thereby improving thrust-to-weight ratios and fuel burn. OEM qualification cycles are lengthy, but once approved, alloy chemistries remain stable for decades, creating an annuity demand stream. Blade, vane, combustor liner, and heat-exchanger designs increasingly rely on tantalum for oxidation resistance during thermal cycling. Western airframers are localizing supply to mitigate any single-country risk, a strategy that further embeds tantalum in long-term procurement budgets.
Co-Production with Lithium Hard-Rock Mines Enhancing Supply Security
Lithium-cesium-tantalum pegmatites in Australia and Zimbabwe are now central to diversification strategies, yielding tantalite concentrates as a low-cost by-product of spodumene. Operators at Greenbushes, Wodgina, and Bikita have commissioned new gravity circuits that can collectively push tantalum output toward 400 t Ta₂O₅ annually under favorable ore blends. As these mines ramp up, Western buyers secure multi-year contracts denominated in metric tons rather than long-ton units, improving transparency in what remains an otherwise opaque trading arena.
Restraint Impact Analysis*
| Restraints | (~) % Impact on CAGR Forecast | Geographic Relevance | Impact Timeline |
|---|---|---|---|
| Conflict-mineral compliance costs and supply disruptions | -0.8% | Global, particularly affecting North America and EU | Short term (≤ 2 years) |
| High spot-price volatility in an opaque trading market | -0.6% | Global, concentrated impact on Asia-Pacific manufacturing | Medium term (2-4 years) |
| Niobium capacitors replacing tantalum in ADAS systems | -0.5% | Global automotive markets, led by Europe and Asia-Pacific | Medium term (2-4 years) |
| Source: Mordor Intelligence | |||
Conflict-Mineral Compliance Costs and Supply Disruptions
Stringent due-diligence mandates under U.S. and EU regulations oblige downstream manufacturers to trace concentrate back to conflict-free smelters, adding audit and certification fees that lift finished-component costs by as much as one-quarter. Artisanal production from Central Africa still provides a significant share of global supply, and periodic border closures or security incidents can interrupt flows with little notice. As a result, capacitor and super-alloy suppliers hold larger safety stocks and favor multi-year take-or-pay contracts that lock in volumes even if spot prices ease[1]U.S. Geological Survey, “Tantalum Supply Chain Fact Sheet,” usgs.gov.
Niobium Capacitors Replacing Tantalum in ADAS Systems
Automotive platforms now integrate dozens of advanced driver-assistance modules that must satisfy stringent ISO 26262 functional-safety criteria. Niobium oxide capacitors exhibit benign failure modes and higher ignition energy, making them attractive for low-voltage ADAS circuits. As unit costs fall due to niobium’s relative abundance, automakers are specifying these devices in parking assist, blind-spot monitoring, and surround-view camera modules. Voltage ceiling limitations, however, confine niobium adoption to 4-10 V applications, leaving high-voltage domains such as electric-vehicle traction inverters to rely on tantalum[2]KYOCERA AVX, “Failure Mode Comparison of Tantalum and Niobium Oxide Capacitors,” kyocera-avx.com .
*Our forecasts treat driver/restraint impacts as directional, not additive. The impact forecasts reflect baseline growth, mix effects, and variable interactions.
Segment Analysis
By Product: Powder Dominance Drives Electronics Integration
Powder accounted for 36.10% of the tantalum market share in 2025, propelled by surging capacitor anode and sputtering-target consumption. This sub-segment is forecast to post a 5.43% CAGR through 2031 as miniaturization pushes demand for tighter particle-size distributions and higher specific capacitance. Metal billet, wire, and sheet collectively trail powder but remain essential for chemical-processing equipment and aerospace hot-zone components where wrought form factors are mandatory. Carbide grades serve cutting-tool and wear-plate manufacturers who value hardness exceeding 2,000 HV, while alloy additions underpin jet-engine super-alloys.
The shift toward additive manufacturing is opening a parallel growth lane: spherical powder optimized for laser powder-bed fusion enables complex lattice geometries in medical implants. Key powder suppliers scale atomization lines to deliver D50 values near 3 µm with oxygen content below 200 ppm, a specification sweet spot for orthopedic cages and craniofacial meshes. Tight form-factor control will keep powder at the epicenter of the tantalum market during the forecast horizon.


By Purity: Lower Grades Anchor Cost-Sensitive Electronics
Tantalum grades below 99.95% held 79.18% share of the tantalum market size in 2025 and are projected to expand at 5.11% CAGR through 2031. Consumer electronics assemblers accept these grades because trace contaminants remain below thresholds that affect capacitance or leakage current, allowing lower overall bill-of-materials costs. Simplified hydrometallurgical flowsheets and less stringent analytical verification further reduce processing overhead, supporting volume scalability.
High-purity fractions above 99.95% address semiconductor, aerospace, and implant applications where even parts-per-million impurities can trigger device failure. Producers employ electron-beam melting and zone-refining steps to drive interstitials below 50 ppm, but such sophistication commands premiums 2-3 times standard grades. Nevertheless, demand elasticity is low; fab and OEM qualification lock in the specification, ensuring a steady allocation within the tantalum market despite limited tonnage.
By Application: Capacitors Retain Primacy Amid Dual Growth Imperatives
Capacitors accounted for 43.65% of total consumption in 2025 and are projected to register a 6.37% CAGR to 2031. Multilayered dielectrics formed on sintered powder anodes deliver high volumetric efficiency essential for 5G handsets, IoT sensors, and mission-critical defense electronics. Harsh-environment stability keeps tantalum entrenched in oil-downhole logging and avionics, sectors where performance margins outweigh cost considerations.
Semiconductor applications are the second-largest draw, with back-end-of-line metallization stacks relying on tantalum diffusion barriers. In aerospace, nickel-based super-alloys with tantalum additions enable hotter core exhaust, improving specific fuel consumption. Chemical processing capital projects continue to specify tantalum linings for acid reactors, while emerging medical uses span marker bands, bone scaffolds, and radiopaque nanoparticles. Collectively, these diverse applications reinforce the tantalum market’s balanced demand profile.
Geography Analysis
Asia-Pacific dominated with 46.50% of global consumption in 2025, and the region is forecast to post a 5.93% CAGR through 2031. China, Japan, and South Korea concentrate capacitor assembly lines, memory-chip fabs, and display-panel plants that absorb powder and sputtering targets. Taiwan’s logic-foundry expansion amplifies ultra-high-purity demand, while Korean memory producers leverage domestic research programs to trial tantalum-based MIM (metal-insulator-metal) capacitors in DDR6 modules. Australia’s rise as a co-product supplier strengthens regional supply security, reducing over-reliance on African concentrates and bolstering value-chain resilience.
North America remains a strategic end-use region anchored by aerospace, defense, and medical device verticals. Although primary mine output is limited to Canada’s Tanco operation, a robust secondary recovery network processes super-alloy scrap and electronic waste, feeding powder and alloy circuits. U.S. procurement policies that prioritize conflict-free sourcing sustain price premiums yet secure volume for jet-engine OEMs and cardiac-rhythm-management manufacturers.
Europe exhibits a mature yet stable demand curve, characterized by high engineering standards and stringent environmental regulations. Germany’s Tier-1 automotive suppliers drive capacitor off-take for advanced driver-assistance modules, while French nuclear-equipment firms specify tantalum linings for rad-waste systems. The European Union’s conflict-minerals directive tightens compliance budgets, but recycling mandates embedded in the circular economy framework gradually offset virgin-material needs. Eastern European capacitor plants offer cost-competitive assembly yet still adhere to region-wide traceability requirements.

Competitive Landscape
The tantalum market is moderately fragmented; the top five vertically integrated suppliers control a majority of mining, refining, and powder-processing capacity. Strategic initiatives include backward integration into concentrate sourcing and forward integration into component packaging, effectively locking in margin across the value chain. Joint-venture investments in Zimbabwean pegmatite resources exemplify geographic diversification aimed at reducing political-risk exposure. Intellectual-property filings emphasize particle-size control, oxygen-interstitial reduction, and solvent-free recycling flowsheets, indicating technological competition centered on purity and sustainability.
Tantalum Industry Leaders
AMG
CNMC Ningxia Orient Group Co., Ltd
Global Advanced Metals Pty Ltd
Minsur
Pilbara Minerals Limited
- *Disclaimer: Major Players sorted in no particular order

Recent Industry Developments
- August 2025: Energy Transition Minerals secured ownership of the Penouta tin/tantalum/niobium mine in Galicia, Spain, positioning the asset for near-term production of multiple critical minerals.
- May 2025: Materion acquired tantalum processing assets in Dangjin City, South Korea, expanding its manufacturing base to better serve regional semiconductor customers.


Global Tantalum Market Report Scope
Tantalum is a chemical element with the symbol Ta and atomic number 73. Tantalum is a rare, soft when, pure, blue-gray, lustrous transition metal that is highly resistant to corrosion. It is part of a group of refractory metals widely used as minor alloy components. Its main use today is in tantalum capacitors in electronic devices such as cell phones, DVD players, video game systems, and computers. The tantalum market is segmented by product, application, and geography. The market is segmented by products, such as metal, carbide, powder, alloys, and other product forms. The market is segmented by application into capacitors, semiconductors, engine turbine blades, chemical processing equipment, medical equipment, and other applications. The report also covers the market size and forecasts for the tantalum market in 14 countries across major regions. For each segment, the market sizing and forecasts have been done based on volume (tons).
| Metal |
| Carbide |
| Powder |
| Alloys |
| Other Forms |
| Less than 99.95% Purity |
| More than 99.95% Purity |
| Capacitors |
| Semiconductors |
| Engine Turbine Blades |
| Chemical Processing Equipment |
| Medical Equipment |
| Other Applications |
| Production Analysis | United States | |
| Australia | ||
| Brazil | ||
| China | ||
| Congo | ||
| Ethiopia | ||
| Nigeria | ||
| Rwanda | ||
| Other Countries | ||
| Consumption Analysis | Asia-Pacific | China |
| India | ||
| Japan | ||
| South Korea | ||
| Rest of Asia-Pacific | ||
| North America | United States | |
| Canada | ||
| Mexico | ||
| Europe | Germany | |
| United Kingdom | ||
| Italy | ||
| France | ||
| Rest of Europe | ||
| South America | Brazil | |
| Argentina | ||
| Rest of South America | ||
| Middle-East and Africa | Saudi Arabia | |
| South Africa | ||
| Rest of Middle-East and Africa | ||
| By Product | Metal | ||
| Carbide | |||
| Powder | |||
| Alloys | |||
| Other Forms | |||
| By Purity | Less than 99.95% Purity | ||
| More than 99.95% Purity | |||
| By Application | Capacitors | ||
| Semiconductors | |||
| Engine Turbine Blades | |||
| Chemical Processing Equipment | |||
| Medical Equipment | |||
| Other Applications | |||
| By Geography | Production Analysis | United States | |
| Australia | |||
| Brazil | |||
| China | |||
| Congo | |||
| Ethiopia | |||
| Nigeria | |||
| Rwanda | |||
| Other Countries | |||
| Consumption Analysis | Asia-Pacific | China | |
| India | |||
| Japan | |||
| South Korea | |||
| Rest of Asia-Pacific | |||
| North America | United States | ||
| Canada | |||
| Mexico | |||
| Europe | Germany | ||
| United Kingdom | |||
| Italy | |||
| France | |||
| Rest of Europe | |||
| South America | Brazil | ||
| Argentina | |||
| Rest of South America | |||
| Middle-East and Africa | Saudi Arabia | ||
| South Africa | |||
| Rest of Middle-East and Africa | |||


Key Questions Answered in the Report
What volume is the tantalum market projected to reach by 2031?
The sector is expected to grow from 3.00 kilotons in 2025 to 4.02 kilotons by 2031, reflecting a 4.99% CAGR.
What is the market size in 2026?
The tantalum market size is estimated at 3.15 kilotons in 2026.
Which segment is the largest consumer of tantalum?
Capacitors remain the primary outlet, accounting for 43.65% of global demand in 2025 and showing the fastest growth through 2031.
Why is Asia-Pacific dominant in tantalum consumption?
The region houses concentrated electronics manufacturing and semiconductor fabs, giving it 46.50% share of worldwide uptake in 2025.
How are lithium mines influencing tantalum supply?
Hard-rock lithium operations in Australia and Zimbabwe co-produce tantalum concentrates, diversifying supply and reducing reliance on Central African sources.
What key factor limits tantalum substitution in automotive electronics?
Niobium capacitors serve low-voltage domains, but tantalum's wider voltage range keeps it indispensable for high-voltage safety-critical systems.
Page last updated on:


