Market Overview
| Study Period | 2019 - 2031 |
|---|---|
| Forecast Data Period | 2026 - 2031 |
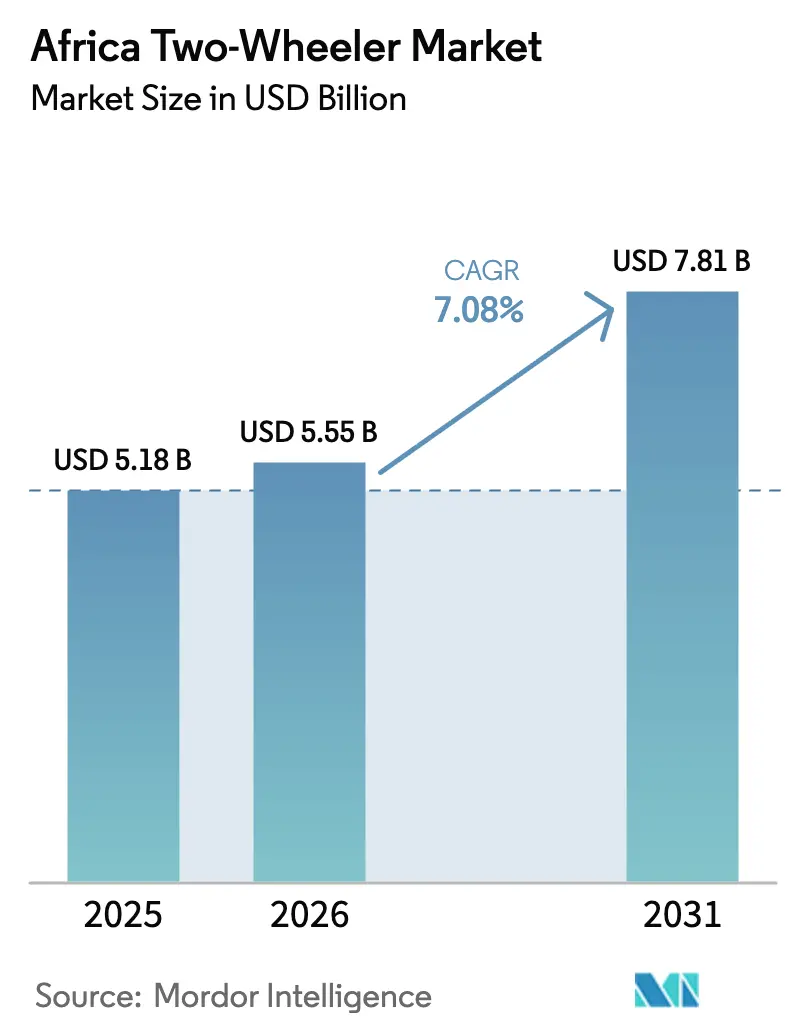
| Base Year Market Size (2025) | USD 5.18 Billion |
| Market Size (2026) | USD 5.55 Billion |
| Market Size (2031) | USD 7.81 Billion |
| Growth Rate (2026 - 2031) | 7.08% CAGR |
| Market Concentration | Medium |
Major Players *Disclaimer: Major Players sorted in no particular order Image © Mordor Intelligence. Reuse requires attribution under CC BY 4.0. | |
Africa Two-Wheeler Market Analysis by Mordor Intelligence
The African two-wheeler market size is expected to grow from USD 5.18 billion in 2025 to USD 5.55 billion in 2026 and is forecast to reach USD 7.81 billion by 2031 at a 7.08% CAGR over 2026–2031. Accelerating urbanization, a youthful demographic profile, and sustained government duty rebates for completely- and semi-knocked-down (CKD/SKD) assembly underpin this expansion. Chinese manufacturers are reducing costs on CKD kits, and with the support of financing innovations from Indian original-equipment-manufacturers (OEMs), entry-level prices remain affordable, expanding consumer access. While local currency fluctuations increase import costs, OEMs address this by enhancing local sourcing and employing hedging contracts. Additionally, the African two-wheeler market is benefiting from e-commerce-driven logistics, achieving significantly faster delivery times compared to four-wheeled vehicles, which further boosts the appeal of motorcycles.
Key Report Takeaways
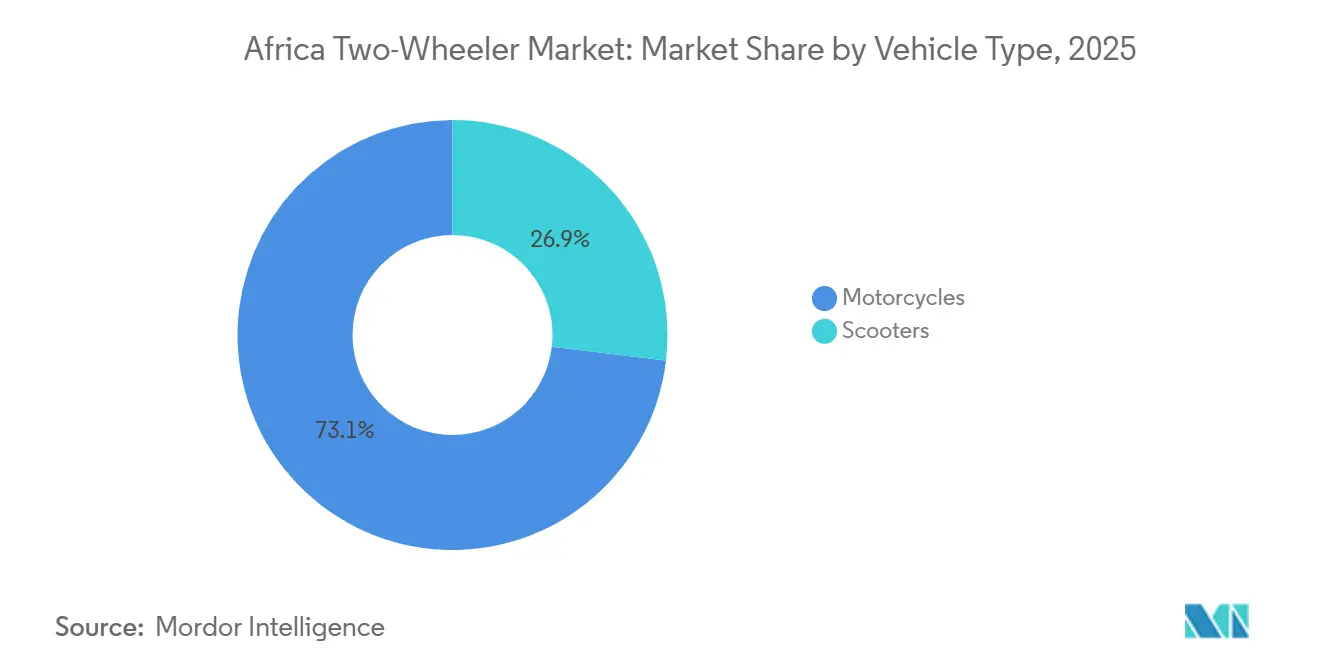
- By vehicle type, motorcycles led the African two-wheeler market with 73.18% of the market share in 2025, while scooters are projected to grow at an 8.12% CAGR through 2031.
- By propulsion, internal combustion engines maintained 89.21% of 2025 volume, whereas electric two-wheelers are advancing at a 9.21% CAGR through 2031.
- By engine capacity, the up to 110 cc bracket commanded a 28.16% share in 2025, and the 1.1–3.0 kW electric class is forecast to expand at a 7.52% CAGR through 2031.
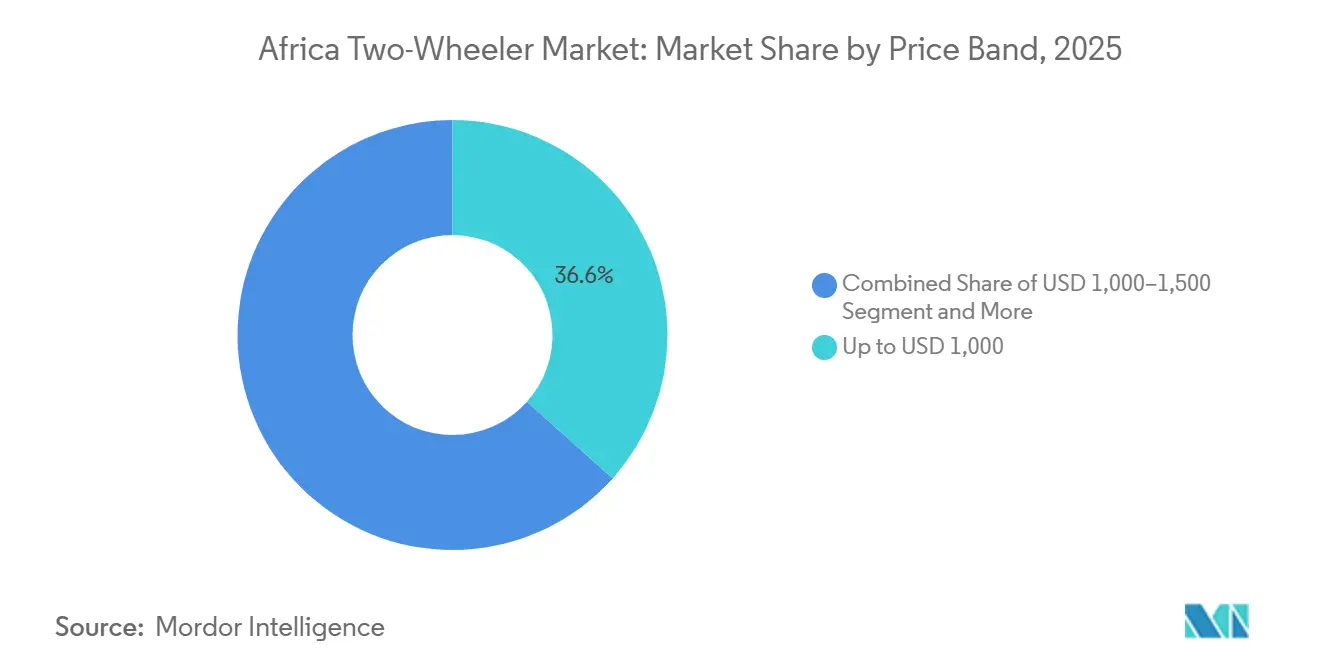
- By price band, models priced up to USD 1,000 captured 36.62% of the market in 2025, while the USD 1,501–2,000 tier is set to rise at a 7.28% CAGR over the same horizon.
- By end user, B2C purchases accounted for 65.61% of 2025 sales, whereas B2B delivery and logistics led growth with an 8.72% CAGR through 2031.
- By sales channel, offline dealerships accounted for 91.87% of the African two-wheeler market share in 2025, whereas online platforms are expected to grow at an 8.28% CAGR through 2031.
- By country, Nigeria commanded 42.61% of continental volume in 2025, and South Africa represents the fastest expansion with an 8.86% CAGR up to 2031.
Note: Market size and forecast figures in this report are generated using Mordor Intelligence’s proprietary estimation framework, updated with the latest available data and insights as of January 2026.
Africa Two-Wheeler Market Trends and Insights
Drivers Impact Analysis*
| Driver | (~) % Impact on CAGR Forecast | Geographic Relevance | Impact Timeline |
|---|---|---|---|
| Urban Logistics Growth | +1.2% | Nigeria, Kenya, Ghana | Medium term (2-4 years) |
| Millennial Spending Power | +0.9% | Rest-of-Africa core, spill-over to South Africa | Long term (≥4 years) |
| OEM Financing and Micro-Leasing | +0.8% | Kenya, Nigeria, Uganda | Short term (≤2 years) |
| CKD/SKD Duty Rebates | +0.7% | Uganda, Ghana, Kenya, Nigeria | Medium term (2-4 years) |
| Low-Cost Chinese CKD Kits | +0.6% | Nigeria, Uganda, Rwanda | Short term (≤2 years) |
| Rural Mobility via Donor Programs | +0.4% | Rural sub-Saharan Africa | Long term (≥4 years) |
| Source: Mordor Intelligence | |||


Rapid Urban Logistics Boom
E-commerce companies across Africa increasingly turn to motorcycles for last-mile delivery, especially in urban hubs like Nigeria and Kenya, where motorcycle taxis play a major economic role[1]“Logistics Performance in Sub-Saharan Cities,”, World Bank, worldbank.org. Integration with mobile-money platforms enables riders to accept digital payments and manage micro-loans, while fleet operators secure supply through forward contracts with local assemblers. In congested cities such as Lagos, Nairobi, and Accra, motorcycles consistently outperform vans in delivery speed, reinforcing their logistical advantage. This reliability allows assembly plants to operate more efficiently, reducing costs and improving scalability. These gains translate into more competitive pricing, expanding access for both business and consumer markets.
OEM Financing and Micro-Leasing Innovations
Financing models tailored to informal cash flows dismantle long-standing affordability barriers. Roam and fintech partner Mogo offer electric motorcycles with deposits as low as KES 25,000 (USD 193) and daily repayments of KES 460 (USD 3.55) over 24 months [2]“Asset-Financing Partnership with Mogo,”, Roam Electric, roam-electric.com. Battery-as-a-Service options shave upfront cost while ensuring predictable performance through managed swap stations. Seamless integration with M-Pesa covers more than 80% of two-wheeler loans in Kenya, expanding formal credit footprints. Conventional banks respond by rolling out zero-interest plans, intensifying competition, and accelerating fleet renewals across the African two-wheeler market.
Government CKD/SKD Duty Rebates
Policymakers across Africa increasingly see two-wheeler assembly as a strategic lever for industrial development. Uganda has introduced generous incentives for electric motorcycle assemblers, including tax exemptions and income-tax holidays. Kenya continues to support local assembly through duty waivers on CKD and SKD kits, helping reduce reliance on fully built imports and sustaining a vibrant local manufacturing base. South Africa’s upcoming investment allowance for electric vehicle assets reflects a broader regional commitment to boosting domestic value addition. These policy measures significantly lower the cost of locally assembled units, enabling them to compete effectively with low-cost used imports.
Donor-Funded Rural Mobility Programs
World-Bank-led rural transport initiatives funnel capital into last-mile connectivity, frequently specifying motorcycles as the primary mode because of unit economics and terrain adaptability. USAID complements funding with mechanic-training and parts-distribution schemes to ensure sustainability. Healthcare logistics benefits strongly, with motorcycles delivering medical supplies where ambulances cannot navigate. These donor programs create durable demand pools in communities previously out of reach for commercial distributors.
Restraints Impact Analysis*
| Restraint | (~) % Impact on CAGR Forecast | Geographic Relevance | Impact Timeline |
|---|---|---|---|
| Poor Secondary Roads | -0.8% | Rural sub-Saharan Africa | Long term (≥4 years) |
| Used Import Flood | -0.6% | Nigeria, Ghana, Kenya | Medium term (2-4 years) |
| Rising Compliance Costs | -0.4% | South Africa, Kenya, Ghana, Nigeria | Medium term (2-4 years) |
| Currency-Driven Import Inflation | -0.3% | Nigeria, Ghana, Kenya, Uganda | Short term (≤2 years) |
| Source: Mordor Intelligence | |||
Flood of Low-Priced Used Imports
Price-conscious buyers are drawn to used motorcycles from Japan and Thailand, which are significantly more affordable than new models. This trend is putting pressure on manufacturers' profit margins. Informal resale networks, often bypassing official dealerships, overlook warranty and safety standards. This oversight can erode consumer confidence in the pricing of new units. Additionally, in some instances, import duty structures favor used vehicles, countering efforts to promote local assembly. Demand in Africa's two-wheeler sector experiences sharp fluctuations during economic downturns, complicating production planning for industry players.
Local-Currency Volatility Raising Import Costs
Shilling, cedi, and naira swings up to 20% annually distort landed costs for CKD packs priced in USD or CNY. Assemblers hedge through forward contracts and increase local content, but exposure persists, especially on electronics and lithium-ion cells. Currency pass-through raises retail prices, testing affordability thresholds and muting unit growth in the African two-wheeler market.
*Our forecasts treat driver/restraint impacts as directional, not additive. The impact forecasts reflect baseline growth, mix effects, and variable interactions.
Segment Analysis
By Vehicle Type: Motorcycles Anchor Commercial Demand
Motorcycles captured 73.18% of the African two-wheeler market share in 2025 as their cargo capacity and ruggedness align with delivery and taxi operations. Commercial riders average more than 100 km daily, reinforcing replacement demand cycles every 28-30 months. Scooters trail but register an 8.12% CAGR to 2031, propelled by urban riders valuing automatic transmissions and nimble parking. Women and first-time riders are drawn to scooters as safety features, such as leg shields, broaden their appeal. Manufacturers tailor their marketing around lifestyle imagery while maintaining price parity with entry-level motorcycle tiers.
In rural zones, motorcycles dominate because dirt-road resilience outweighs scooter ease of use. Yet, growing gig-economy income prospects in tier-2 cities shift incremental volume toward scooters, widening OEM segment targeting. Component sharing across both formats permits supply-chain efficiencies that safeguard gross margins.


By Propulsion: ICE Still Rules but Electric Gains Momentum
Internal combustion engines account for 89.21% of the African two-wheeler market volume in 2025, aided by ubiquitous fueling networks and mechanic familiarity. Electric motorcycles, however, are projected to post a 9.21% CAGR amid donor-financed pilot fleets and breakthroughs in battery swapping. Encouraged by studies showing lower total costs per kilometer, couriers are making the switch, even if it means facing higher upfront prices. In Ethiopia, municipal bans on gasoline motorcycles within city limits are not just pushing for a quicker adoption of electric vehicles but also hinting at favorable regulatory changes for the broader region.
Infrastructure development is focusing on containerized swap stations, enabling quick turnarounds and alleviating peak loads on national grids. Original Equipment Manufacturers (OEMs) are not just selling vehicles but bundling them with swap subscriptions, creating a steady revenue stream and easing concerns about range. Meanwhile, platforms reliant on Internal Combustion Engines (ICE) are upgrading with fuel-injection systems and ensuring compatibility with alternative fuel blends to maintain their presence in areas where charging infrastructure remains limited.
By Engine Capacity: Entry-Level 110 cc Leads Volume
Engine classes up to 110 cc account for 28.16% of the 2025 volume, as cash-flow-constrained customers prioritize fuel economy. Electric classes rated 1.1–3.0 kW notch a 7.52% CAGR, mirroring cost-down battery packs and rising donor grants. Mid-range 111–150 cc engines serve peri-urban couriers needing higher torque for hilly routes, reinforcing their relevance despite electrification narratives.
OBD-II mandates and onboard telematics rollouts drive incremental cost but also enable preventive maintenance, appealing to fleet managers. Premium 250 cc-plus models remain niche, yet localized production of adventure bikes hints at future growth in the leisure segment once disposable incomes further strengthen.
By Price Band: Sub-USD 1,000 Dominance, Mid-Range Surge
Units priced up to USD 1,000 form 36.62% of the African two-wheeler market size in 2025, underscoring the central role of affordability. Still, the USD 1,501–2,000 band grows fastest at a 7.28% CAGR as micro-leases spread ownership over two- to three-year horizons. Duty rebates allow assemblers to upgrade features—LED lamps, disc brakes—without breaching psychological price ceilings.
Currency fluctuations drive the periodic reclassification of models between bands, complicating year-on-year comparisons. OEMs hedge by stocking SKD kits, configuring to rapidly meet adjacent price points, trimming inventory risk.
By End User: B2C Core Meets B2B Upside
B2C purchases accounted for a 65.61% share in 2025, driven by personal mobility aspirations and the purchasing power of millennials. Yet, B2B delivery and logistics growth climbs at an 8.72% CAGR through 2031, making fleet procurement a strategic battleground. Platforms negotiate volume discounts and service-level agreements, promoting standardized models simplifying parts stocking.
Corporate social responsibility programs in healthcare and education also drive institutional fleet orders, albeit at lower margins. OEMs cultivate after-sales contracts that guarantee uptime, embedding revenue streams beyond the initial sale.
By Sales Channel: Offline Remains King, Online Accelerates
Offline dealerships accounted for 91.87% of sales in 2025, as test rides and service reassurance remain indispensable for first-time buyers. Online channels, at 8.13% in 2025, are expected to expand at an 8.28% CAGR, driven by fintech-enabled credit scoring and doorstep delivery. Hybrid “click-and-collect” models enable consumers to reserve online and finalize their purchase in-store, bridging trust gaps. Mobile USSD codes, used in Spiro’s Airtel partnership, broaden reach among feature-phone users, further democratizing digital sales.
Geography Analysis
Nigeria remained the cornerstone of the African two-wheeler market, accounting for 42.61% of the volume in 2025. Across Lagos, Kano, and Port Harcourt, a significant number of okada riders are active. Even with state-level bans limiting passenger transport in certain areas, a blend of informal logistics and rural connectivity sustains a robust demand. CKD plants, operated by Bajaj, Honda, and various Chinese brands, not only reduce lead times but also provide a buffer against fluctuations in the naira. However, severe depreciation has tightened the grip on consumer purchasing power. While fintech leasing offers some relief, a fragmented regulatory landscape compels OEMs to customize their compliance and advocacy strategies on a state-by-state basis.
South Africa, while smaller in unit terms, is forecast to deliver the fastest major-market growth at an 8.86% CAGR to 2031. E-commerce revenue experienced significant growth recently. GreenCape anticipates a substantial increase in electric two-wheeler sales in the coming years. A relatively high ratio of paved roads and a stable currency support the adoption of premium motorcycles and scooters. However, challenges such as power outages and theft risks are driving up operating costs. Fleet operators are increasingly adopting private charging and security systems to maintain operational efficiency.
Kenya is establishing itself as a key region for testing electrification in East Africa. The removal of VAT on e-bikes and the establishment of numerous swap-network stations allow riders to travel urban routes without concerns about range. The large number of registered boda-boda riders ensures consistent demand for entry-level motorcycles. Additionally, worsening traffic congestion in Nairobi is encouraging commuters to shift towards scooters and electric vehicles.
North Africa exhibits varying trends. Egypt’s rural areas favor affordable motorcycles, while urban congestion in Cairo is boosting the popularity of scooters. Morocco is leveraging its automotive industry to develop two-wheeler assembly for export, with a focus on increasing the content of electric vehicles. Other African markets, including Tanzania, Uganda, Ghana, Rwanda, and Ethiopia, are experiencing strong growth, supported by donor-funded initiatives and emerging battery swap infrastructures. Ethiopia’s restrictions on internal combustion engines are driving consumers directly toward electric models, despite limited charging infrastructure.
Competitive Landscape
The African two-wheeler market shows moderate concentration, with a handful of leading firms, such as Bajaj Auto, TVS Motor, Honda, Haojue, and Lifan, accounting for a significant share of overall sales volume. Indian OEMs leverage brand equity, parts availability, and widespread roadside mechanic familiarity. Chinese entrants pursue aggressive cost leadership through vertical CKD integration, trimming conversion costs, and undercutting rivals on price.
Emerging regional players exploit niche positioning: Kibo Africa tailors rugged 160 cc models for Kenyan terrain, while Mauto Electric focuses on battery-swap ecosystems. Closed-loop models such as Spiro’s integrate assembly, financing, and energy supply, raising entry barriers. Technology deployment centers on mobile-money–linked telematics that track repayments and schedule preventive maintenance.
Regulatory convergence around UNECE safety standards filters out sub-scale assemblers unable to fund homologation, driving impending consolidation. Nonetheless, donor-backed social-enterprise importers preserve competitive diversity by championing rural-mobility missions.
Africa Two-Wheeler Industry Leaders
Bajaj Auto Ltd.
Honda Motor Co. Ltd.
TVS Motor Company
Hero MotoCorp Ltd.
Yamaha Motor Co. Ltd.
- *Disclaimer: Major Players sorted in no particular order


Recent Industry Developments
- June 2025: In a move underscoring its commitment to expanding in African markets, TVS Motor Company, hailing from India, has unveiled its upgraded HLX 150 5G motorcycle in Lubumbashi, Republic of Congo. This new iteration boasts a suite of enhanced features, such as an LED headlamp, adjustable rear suspension, and tubeless tyres.
- June 2025: In June 2025, Spiro, Africa's leading e-motorcycle assembler, kicked off its electric motorcycle production in Uganda. The company is set to produce e-motorcycles, home chargers, and battery-swapping stations at a facility that's already 80% complete. This plant, developed through a joint venture, boasts an impressive annual production capacity of 50,000 units.


Africa Two-Wheeler Market Report Scope
The Africa Two-Wheeler Market Report is Segmented by Vehicle Type (Motorcycles and Scooters), Propulsion (ICE and Electric), Engine Capacity (Up To 110 Cc, 111-125 Cc, and More), Price Band (Up To USD 1, 000, and More), End User (B2C and B2B ), Sales Channel (Online and Offline), and Country. The Market Forecasts are Provided in Terms of Value (USD).
By Vehicle Type
| Motorcycles |
| Scooters |
Propulsion
| Internal Combustion Engine (ICE) |
| Electric |
By Engine Capacity / Motor Power
| ICE | Up to110 cc |
| 111-125 cc | |
| 126-150 cc | |
| 151-200 cc | |
| 201-250 cc | |
| 250-350 cc | |
| 350-500 cc | |
| Above 500 cc | |
| Electric | Up to 1.0 kW |
| 1.1-3.0 kW | |
| 3.1-5.0 kW | |
| Above 5.0 kW |
By Price Band
| Up to USD 1,000 |
| USD 1,000-1,500 |
| USD 1,501-2,000 |
| USD 2,001-3,000 |
| USD 3,001-5,000 |
| Above USD 5,000 |
By End User
| B2C | |
| B2B | Ride-hail / Bike-Taxi / Rental / Tourism |
| Delivery and Logistics | |
| Corporate and SME Fleets | |
| Others (Government, NGO, Institutional) |
Sales Channel
| Online |
| Offline |
Country
| South Africa |
| Nigeria |
| Kenya |
| Egypt |
| Morocco |
| Rest-of-Africa |
| By Vehicle Type | Motorcycles | |
| Scooters | ||
| Propulsion | Internal Combustion Engine (ICE) | |
| Electric | ||
| By Engine Capacity / Motor Power | ICE | Up to110 cc |
| 111-125 cc | ||
| 126-150 cc | ||
| 151-200 cc | ||
| 201-250 cc | ||
| 250-350 cc | ||
| 350-500 cc | ||
| Above 500 cc | ||
| Electric | Up to 1.0 kW | |
| 1.1-3.0 kW | ||
| 3.1-5.0 kW | ||
| Above 5.0 kW | ||
| By Price Band | Up to USD 1,000 | |
| USD 1,000-1,500 | ||
| USD 1,501-2,000 | ||
| USD 2,001-3,000 | ||
| USD 3,001-5,000 | ||
| Above USD 5,000 | ||
| By End User | B2C | |
| B2B | Ride-hail / Bike-Taxi / Rental / Tourism | |
| Delivery and Logistics | ||
| Corporate and SME Fleets | ||
| Others (Government, NGO, Institutional) | ||
| Sales Channel | Online | |
| Offline | ||
| Country | South Africa | |
| Nigeria | ||
| Kenya | ||
| Egypt | ||
| Morocco | ||
| Rest-of-Africa | ||


Market Definition
- Vehicle Type - The category covers motorized two-wheelers.
- Vehicle Body Type - This includes Scooters and Motorcycles, while Kick-scooters and Bicycles are excluded.
- Fuel Category - Coverage extends to vehicles powered by Internal Combustion Engines (ICE) and electric propulsion systems.
| Keyword | Definition |
|---|---|
| Electric Vehicle (EV) | A vehicle which uses one or more electric motors for propulsion. Includes cars, buses, and trucks. This term includes all-electric vehicles or battery electric vehicles and plug-in hybrid electric vehicles. |
| BEV | A BEV relies completely on a battery and a motor for propulsion. The battery in the vehicle must be charged by plugging it into an outlet or public charging station. BEVs do not have an ICE and hence are pollution-free. They have a low cost of operation and reduced engine noise as compared to conventional fuel engines. However, they have a shorter range and higher prices than their equivalent gasoline models. |
| PEV | A plug-in electric vehicle is an electric vehicle that can be externally charged and generally includes all-electric vehicles as well as plug-in hybrids. |
| Plug-in Hybrid EV | A vehicle that can be powered either by an ICE or an electric motor. In contrast to normal hybrid EVs, they can be charged externally. |
| Internal combustion engine | An engine in which the burning of fuels occurs in a confined space called a combustion chamber. Usually run with gasoline/petrol or diesel. |
| Hybrid EV | A vehicle powered by an ICE in combination with one or more electric motors that use energy stored in batteries. These are continually recharged with power from the ICE and regenerative braking. |
| Commercial Vehicles | Commercial vehicles are motorized road vehicles designed for transporting people or goods. The category includes light commercial vehicles (LCVs) and medium and heavy-duty vehicles (M&HCV). |
| Passenger Vehicles | Passenger cars are electric motor– or engine-driven vehicles with at least four wheels. These vehicles are used for the transport of passengers and comprise no more than eight seats in addition to the driver’s seat. |
| Light Commercial Vehicles | Commercial vehicles that weigh less than 6,000 lb (Class 1) and in the range of 6,001–10,000 lb (Class 2) are covered under this category. |
| M&HDT | Commercial vehicles that weigh in the range of 10,001–14,000 lb (Class 3), 14,001–16,000 lb (Class 4), 16,001–19,500 lb (Class 5), 19,501–26,000 lb (Class 6), 26,001–33,000 lb (Class 7) and above 33,001 lb (Class 8) are covered under this category. |
| Bus | A mode of transportation that typically refers to a large vehicle designed to carry passengers over long distances. This includes transit bus, school bus, shuttle bus, and trolleybuses. |
| Diesel | It includes vehicles that use diesel as their primary fuel. A diesel engine vehicle have a compression-ignited injection system rather than the spark-ignited system used by most gasoline vehicles. In such vehicles, fuel is injected into the combustion chamber and ignited by the high temperature achieved when gas is greatly compressed. |
| Gasoline | It includes vehicles that use gas/petrol as their primary fuel. A gasoline car typically uses a spark-ignited internal combustion engine. In such vehicles, fuel is injected into either the intake manifold or the combustion chamber, where it is combined with air, and the air/fuel mixture is ignited by the spark from a spark plug. |
| LPG | It includes vehicles that use LPG as their primary fuel. Both dedicated and bi-fuel LPG vehicles are considered under the scope of the study. |
| CNG | It includes vehicles that use CNG as their primary fuel. These are vehicles that operate like gasoline-powered vehicles with spark-ignited internal combustion engines. |
| HEV | All the electric vehicles that use batteries and an internal combustion engine (ICE) as their primary source for propulsion are considered under this category. HEVs generally use a diesel-electric powertrain and are also known as hybrid diesel-electric vehicles. An HEV converts the vehicle momentum (kinetic energy) into electricity that recharges the battery when the vehicle slows down or stops. The battery of HEV cannot be charged using plug-in devices. |
| PHEV | PHEVs are powered by a battery as well as an ICE. The battery can be charged through either regenerative breaking using the ICE or by plugging into some external charging source. PHEVs have a better range than BEVs but are comparatively less eco-friendly. |
| Hatchback | These are compact-sized cars with a hatch-type door provided at the rear end. |
| Sedan | These are usually two- or four-door passenger cars, with a separate area provided at the rear end for luggage. |
| SUV | Popularly known as SUVs, these cars come with four-wheel drive, and usually have high ground clearance. These cars can also be used as off-road vehicles. |
| MPV | These are multi-purpose vehicles (also called minivans) designed to carry a larger number of passengers. They carry between five and seven people and have room for luggage too. They are usually taller than the average family saloon car, to provide greater headroom and ease of access, and they are usually front-wheel drive. |


Research Methodology
Mordor Intelligence follows a four-step methodology in all its reports.
- Step-1: Identify Key Variables: To build a robust forecasting methodology, the variables and factors identified in Step-1 are tested against available historical market numbers. Through an iterative process, the variables required for market forecast are set and the model is built based on these variables.
- Step-2: Build a Market Model: Market-size estimations for the historical and forecast years have been provided in revenue and volume terms. Market revenue is calculated by multiplying the sales volume with their respective average selling price (ASP). While estimating ASP factors like average inflation, market demand shift, manufacturing cost, technological advancement, and varying consumer preference, among others have been taken into account.
- Step-3: Validate and Finalize: In this important step, all market numbers, variables, and analyst calls are validated through an extensive network of primary research experts from the market studied. The respondents are selected across levels and functions to generate a holistic picture of the market studied.
- Step-4: Research Outputs: Syndicated Reports, Custom Consulting Assignments, Databases & Subscription Platforms.


