Market Overview
| Study Period | 2021 - 2031 |
|---|---|
| Forecast Data Period | 2026 - 2031 |
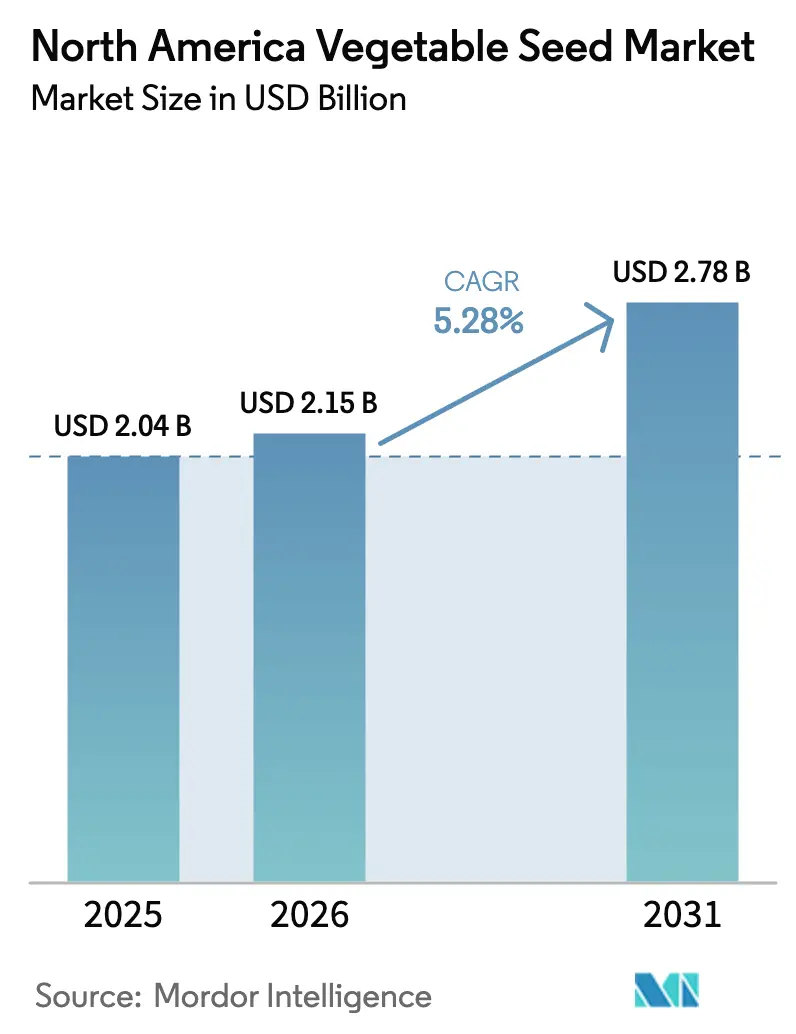
| Base Year Market Size (2025) | USD 2.04 Billion |
| Market Size (2026) | USD 2.15 Billion |
| Market Size (2031) | USD 2.78 Billion |
| Growth Rate (2026 - 2031) | 5.28% CAGR |
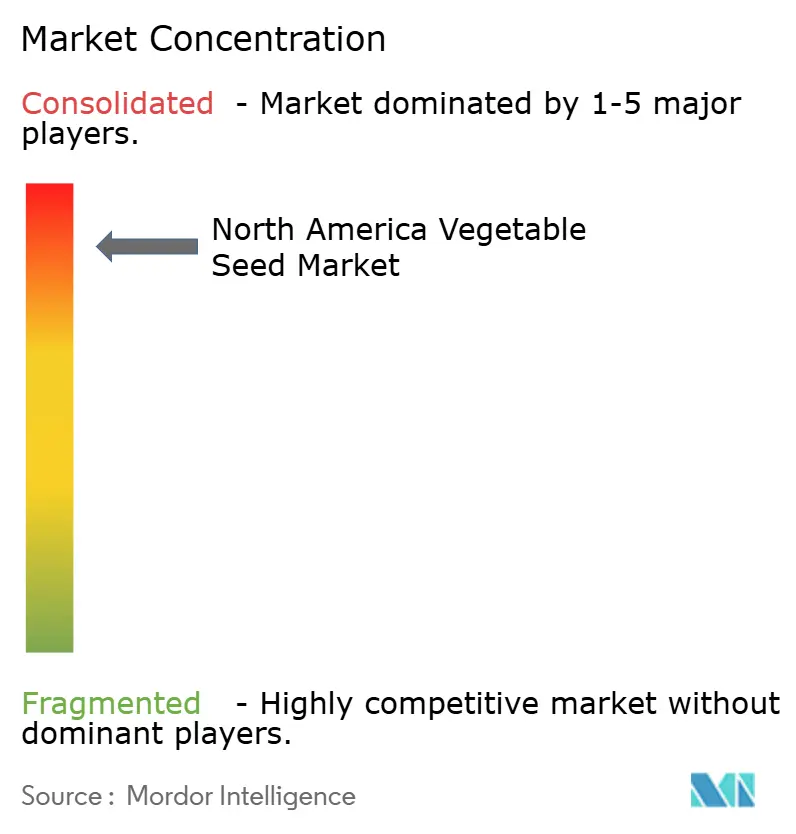
| Market Concentration | High |
Major Players *Disclaimer: Major Players sorted in no particular order Image © Mordor Intelligence. Reuse requires attribution under CC BY 4.0. | |
North America Vegetable Seed Market Analysis by Mordor Intelligence
The North America vegetable seed market size was valued at USD 2.04 billion in 2025 and estimated to grow from USD 2.15 billion in 2026 to reach USD 2.78 billion by 2031, at a CAGR of 5.28% during the forecast period (2026-2031). Adoption of hybrid genetics remains the single largest growth lever as disease pressure intensifies and carbon-credit schemes reward higher yields. Demand is also swelling for seed lines engineered for controlled-environment agriculture, a niche that is scaling faster than open-field acreage as growers hedge against climate volatility. Streamlined United States gene-editing rules are cutting commercial launch timelines in half, allowing premium-priced disease-resistant traits to reach the farm gate sooner. Competitive rivalry is sharpening because the top five suppliers draw almost seven-tenths of revenue, yet white space persists in organic open-pollinated genetics and dwarf cultivars suited to vertical farms. Counterfeit packets circulating through Mexico’s gray market temper near-term upside but also spur investments in seed authentication technology.
Key Report Takeaways
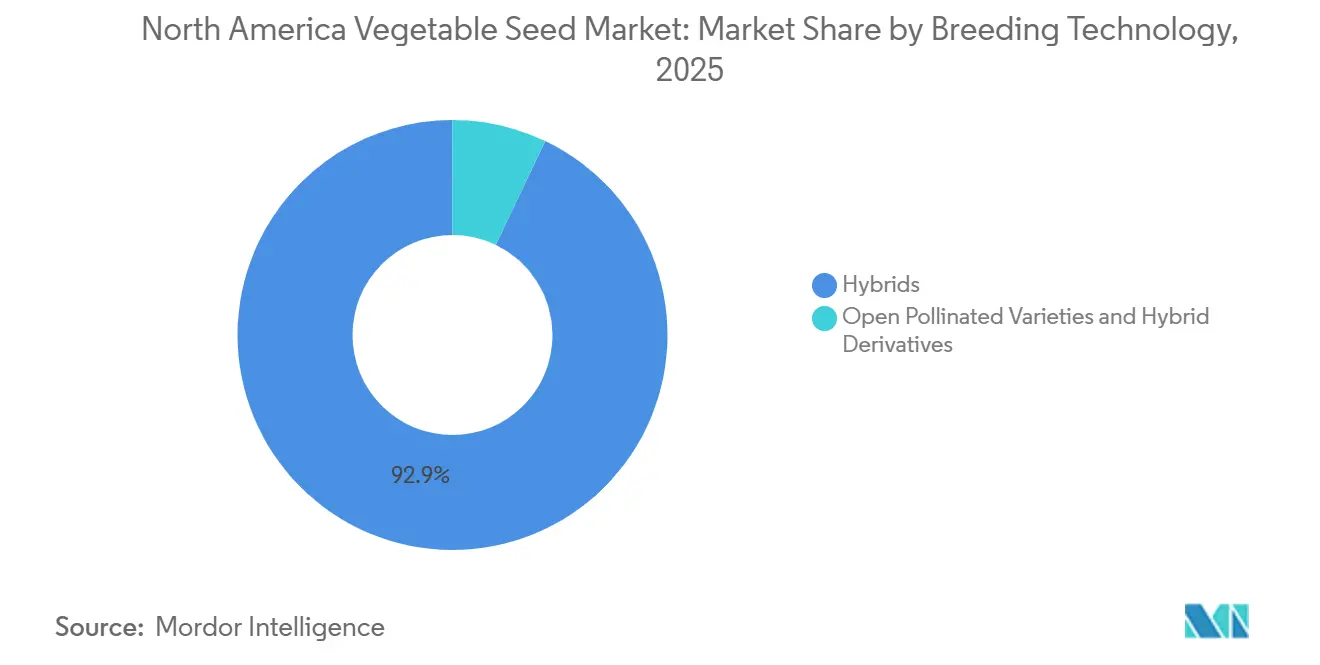
- By breeding technology, hybrids dominated with 92.9% of the North America vegetable seed market share in 2025, while open-pollinated varieties and hybrids derivatives are anticipated to record the strongest growth, advancing at a 5.3% CAGR through 2031.
- By cultivation mechanism, the open field was the largest segment, accounting for 95.7% of the North America vegetable seed market size in 2025. Protected cultivation is the fastest-growing segment, set to expand at a 7.6% CAGR to 2031.
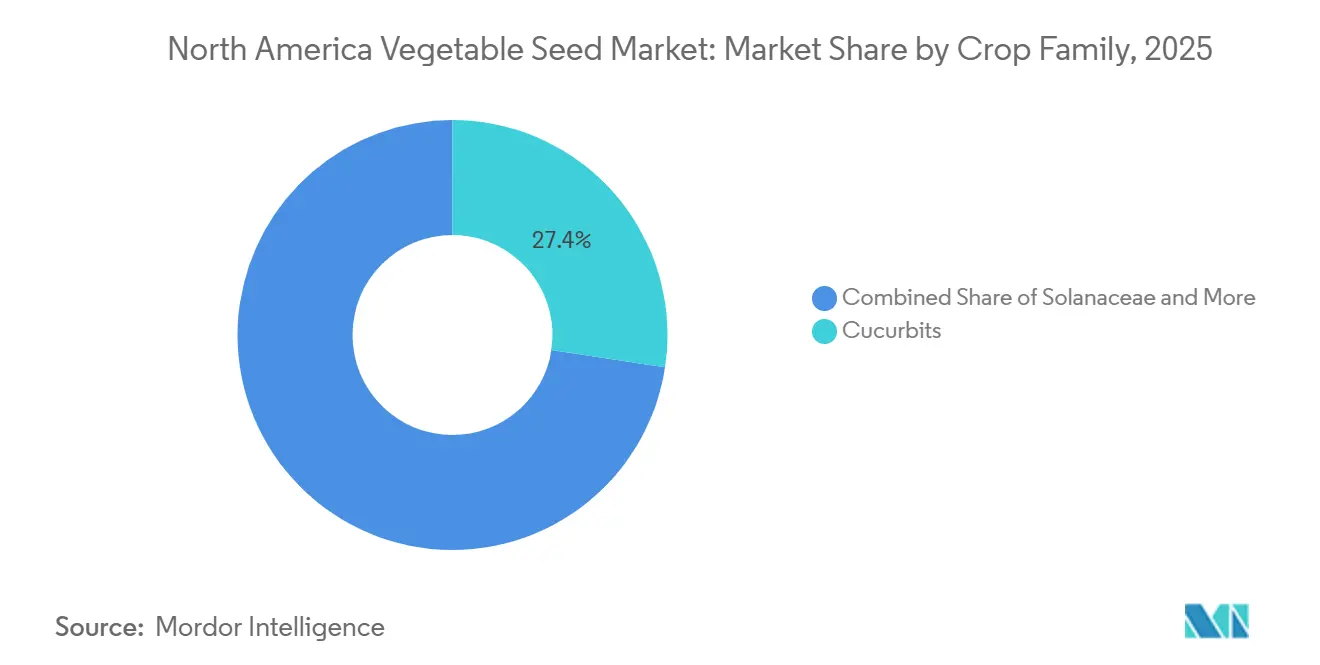
- By crop family, cucurbits accounted for the largest portion of the market at 27.4% in 2025, whereas solanaceae is anticipated to outpace other families, registering a 7.0% CAGR over the forecast period to 2031.
- By geography, the United States held the dominant position with a 69.1% market share in 2025, while Mexico is forecast to emerge as the fastest-growing country, posting a 5.7% CAGR through 2031.
Note: Market size and forecast figures in this report are generated using Mordor Intelligence’s proprietary estimation framework, updated with the latest available data and insights as of 2026.
North America Vegetable Seed Market Trends and Insights
Drivers Impact Analysis*
| Driver | (~) % Impact on CAGR Forecast | Geographic Relevance | Impact Timeline |
|---|---|---|---|
| Rising adoption of hybrid varieties | +1.3% | United States and Canada, spillover to northern Mexico greenhouse clusters | Medium term (2-4 years) |
| Expansion of controlled-environment agriculture | +1.1% | United States (California, Arizona, Texas); Canada (Ontario, British Columbia) | Long term (≥ 4 years) |
| Growth of direct-to-farmer e-commerce | +0.9% | North America, strongest in U.S. Midwest and Canadian Prairie provinces | Short term (≤ 2 years) |
| CRISPR-edited seed approvals accelerating trait launches | +1.0% | United States; Canada following regulatory harmonization | Medium term (2-4 years) |
| Vertical-farm demand for dwarf cultivars | +0.7% | U.S. urban centers (New York, San Francisco, Chicago); emerging in Toronto | Long term (≥ 4 years) |
| Carbon-credit premiums for high-yield cultivars | +0.4% | United States (California, Iowa); Canada (Alberta, Saskatchewan) | Medium term (2-4 years) |
| Source: Mordor Intelligence | |||
Rising Adoption of Hybrid Varieties
The adoption of hybrid vegetable seeds is a significant growth driver in North America. Hybrid seeds provide higher yields, more uniform crop quality, improved disease resistance, and better stress tolerance than open-pollinated varieties. In the United States and Canada, commercial growers increasingly favor hybrids for their ability to boost productivity per acre and ensure consistent quality, which is essential for large retail chains and export markets. Hybrid seed use in key vegetable crops such as tomatoes, peppers, lettuce, and cucurbits has achieved high penetration across many commercial segments in the United States. Additionally, hybrids are being developed with traits such as climate resilience, heat tolerance, drought resistance, and resistance to emerging pathogens.
Expansion of Controlled-Environment Agriculture
Protected acreage grew, led by greenhouse tomato and cucumber houses in Mexico and Canada. Controlled-environment agriculture, which includes greenhouses and vertical farms, is expanding rapidly in the United States and Canada. This agricultural method requires specialized seed varieties designed for indoor lighting, hydroponic systems, and high-density planting, creating a premium segment within the vegetable seed market. In 2024, Statistics Canada reported 974 commercial greenhouse vegetable operations in Canada, producing 866,484 metric tons of vegetables, a 5% increase from 2023[1]Source: Statistics Canada, “Greenhouse Vegetable Production, 2024 Edition,” statcan.gc.ca. Seeds for controlled-environment agriculture must perform effectively under artificial light spectra and nutrient-controlled systems, increasing research and development complexity and enhancing seed value.
Growth of Direct-to-Farmer E-Commerce Channels
Online seed sales to commercial vegetable growers have increased significantly, with platforms such as Johnny's Selected Seeds and High Mowing Organic Seeds gaining market share from traditional distributor networks. The rise in average online seed orders through distributors has encouraged the trial of niche genetics. Additionally, FedEx Freight has reduced Midwest transit times for temperature-controlled seed deliveries to three days, minimizing germination losses. In response, larger breeders have introduced their own online portals, bypassing wholesalers to maintain profit margins. The digitalization of agricultural input distribution is reshaping the vegetable seed market. Direct-to-farmer e-commerce platforms allow seed companies to directly engage with small- and medium-scale growers, reducing dependence on traditional distributors. This shift enhances product availability, pricing transparency, and access to niche seed varieties.
Carbon-Credit Premiums for High-Yield Cultivars
Sustainability incentives are increasingly influencing vegetable production. High-yield hybrid varieties enhance land-use efficiency and reduce per-unit carbon intensity. Certain carbon-credit programs reward improved productivity and reduced input use. According to the United States Department of Agriculture (USDA), climate-smart agriculture initiatives are expanding incentives for adopting sustainable production methods. In January 2025, the USDA published a progress report highlighting the outcomes of partnerships for climate-smart commodities, which included a funding initiative. The government allocated over USD 3 billion to 140 pilot projects, some of which offer incentive payments to farmers and ranchers for implementing climate-smart practices, thereby driving market growth[2]Source: United States Department of Agriculture, “Partnerships for Climate-Smart Commodities Progress Report,” usda.gov.
Restraints Impact Analysis*
| Restraint | (~) % Impact on CAGR Forecast | Geographic Relevance | Impact Timeline |
|---|---|---|---|
| Regulatory uncertainty for biotech traits | −1.0% | United States and Canada with trade friction affecting Mexico | Medium term (2-4 years) |
| Climate-driven pest-pressure volatility | −0.8% | United States Southeast and Southwest; Mexico Sinaloa and Sonora | Short term (≤ 2 years) |
| Distributor consolidation squeezing small breeders | −0.6% | United States Midwest and Great Plains; Canada Prairie provinces | Long term (≥ 4 years) |
| Counterfeit seed trade in Mexico’s gray market | −0.5% | Mexico Sinaloa, Jalisco, Michoacán, spillover to southern Texas | Short term (≤ 2 years) |
| Source: Mordor Intelligence | |||
Regulatory Uncertainty for Biotech Traits
While the United States has clear regulations for gene editing, regulatory inconsistencies across North America continue to pose significant challenges. Mexico has implemented stricter biotech policies that impact imports and approvals, leading to trade disruptions. For example, the commercialization of disease-resistant vegetable varieties intended for the Mexican market has been delayed. This has resulted in higher compliance costs for companies and increased shipment uncertainty. Such delays can lead to millions in holding costs and deferred revenue recognition. Smaller breeders spend a disproportionate share of their budgets navigating divergent state labeling laws, diverting funds from R&D. In 2022, Health Canada’s draft guidance promises harmonization, yet timelines remain fluid. Until bilateral protocols align, investors apply higher risk discounts to biotech pipelines[3]Source: Health Canada, “Draft Guidance on Regulatory Oversight of Gene-Edited Plants, 2022,” canada.ca.
Climate-Driven Pest-Pressure Volatility
Climate change is intensifying the unpredictability of pests and diseases across North America. Rising temperatures are expanding pest habitats, while extreme weather events heighten the risk of disease outbreaks. According to climate assessments by the United States Department of Agriculture, specialty crops are particularly susceptible to changes in pest dynamics. In response, growers have adopted drought-tolerant tomato and lettuce hybrids. However, these varieties often involve trade-offs in flavor or shelf life, limiting their suitability for premium retail markets. Additionally, shifting pest migration patterns requires growers to frequently change seed varieties to address evolving resistance issues, leading to increased risks and costs. The unpredictability of pest patterns also shortens the product life cycles of resistant hybrids, driving up breeding expenses and reducing long-term profitability for seed companies.
*Our forecasts treat driver/restraint impacts as directional, not additive. The impact forecasts reflect baseline growth, mix effects, and variable interactions.
Segment Analysis
By Breeding Technology: Hybrids Dominate Despite Open-Pollinated Varieties Resurgence
Hybrids were the largest segment, holding 92.9% of the North America vegetable seed market share in 2025, driven by their higher yields and disease-resistance traits, which justify premium pricing for commercial growers. The advantages of heterosis in vegetables result in higher yields, which justify premium pricing for commercial farms. In the United States, transgenic hybrids with stacked herbicide tolerance and insect resistance command premium prices, contributing to segment value growth. Non-transgenic hybrids remain essential for organic and export-sensitive markets, although they lag behind commercial hybrids in yield performance. In Mexico, regulatory preferences for non-genetically modified organism (non-GMO) traits direct research and development efforts toward conventional hybrids, strengthening the position of seed companies with robust back-cross breeding programs.
Open-pollinated varieties and hybrid derivatives are the fastest-growing segment, projected to advance at a 5.3% CAGR through 2031, surpassing the overall market growth rate. This growth is driven by demand from organic producers and seed-saving farmers who prefer non-proprietary genetics. While open-pollinated varieties remain relevant for seed-saving practices and specific organic certifications, economies of scale strongly favor hybrids, particularly in export-oriented tomato and pepper production. The yield gap between hybrids and open-pollinated varieties is narrowing in certain crop categories. Smallholders continue to prefer open-pollinated varieties and hybrid due to their seed-saving potential and lower initial costs, especially in crops like onions, where hybrid seeds are priced four times higher than open-pollinated varieties and hybrid.


By Cultivation Mechanism: Protected Cultivation Accelerates
The open field was the largest segment, accounting for 95.7% of the North America vegetable seed market size in 2025. The shift toward open-field intensification is driven by economic pressures favoring scalable production systems over the higher costs associated with protected cultivation. This trend is further supported by advancements in precision agriculture technologies, which now enable field-based optimization that was previously limited to controlled environments.
Protected cultivation is the fastest-growing segment, set to expand at a 7.6% CAGR through 2031. The adoption of precision agriculture and the development of climate-adapted varieties are key drivers of this shift. The apparent contradiction between protected cultivation and open-field growth arises from differences in measurement methodologies. Protected cultivation encompasses controlled environment agriculture for high-value crops such as vegetables and specialty seeds, while open-field growth reflects the expansion of traditional row crop acreage and increased seed use per acre. Additionally, with power and water tariffs stabilizing under new state policies, protected growers anticipate payback periods of less than five years, boosting demand for specialized determinate seed lines.
By Crop Family: Solanaceae Leads, Cucurbits Surge
Cucurbits were the largest segment, accounting for 27.4% of the North America vegetable seed market share in 2025. Cucurbits benefit from the acceleration of cucumber cultivation in greenhouses, while roots and bulbs maintain consistent rotational acreage. Unclassified vegetables, such as lettuce and spinach, are dependent on advancements in vertical farming to drive renewed growth. Roots and bulbs, including onions, garlic, and potatoes, display unique market dynamics. Onion seed prices have increased significantly due to poor harvests in Oregon's Willamette Valley, a key supplier of hybrid onion seeds for North America.
Solanaceae is the fastest-growing segment, forecast to register a 7.0% CAGR through 2031. Chili and eggplant, smaller segments within the Solanaceae family, are experiencing growth driven by the rising popularity of ethnic cuisine trends. Brassicas, including cabbage, cauliflower, and broccoli, held a significant market share in 2025, with growth limited by declining per-capita consumption in the United States.
Geography Analysis
The United States was the largest country, holding 69.1% of the North America vegetable seed market in 2025, supported by California's expansion of vegetable fields and processing lines that anchor the North America vegetable seed market. California plays a significant role in the market, driven by high per-acre seed expenditures for vegetables and orchard crops, which contribute to the state's strong agricultural economy. In the United States, vegetable seeds account for a smaller market share but are experiencing double-digit growth rates due to rising consumer demand for fresh, locally sourced produce. The rising popularity of plant-based proteins is boosting the demand for pulses, prompting breeders to enhance food-grade traits.
Mexico is the fastest-growing country, projected to expand at a 5.7% CAGR through 2031, Vegetables in Mexico are experiencing rapid growth, primarily driven by greenhouse peppers and tomatoes catering to North American off-season demand. Export buyers prioritize uniformity and Brix levels, prompting seed suppliers to focus on post-harvest quality traits. Trials for biological seed coatings that enhance seedling vigor are underway at UPL’s Ramos Arizpe center, reflecting increased R&D investment in the vegetable segment. Demand is centered on high-density, disease-resistant hybrids designed for continuous harvest cycles to supply United States supermarkets.
Canada held a significant market share in 2025, with Ontario and British Columbia leading in greenhouse vegetable production. British Columbia increased organic seed acreage by 19%, aligning with United States Department regulations requiring certified organic seeds when commercially available. The rest of North America, including the Caribbean and Central American territories, contributed less to market value in 2025 but experienced niche growth in tropical vegetable seed production for export to ethnic markets in the United States.
Competitive Landscape
The North America vegetable seed market is highly concentrated, with established players leveraging technological advancements and strategic partnerships to maintain their competitive positions. Leading companies such as Syngenta Group, Bayer AG, Rijk Zwaan Zaadteelt en Zaadhandel BV, Groupe Limagrain, and BASF SE are integrating genome editing capabilities through collaborations with specialized biotechnology firms. These partnerships enable faster development of desirable traits while ensuring control over commercial distribution channels.
Opportunities are arising in areas such as vertical-farm cultivars and carbon-credit-eligible varieties, with technology adoption serving as a key differentiator among market leaders. The competitive landscape reflects a balance between the advantages of scale in breeding and distribution and the specialized capabilities required for niche market segments. Companies like High Mowing Organic Seeds and Johnny's Selected Seeds cater to organic and specialty markets, which are less susceptible to commoditization.
Regulatory scrutiny is intensifying, as evidenced by the United States Department of Agriculture-Department of Justice memorandum, which signals stricter antitrust oversight and may limit future mega-mergers. Intellectual property enforcement remains critical, with counterfeit deterrence efforts in Mexico and gene-editing patent portfolios in the United States shaping competitive boundaries. Growth opportunities exist in the development of climate-resilient traits, protected-cultivation toolkits, and organoleptic enhancements that align with premium retail market demands.
North America Vegetable Seed Industry Leaders
BASF SE
Bayer AG
Groupe Limagrain
Rijk Zwaan Zaadteelt en Zaadhandel BV
Syngenta Group
- *Disclaimer: Major Players sorted in no particular order

Recent Industry Developments
- September 2025: USDA and Department of Justice signed a Memorandum of Understanding to enhance competition in farm inputs markets, including seeds, signaling increased regulatory scrutiny of industry consolidation and potentially creating opportunities for smaller market participants.
- March 2025: New Mexico State University released NuMex Enchantment serrano pepper variety with 61,000 Scoville Heat Units and enhanced sunscald resistance, contributing to public breeding efforts that support regional adaptation and genetic diversity.
- March 2024: Syngenta and Emerald Seed signed an exclusive licensing deal covering onion genetics for North America.


North America Vegetable Seed Market Report Scope
A vegetable seed is a small unit containing an embryo, a food supply, and a protective seed coat, enabling it to develop into a new plant under suitable conditions.
The North America Vegetable Seed Market Report provides a detailed assessment of the market across breeding technologies such as hybrids and open-pollinated varieties and hybrid derivatives. It further evaluates the market by cultivation mechanism, covering open field and protected cultivation systems, and by crop family, including brassicas, cucurbits, roots and bulbs, solanaceae, and unclassified vegetables. Geographically, the analysis spans Canada, Mexico, the United States, and the Rest of North America. Market estimates and forecasts are presented in terms of value in USD and volume in metric tons.
By Breeding Technology
| Hybrids |
| Open Pollinated Varieties and Hybrid Derivatives |
By Cultivation Mechanism
| Open Field |
| Protected Cultivation |
By Crop Family
| Brassicas | Cabbage |
| Cauliflower and Broccoli | |
| Other Brassicas | |
| Cucurbits | Cucumber and Gherkin |
| Pumpkin and Squash | |
| Other Cucurbits | |
| Roots and Bulbs | Garlic |
| Onion | |
| Potato | |
| Other Roots and Bulbs | |
| Solanaceae | Chilli |
| Eggplant | |
| Tomato | |
| Other Solanaceae | |
| Unclassified Vegetables | Asparagus |
| Lettuce | |
| Carrot | |
| Okra | |
| Peas | |
| Spinach | |
| Other Unclassified Vegetables |
By Geography
| Canada |
| Mexico |
| United States |
| Rest of North America |
| By Breeding Technology | Hybrids | |
| Open Pollinated Varieties and Hybrid Derivatives | ||
| By Cultivation Mechanism | Open Field | |
| Protected Cultivation | ||
| By Crop Family | Brassicas | Cabbage |
| Cauliflower and Broccoli | ||
| Other Brassicas | ||
| Cucurbits | Cucumber and Gherkin | |
| Pumpkin and Squash | ||
| Other Cucurbits | ||
| Roots and Bulbs | Garlic | |
| Onion | ||
| Potato | ||
| Other Roots and Bulbs | ||
| Solanaceae | Chilli | |
| Eggplant | ||
| Tomato | ||
| Other Solanaceae | ||
| Unclassified Vegetables | Asparagus | |
| Lettuce | ||
| Carrot | ||
| Okra | ||
| Peas | ||
| Spinach | ||
| Other Unclassified Vegetables | ||
| By Geography | Canada | |
| Mexico | ||
| United States | ||
| Rest of North America | ||


Market Definition
- Commercial Seed - For the purpose of this study, only commercial seeds have been included as part of the scope. Farm-saved Seeds, which are not commercially labeled are excluded from scope, even though a minor percentage of farm-saved seeds are exchanged commercially among farmers. The scope also excludes vegetatively reproduced crops and plant parts, which may be commercially sold in the market.
- Crop Acreage - While calculating the acreage under different crops, the Gross Cropped Area has been considered. Also known as Area Harvested, according to the Food & Agricultural Organization (FAO), this includes the total area cultivated under a particular crop across seasons.
- Seed Replacement Rate - Seed Replacement Rate is the percentage of area sown out of the total area of crop planted in the season by using certified/quality seeds other than the farm-saved seed.
- Protected Cultivation - The report defines protected cultivation as the process of growing crops in a controlled environment. This includes greenhouses, glasshouses, hydroponics, aeroponics, or any other cultivation system that protects the crop against any abiotic stress. However, cultivation in an open field using plastic mulch is excluded from this definition and is included under open field.
| Keyword | Definition |
|---|---|
| Row Crops | These are usually the field crops which include the different crop categories like grains & cereals, oilseeds, fiber crops like cotton, pulses, and forage crops. |
| Solanaceae | These are the family of flowering plants which includes tomato, chili, eggplants, and other crops. |
| Cucurbits | It represents a gourd family consisting of about 965 species in around 95 genera. The major crops considered for this study include Cucumber & Gherkin, Pumpkin and squash, and other crops. |
| Brassicas | It is a genus of plants in the cabbage and mustard family. It includes crops such as carrots, cabbage, cauliflower & broccoli. |
| Roots & Bulbs | The roots and bulbs segment includes onion, garlic, potato, and other crops. |
| Unclassified Vegetables | This segment in the report includes the crops which don’t belong to any of the above-mentioned categories. These include crops such as okra, asparagus, lettuce, peas, spinach, and others. |
| Hybrid Seed | It is the first generation of the seed produced by controlling cross-pollination and by combining two or more varieties, or species. |
| Transgenic Seed | It is a seed that is genetically modified to contain certain desirable input and/or output traits. |
| Non-Transgenic Seed | The seed produced through cross-pollination without any genetic modification. |
| Open-Pollinated Varieties & Hybrid Derivatives | Open-pollinated varieties produce seeds true to type as they cross-pollinate only with other plants of the same variety. |
| Other Solanaceae | The crops considered under other Solanaceae include bell peppers and other different peppers based on the locality of the respective countries. |
| Other Brassicaceae | The crops considered under other brassicas include radishes, turnips, Brussels sprouts, and kale. |
| Other Roots & Bulbs | The crops considered under other roots & bulbs include Sweet Potatoes and cassava. |
| Other Cucurbits | The crops considered under other cucurbits include gourds (bottle gourd, bitter gourd, ridge gourd, Snake gourd, and others). |
| Other Grains & Cereals | The crops considered under other grains & cereals include Barley, Buck Wheat, Canary Seed, Triticale, Oats, Millets, and Rye. |
| Other Fibre Crops | The crops considered under other fibers include Hemp, Jute, Agave fibers, Flax, Kenaf, Ramie, Abaca, Sisal, and Kapok. |
| Other Oilseeds | The crops considered under other oilseeds include Ground nut, Hempseed, Mustard seed, Castor seeds, safflower seeds, Sesame seeds, and Linseeds. |
| Other Forage Crops | The crops considered under other forages include Napier grass, Oat grass, White clover, Ryegrass, and Timothy. Other forage crops were considered based on the locality of the respective countries. |
| Pulses | Pigeon peas, Lentils, Broad and horse beans, Vetches, Chickpeas, Cowpeas, Lupins, and Bambara beans are the crops considered under pulses. |
| Other Unclassified Vegetables | The crops considered under other unclassified vegetables include Artichokes, Cassava Leaves, Leeks, Chicory, and String beans. |


Research Methodology
Mordor Intelligence follows a four-step methodology in all our reports.
- Step-1: IDENTIFY KEY VARIABLES: In order to build a robust forecasting methodology, the variables and factors identified in Step-1 are tested against available historical market numbers. Through an iterative process, the variables required for market forecast are set and the model is built on the basis of these variables.
- Step-2: Build a Market Model: Market-size estimations for the forecast years are in nominal terms. Inflation is not a part of the pricing, and the average selling price (ASP) is kept constant throughout the forecast period.
- Step-3: Validate and Finalize: In this important step, all market numbers, variables and analyst calls are validated through an extensive network of primary research experts from the market studied. The respondents are selected across levels and functions to generate a holistic picture of the market studied.
- Step-4: Research Outputs: Syndicated Reports, Custom Consulting Assignments, Databases, and Subscription Platforms


