Market Overview
| Study Period | 2021 - 2031 |
|---|---|
| Forecast Data Period | 2026 - 2031 |
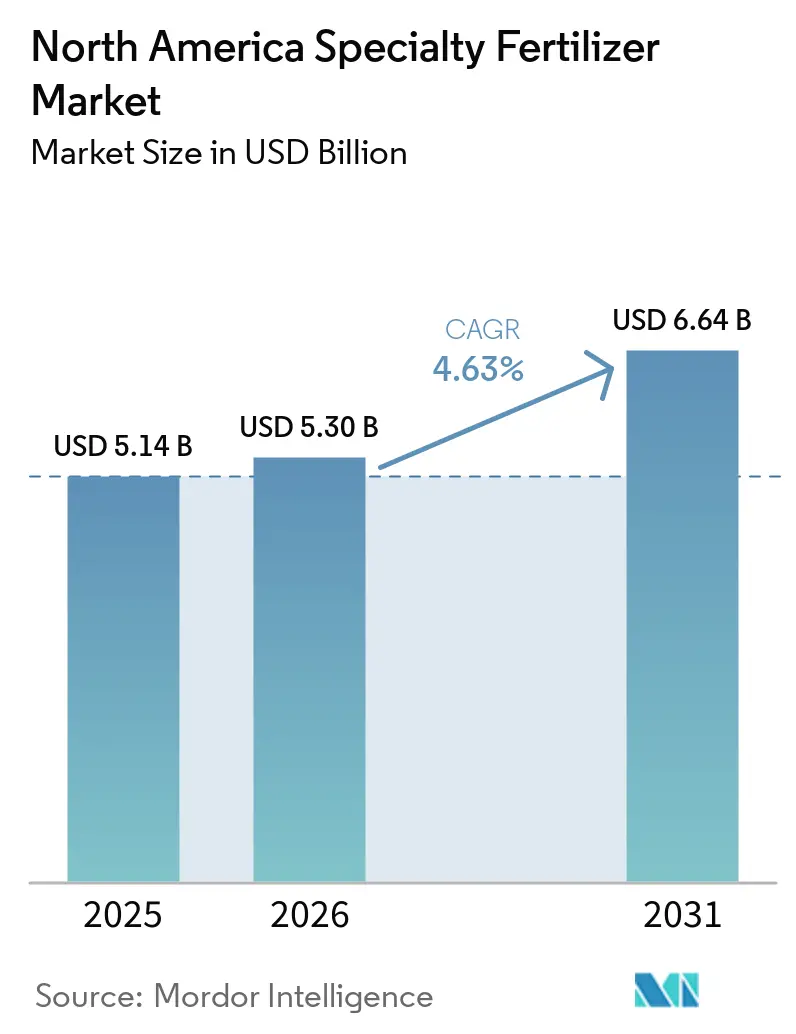
| Base Year Market Size (2025) | USD 5.14 Billion |
| Market Size (2026) | USD 5.30 Billion |
| Market Size (2031) | USD 6.64 Billion |
| Growth Rate (2026 - 2031) | 4.63% CAGR |
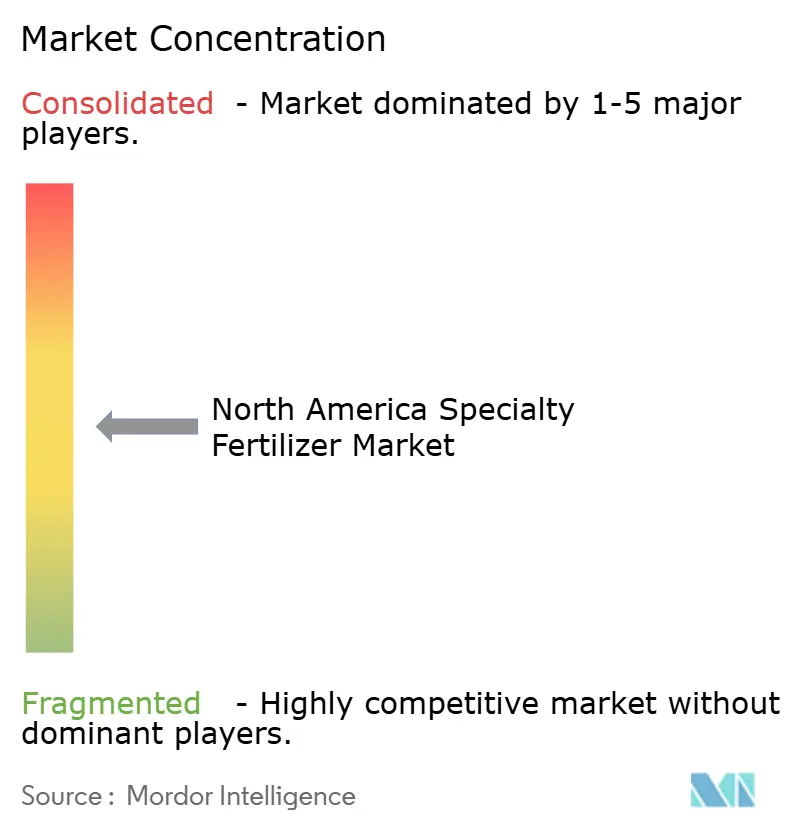
| Market Concentration | Medium |
Major Players *Disclaimer: Major Players sorted in no particular order Image © Mordor Intelligence. Reuse requires attribution under CC BY 4.0. | |
North America Specialty Fertilizer Market Analysis by Mordor Intelligence
The North America specialty fertilizer market size is projected to expand from USD 5.14 billion in 2025 and USD 5.30 billion in 2026 to USD 6.64 billion by 2031, registering a CAGR of 4.6% during the forecast period. The North America specialty fertilizer market is being shaped more by grower economics than by simple acreage growth, as buyers shift from volume-led nutrient programs to formulations that better match crop uptake. That change is lifting demand for products that reduce nutrient loss, support timing precision, and improve return on fertilizer spend across large commercial farms. The move toward fertigation systems and controlled environment production is also expanding the role of soluble and managed-release inputs, as these systems cannot rely on conventional blends in the same way. Carbon-linked farm programs are strengthening the case for enhanced-efficiency products in field crops, giving the North American specialty fertilizer market a wider addressable base beyond its traditional premium crop channels. Competition remains moderately consolidated, but firms with local formulation assets, proprietary product design, and stronger distribution coverage still have a clear advantage as growers place more value on product availability and service consistency.
Key Report Takeaways
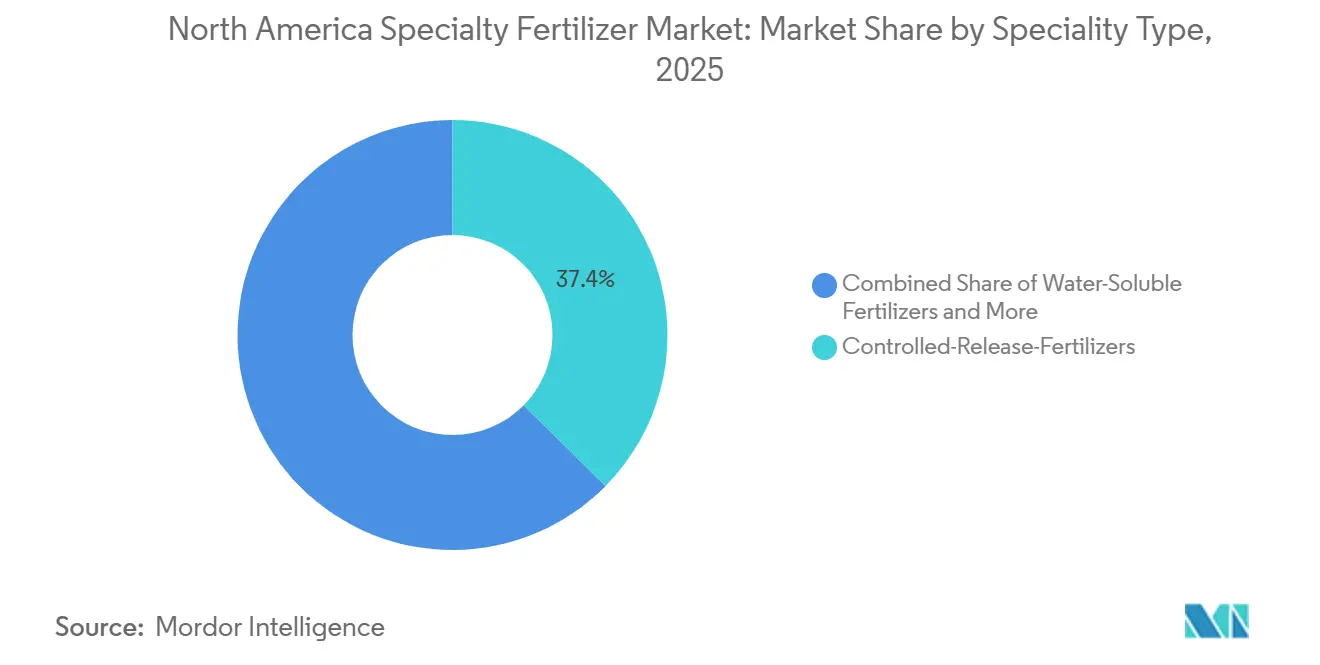
- By specialty type, controlled-release fertilizer held the largest North America specialty fertilizer market share at 37.4% in 2025, while water-soluble fertilizer is the fastest-growing at a 6.7% CAGR through 2031.
- By application mode, fertigation accounted for the largest North America specialty fertilizer market size at 43.8% in 2025 and is also the fastest-growing segment at a 6.5% CAGR through 2031.
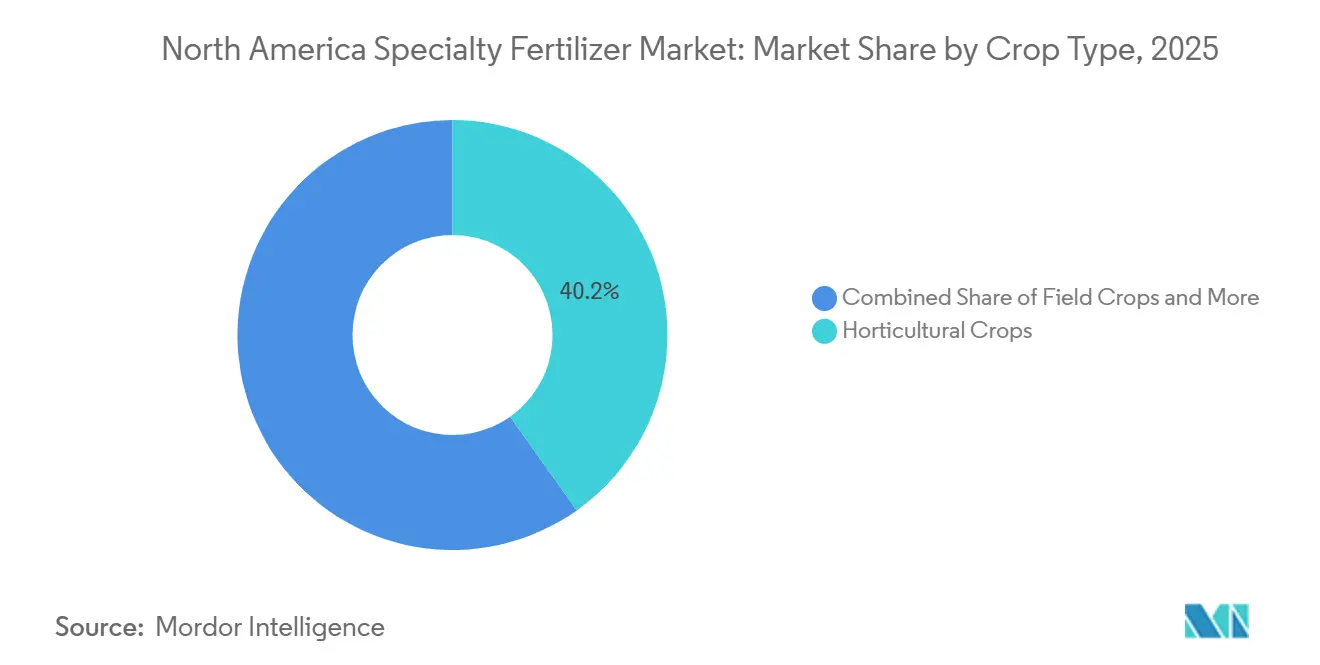
- By crop type, horticultural crops represented the largest segment at 40.2% in 2025, while turf and ornamental is projected to be the fastest-growing at a 6.2% CAGR through 2031.
- By geography, the United States held the largest North America specialty fertilizer market share at 72.9% in 2025, while Mexico is forecast to be the fastest-growing market at a 6.6% CAGR through 2031.
Note: Market size and forecast figures in this report are generated using Mordor Intelligence’s proprietary estimation framework, updated with the latest available data and insights as of January 2026.
North America Specialty Fertilizer Market Trends and Insights
Drivers Impact Analysis*
| Driver | (~) % Impact on CAGR Forecast | Geographic Relevance | Impact Timeline |
|---|---|---|---|
| Precision agriculture adoption accelerating demand for water-soluble inputs | +1.0% | United States Corn Belt, California specialty crops, and Canada Prairies | Short term (≤ 2 years) |
| Regulatory focus on nutrient-use efficiency and 4R stewardship | +0.8% | United States national, Canada, and Great Lakes basin | Medium term (2-4 years) |
| Expansion of greenhouse and controlled environment farming across North America | +0.7% | Ontario, California, Texas, Illinois, and Pennsylvania | Short term (≤ 2 years) |
| Integration of biostimulants requiring compatible specialty nutrition | +0.5% | United States specialty crop states, and Mexico horticulture belts | Short term (≤ 2 years) |
| Carbon credit programs rewarding slow-release fertilizer use | +0.4% | United States Midwest, and Canada Prairies | Medium term (2-4 years) |
| Acreage shift toward high-value berries, nuts, and hemp | +0.6% | California, Oregon, Pacific Northwest, Southeast, and Midwest | Short term (≤ 2 years) |
| Source: Mordor Intelligence | |||


Precision Agriculture Adoption Accelerating Demand for Water-Soluble Inputs
The North America specialty fertilizer market is moving toward water-soluble and liquid products because variable-rate application and sensor-led irrigation depend on precise nutrient delivery. USDA reported in December 2024 that 68% of large crop farms used precision decision tools such as yield monitors, soil maps, and automated guidance systems. The same USDA survey showed that variable-rate technology reached 45% on large crop farms and autosteering reached 70% on large farms, versus 9% on small farms[1]Source: United States Department of Agriculture Economic Research Service, “Precision Agriculture Use Increases with Farm Size and Varies Widely by Technology,” ers.usda.gov. That adoption pattern matters because the strongest economic case for specialty inputs lies with large farms that can monetize better placement and timing across wide-acre bases. As fertigation expands from California specialty crops into Ontario greenhouse vegetables and the U.S. Southeast, fully soluble formulations become a system requirement rather than an optional upgrade.
Regulatory Focus on Nutrient-Use Efficiency and 4R Stewardship
The North America specialty fertilizer market is also benefiting from a tighter focus on nutrient-use efficiency and 4R stewardship. The Fertilizer Institute said in its 2025 sustainability report that the 4R program is on track to exceed 70 million certified acres by 2030[2]Source: The Fertilizer Institute, “Sustainability Report 2025,” tfi.org. Controlled-release blends, polymer-coated urea, and inhibitor-treated products align with this direction because they help document lower nitrogen loss and improved nutrient placement. Rules linked to the Chesapeake Bay, the Great Lakes, and state nitrate reduction programs are increasing pressure on growers to use products that improve timing and use efficiency. This policy setting supports premium nutrition products across row crops and higher-value cropping systems, broadening the commercial base of the North American specialty fertilizer market.
Integration of Biostimulants Requiring Compatible Specialty Nutrition
The North America specialty fertilizer market is also being lifted by crop programs that combine specialty nutrition with biostimulant inputs. Liquid biostimulants fit fertigation systems well, and they work best with fully soluble fertilizers that do not precipitate, gel, or interfere with uptake in the root zone. That pushes formulators toward pH-stable micronutrient chelates and lower-salt carriers instead of conventional granular blends. The effect is strongest in specialty crops, but the same compatibility requirement is now extending into row-crop programs that use liquid delivery systems. As more crop programs are built around tank compatibility, purity and solubility become baseline product requirements instead of narrow premium features in the North America specialty fertilizer market.
Carbon Credit Programs Rewarding Slow-Release Fertilizer Use
The North America specialty fertilizer market is starting to benefit from carbon-linked farm programs that reward lower nutrient loss. Verra activated its VM0042 Improved Agricultural Land Management methodology in October 2025, and the framework includes optimized use of slow-release fertilizers among eligible practices. That creates a direct financial reason for growers in carbon programs to evaluate enhanced-efficiency nitrogen products. The appeal is strongest in field crops, where premium fertilizer adoption has historically been harder to justify on agronomic grounds alone. When carbon revenue is added to crop performance and nutrient efficiency, slow-release and inhibitor-treated products gain a stronger path into acreage that once relied mainly on commodity nutrition.
Restraints Impact Analysis*
| Restraint | (~) % Impact on CAGR Forecast | Geographic Relevance | Impact Timeline |
|---|---|---|---|
| Price premium versus conventional fertilizers | -0.9% | United States smallholders, Midwest row crops, and Mexico smallholders | Short term (≤ 2 years) |
| Volatile supply of specialty raw materials | -0.5% | North America with exposure to global sourcing shifts | Medium term (2-4 years) |
| Nano-fertilizer adoption cannibalizing polymer-coated demand | -0.4% | North America innovation corridors | Medium term (2-4 years) |
| Forthcoming microplastic regulations on polymer coatings | -0.5% | European export exposure, Canada, and North America | Long term (≥ 4 years) |
| Source: Mordor Intelligence | |||
Price Premium Versus Conventional Fertilizers
The North American specialty fertilizer market still faces a clear adoption barrier due to the price gap with conventional fertilizers. Specialty products in the input text carry a 2-4 times premium over standard nitrogen and phosphate blends. That difference is hardest to absorb in smallholder and row-crop systems where margins are tighter and yield response must be visible. The challenge is lower in greenhouse and permanent crop systems because growers can connect nutrition precision more directly to crop quality, reduced waste, and labor efficiency. Producers that want broader adoption still need to prove field-level economics, or buyers can shift back toward standard blends when crop prices weaken.
Volatile Supply of Specialty Raw Materials
The North America specialty fertilizer market also remains exposed to volatile supply for coatings, soluble nutrients, and other specialty raw materials. The competitive discussion in the input shows that firms are buying or expanding regional formulation assets because local manufacturing improves resilience and supports pricing power. That matters because imported products can leave growers and distributors exposed to freight disruption, sourcing shifts, and delivery delays. Mexico’s import dependence adds another layer of pressure, as specialty programs often require more consistent product availability than conventional blends. Supply reliability shapes both competitive position and adoption speed across the North America specialty fertilizer market.
*Our forecasts treat driver/restraint impacts as directional, not additive. The impact forecasts reflect baseline growth, mix effects, and variable interactions.
Segment Analysis
By Specialty Type: Controlled Release Leads While Soluble Grades Grow Faster
Controlled-release fertilizer held 37.4% of the North America specialty fertilizer market size in 2025, giving it the largest position within the specialty type segmentation. Its lead came from turf, golf, nursery, and expanding row-crop use, where nutrient timing can be monetized through 4R programs. Polymer-coated and polymer-sulfur-coated products still account for most controlled-release volume because they align nutrient release with soil conditions and labor planning. This keeps controlled-release products central to the North America specialty fertilizer market even as coating technology is being reevaluated under tighter environmental scrutiny.
Water-Soluble Fertilizer is projected to grow at a 6.7% CAGR through 2031, making it the fastest-growing specialty type in the North American specialty fertilizer market. Its growth is tied to greenhouse systems, closed-loop irrigation, and open-field fertigation programs that need full solubility and stable tank mixing. Liquid fertilizer and slow-release fertilizer serve different channels, with liquid products fitting established distribution systems and slow-release grades maintaining demand in ornamental and turf programs. The balance of growth shows that premium spending is shifting toward products that fit managed delivery systems without displacing the installed base of controlled-release products.


By Application Mode: Fertigation Commands Share and Maintains the Fastest Pace
Fertigation accounted for 43.8% share of the North America specialty fertilizer market size in 2025 and is projected to expand at 6.5% CAGR through 2031. Its lead reflects a structural change in nutrient delivery rather than a short-term preference. California permanent crops, Canadian greenhouse vegetables, and Mexican protected horticulture all rely on nutrient injection systems that integrate water and fertilizer delivery. That connection gives fertigation a strong position in the North America specialty fertilizer market as irrigation investment spreads across high-value crop systems.
Foliar application held a smaller share, but it remains important in micronutrient correction programs where growers need a rapid response during active crop growth. Soil application still covers large row-crop acreage for nutrients such as phosphorus and potassium, but it is losing relative weight as drip irrigation and precision injection expand. The Fertilizer Institute’s target for 70 million 4R-certified acres by 2030 supports this direction because fertigation is one of the clearest ways to document timing and placement at the field level. As a result, high-purity carriers and ultra-soluble blends are moving from specialty add-ons to regular components in commercial crop programs.
By Crop Type: Horticulture Anchors Value While Turf and Ornamental Grows Faster
Horticultural crops captured 40.2% of North America specialty fertilizer market share in 2025, making them the largest value pool by crop type. This position reflects the heavy concentration of premium demand in tree nuts, berries, avocados, and greenhouse vegetables, where input precision affects quality and export compliance. U.S. tree nut value reached USD 13.1 billion in 2025, and bearing acreage rose to 2.9 million acres[3]Source: United States Department of Agriculture National Agricultural Statistics Service, “U.S. Tree Nut Value 2025 Report,” nationalnutgrower.com, which shows the scale of the high-value crop base supporting premium nutrition. That crop profile anchors a large part of the North America specialty fertilizer market in systems where return on precision nutrition is easier to measure.
Turf and ornamental is projected to grow at 6.2% CAGR through 2031, making it the fastest-growing crop type segment in the North America specialty fertilizer market. Water-use restrictions in many Western municipalities favor products that deliver better release control and labor savings for professional turf managers. Field crops still represent the largest land area, but they contribute a smaller share of value because adoption leans toward enhanced-efficiency products instead of the most premium formulations. United States hemp production value rose to USD 739 million in 2025, which signals another smaller but intensive outlet for soluble and micronutrient products.
Geography Analysis
The United States held 72.9% of North America specialty fertilizer market share in 2025, making it the largest country in the region. Its scale rests on large commercial farms, mature retail agronomy networks, and broad use of precision tools. California draws strong demand for water-soluble and chelated products because permanent crops and drip irrigation favor high-purity nutrition. The Midwest supports enhanced-efficiency nitrogen programs in corn and soybean rotations, while the Southeast is adding fertigation capacity in berry acreage. These different demand pools give the North America specialty fertilizer market a wide product mix within one national market.
Mexico is projected to grow at 6.6% CAGR through 2031, making it the fastest-growing national segment in the North America specialty fertilizer market. Growth is tied to export horticulture in Sinaloa, Baja California, and Michoacan, where protected cultivation and fertigation lift demand for soluble grades. Import dependence remains high in Mexico, creating both sourcing risk and opportunities for local specialty formulation gains. Sustainability requirements in export food chains are also increasing the appeal of lower-carbon, more efficient nutrition programs. Yara International ASA and PepsiCo extended their lower-carbon fertilizer collaboration to Mexican potato growers by mid-2025, demonstrating how buyer standards can increase specialty penetration in commercial agriculture.
Canada accounted for a meaningful share of the North America specialty fertilizer market in 2025 because greenhouse production in Ontario and field crop systems in the Prairies both support premium nutrient programs. Canadian greenhouse product sales reached USD 3.7 billion in 2024, and total greenhouse area grew 4.0% to 33.3 million square meters. A Canadian fertilizer use review also showed that 27% of nitrogen applied to surveyed potato and grain corn acres used enhanced-efficiency fertilizers, which points to established adoption in high-value systems. Rest of North America represented less than 2% of regional volume, but chloride-free and quality-focused formulations are gaining use in export-oriented banana and coffee programs.
Competitive Landscape
The North American specialty fertilizer market is moderately concentrated, with key players including Nutrien Ltd., The Mosaic Company, Yara International ASA, CF Industries Holdings, Inc., and ICL Group Ltd. dominating the competitive landscape. These companies leverage extensive distribution networks, diverse specialty fertilizer portfolios, and robust agronomic support capabilities. Nutrien Ltd. continues to enhance its market position through investments in proprietary products, digital agriculture tools, and retail network optimization, emphasizing the importance of customer access and farm-level service alongside manufacturing scale. Other notable participants, including Koch Agronomic Services, LLC, The Andersons, Inc., Helena Agri-Enterprises, LLC, Wilbur-Ellis Holdings, Inc., and J. R. Simplot Company, maintain significant roles in specialty nutrition and crop management segments.
The market is increasingly influenced by companies integrating specialty fertilizers with sustainability and low-carbon agricultural initiatives. CF Industries Holdings, Inc. has expanded its focus on low-carbon fertilizer solutions, while Yara International ASA continues to strengthen partnerships that align crop nutrition with food chain sustainability goals. Companies such as ICL Group Ltd., SQM S.A., Haifa Chemicals Ltd., and Tessenderlo Group NV are prioritizing advanced specialty products aimed at improving nutrient efficiency and environmental performance. These advancements are intensifying competition as growers, food processors, and retailers place greater emphasis on sustainability alongside agronomic effectiveness.
The North America specialty fertilizer market presents opportunities for companies addressing emerging grower needs through innovation and technical support. Growth areas include biodegradable coating technologies, enhanced efficiency fertilizers, and water-soluble formulations compatible with biostimulants. Companies such as Verdesian Life Sciences, LLC, K+S Aktiengesellschaft, and other specialty-focused suppliers are well-positioned to capitalize on these trends. As precision agriculture adoption grows, competition is projected to increasingly focus on nutrient efficiency, sustainability, product differentiation, and integrated agronomic solutions rather than solely on fertilizer supply.
North America Specialty Fertilizer Industry Leaders
Nutrien Ltd.
The Mosaic Company
Yara International ASA
CF Industries Holdings, Inc.
ICL Group Ltd.
- *Disclaimer: Major Players sorted in no particular order

Recent Industry Developments
- July 2024: ICL Group Ltd. acquired Custom Ag Formulators for approximately USD 60 million, expanding its portfolio of customized agricultural formulations, liquid adjuvants, and specialty nutrients. The acquisition strengthens ICL Group Ltd.'s presence across key U.S. growing regions and supports the increasing demand for tailored crop nutrition solutions in the North America specialty fertilizer market.
- January 2024: ICL Group Ltd. expanded its Nova portfolio with new liquid water-soluble fertilizer formulations, including Nova PeKacid LQ 0-27-9, strengthening fertigation and foliar nutrition solutions and supporting the growing demand for precision nutrient management in the North America specialty fertilizer market.
- January 2023: ICL Group Ltd. has entered into a strategic partnership agreement with General Mills, in which it will be the supplier of strategic specialty phosphate solutions to General Mills. The long-term agreement will also focus on international expansion.


North America Specialty Fertilizer Market Report Scope
Specialty fertilizers are synthetic products formulated to improve nutrient-use efficiency through controlled-release, water-soluble, stabilized, or micronutrient-enriched technologies, enabling targeted nutrient delivery to meet specific crop and soil requirements.
The North America Specialty Fertilizer Market Report is Segmented by Specialty Type (CRF, Liquid Fertilizer, SRF, and Water Soluble), by Application Mode (Fertigation, Foliar, and Soil), by Crop Type (Field Crops, Horticultural Crops, and Turf and Ornamental), and by Geography (Canada, Mexico, the United States, and the Rest of North America). The Market Forecasts are Provided in Terms of Value (USD) and Volume (Metric Tons).
Specialty Type
| CRF | Polymer Coated |
| Polymer-Sulfur Coated | |
| Others | |
| Liquid Fertilizer | |
| SRF | |
| Water Soluble |
Application Mode
| Fertigation |
| Foliar |
| Soil |
Crop Type
| Field Crops |
| Horticultural Crops |
| Turf and Ornamental |
Country
| Canada |
| Mexico |
| United States |
| Rest of North America |
| Specialty Type | CRF | Polymer Coated |
| Polymer-Sulfur Coated | ||
| Others | ||
| Liquid Fertilizer | ||
| SRF | ||
| Water Soluble | ||
| Application Mode | Fertigation | |
| Foliar | ||
| Soil | ||
| Crop Type | Field Crops | |
| Horticultural Crops | ||
| Turf and Ornamental | ||
| Country | Canada | |
| Mexico | ||
| United States | ||
| Rest of North America |


Market Definition
- MARKET ESTIMATION LEVEL - Market Estimations for various types of fertilizers has been done at the product-level and not at the nutrient-level.
- NUTRIENT TYPES COVERED - Primary Nutrients: N, P and K, Secondary Macronutrients: Ca, Mg and S, Micronutients: Zn, Mn, Cu, Fe, Mo, B, and Others
- AVERAGE NUTRIENT APPLICATION RATE - This refers to the average volume of nutrient consumed per hectare of farmland in each country.
- CROP TYPES COVERED - Field Crops: Cereals, Pulses, Oilseeds, and Fiber Crops Horticulture: Fruits, Vegetables, Plantation Crops and Spices, Turf Grass and Ornamentals
| Keyword | Definition |
|---|---|
| Fertilizer | Chemical substance applied to crops to ensure nutritional requirements, available in various forms such as granules, powders, liquid, water soluble, etc. |
| Specialty Fertilizer | Used for enhanced efficiency and nutrient availability applied through soil, foliar, and fertigation. Includes CRF, SRF, liquid fertilizer, and water soluble fertilizers. |
| Controlled-Release Fertilizers (CRF) | Coated with materials such as polymer, polymer-sulfur, and other materials such as resins to ensure nutrient availability to the crop for its entire life cycle. |
| Slow-Release Fertilizers (SRF) | Coated with materials such as sulfur, neem, etc., to ensure nutrient availability to the crop for a longer period. |
| Foliar Fertilizers | Consist of both liquid and water soluble fertilizers applied through foliar application. |
| Water-Soluble Fertilizers | Available in various forms including liquid, powder, etc., used in foliar and fertigation mode of fertilizer application. |
| Fertigation | Fertilizers applied through different irrigation systems such as drip irrigation, micro irrigation, sprinkler irrigation, etc. |
| Anhydrous Ammonia | Used as fertilizer, directly injected into the soil, available in gaseous liquid form. |
| Single Super Phosphate (SSP) | Phosphorus fertilizer containing only phosphorus which has lesser than or equal to 35%. |
| Triple Super Phosphate (TSP) | Phosphorus fertilizer containing only phosphorus greater than 35%. |
| Enhanced Efficiency Fertilizers | Fertilizers coated or treated with additional layers of various ingredients to make it more efficient compared to other fertilizers. |
| Conventional Fertilizer | Fertilizers applied to crops through traditional methods including broadcasting, row placement, ploughing soil placement, etc. |
| Chelated Micronutrients | Micronutrient fertilizers coated with chelating agents such as EDTA, EDDHA, DTPA, HEDTA, etc. |
| Liquid Fertilizers | Available in liquid form, majorly used for application of fertilizers to crops through foliar and fertigation. |


Research Methodology
Mordor Intelligence follows a four-step methodology in all our reports.
- Step-1: IDENTIFY KEY VARIABLES: In order to build a robust forecasting methodology, the variables and factors identified in Step-1 are tested against available historical market numbers. Through an iterative process, the variables required for market forecast are set and the model is built on the basis of these variables.
- Step-2: Build a Market Model: Market-size estimations for the forecast years are in nominal terms. Inflation is not a part of the pricing, and the average selling price (ASP) is kept constant throughout the forecast period for each country.
- Step-3: Validate and Finalize: In this important step, all market numbers, variables and analyst calls are validated through an extensive network of primary research experts from the market studied. The respondents are selected across levels and functions to generate a holistic picture of the market studied.
- Step-4: Research Outputs: Syndicated Reports, Custom Consulting Assignments, Databases & Subscription Platforms


