
Market Overview
| Study Period | 2020 - 2031 |
|---|---|
| Forecast Data Period | 2026 - 2031 |
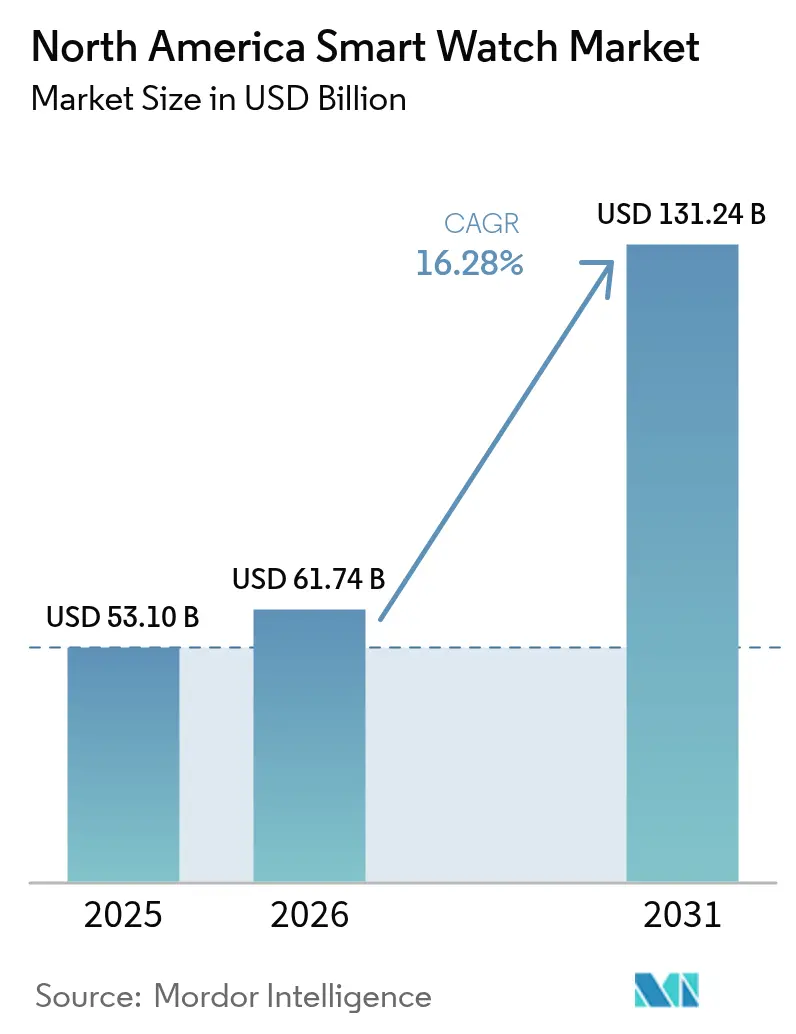
| Base Year Market Size (2025) | USD 53.10 Billion |
| Market Size (2026) | USD 61.74 Billion |
| Market Size (2031) | USD 131.24 Billion |
| Growth Rate (2026 - 2031) | 16.28 % |
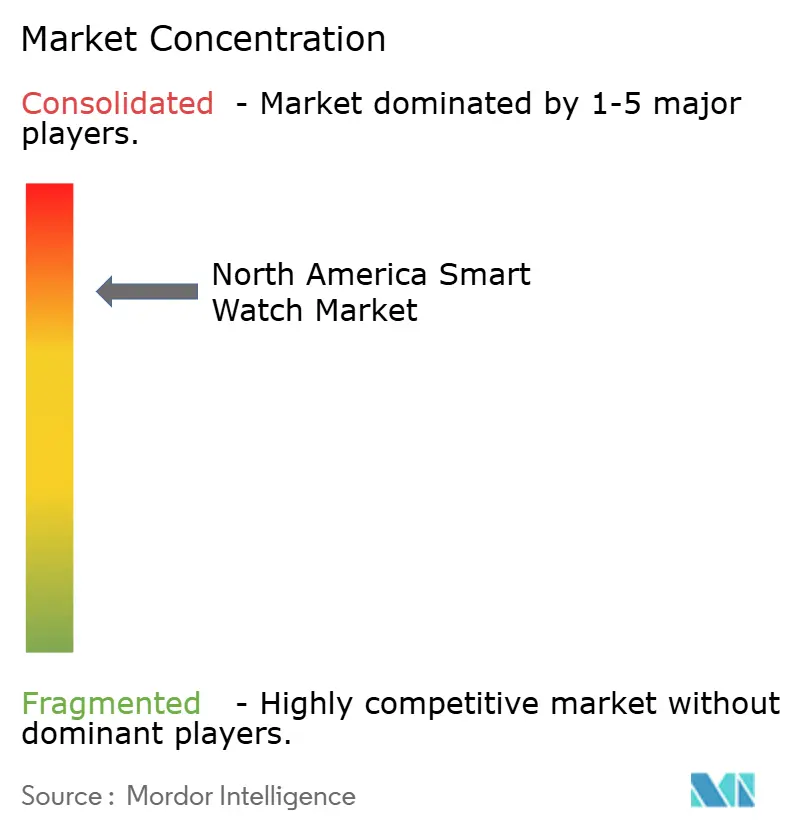
| Market Concentration | High |
Major Players *Disclaimer: Major Players sorted in no particular order Image © Mordor Intelligence. Reuse requires attribution under CC BY 4.0. | |
North America Smart Watch Market Analysis by Mordor Intelligence
North America smart watch market size in 2026 is estimated at USD 61.74 billion, growing from 2025 value of USD 53.10 billion with 2031 projections showing USD 131.24 billion, growing at 16.28% CAGR over 2026-2031. Momentum stems from rapid biosensing accuracy gains, a growing roster of FDA-cleared health functions, and rising enterprise demand that extends well beyond traditional consumer use cases. The continuous addition of on-device artificial intelligence improves battery efficiency, while cross-OEM eSIM roaming partnerships give users seamless cellular coverage. Concentrated competition among platform owners supports premium pricing, yet sub-USD 199 devices are scaling quickly as component costs fall. Supply-chain pressure on rare-earth magnets, privacy-related litigation, and private-equity roll-ups influencing average selling prices introduce new risk variables for stakeholders across the North America smart watch market.
Key Report Takeaways
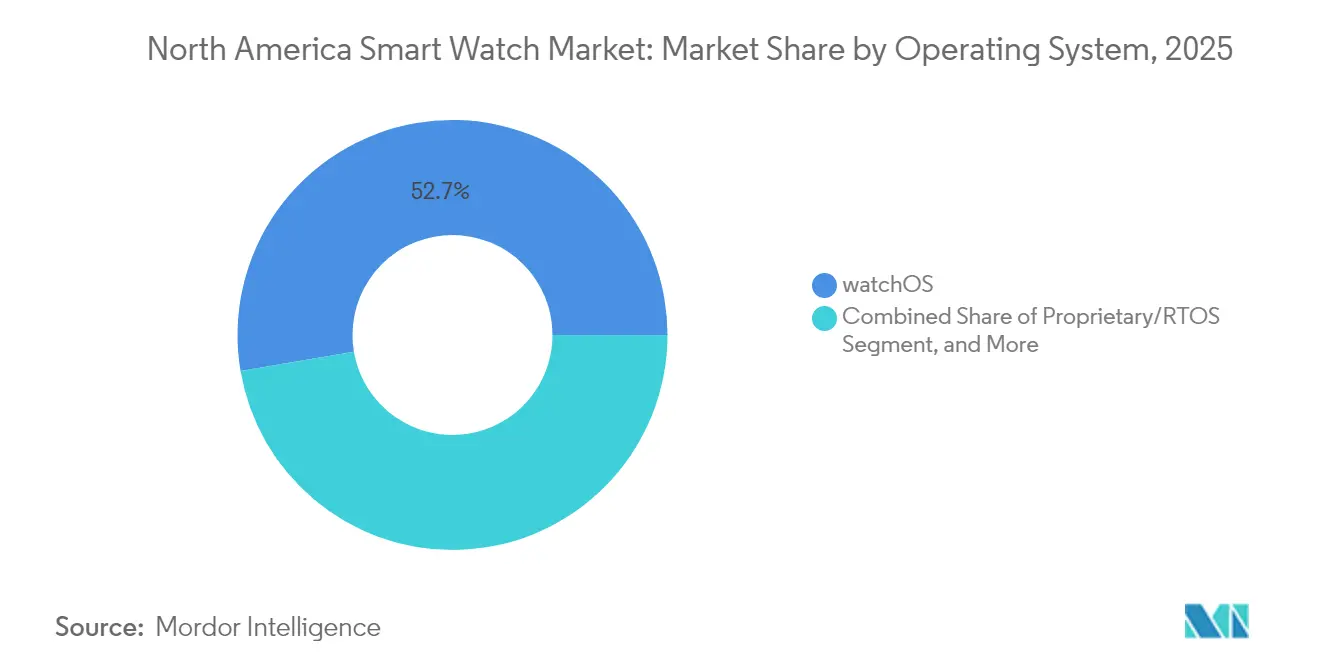
- By operating system, watchOS led with 52.68% of the North America smartwatch market share in 2025; Wear OS is forecast to log the fastest growth, advancing at a 17.25% CAGR through 2031.
- By display type, AMOLED accounted for 47.15% of the North America smart watch market size in 2025, while the same technology is set to post a 17.05% CAGR thanks to superior power efficiency.
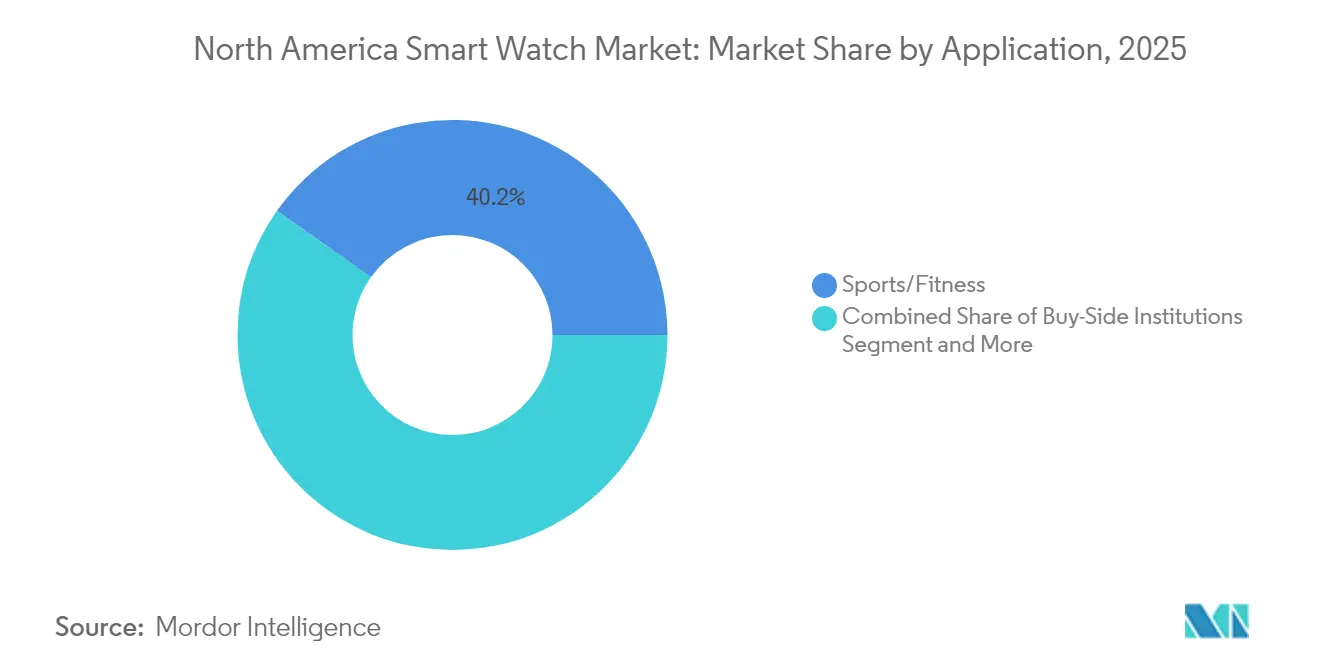
- By application, sports and fitness captured 40.20% of usage of the North America smart watch market in 2025, whereas medical and health monitoring is progressing at an 17.45% CAGR on the back of widening reimbursement.
- By connectivity, Bluetooth + cellular held 51.05% share of the North America smart watch market size in 2025 and remains the preferred option for smartphone-independent use.
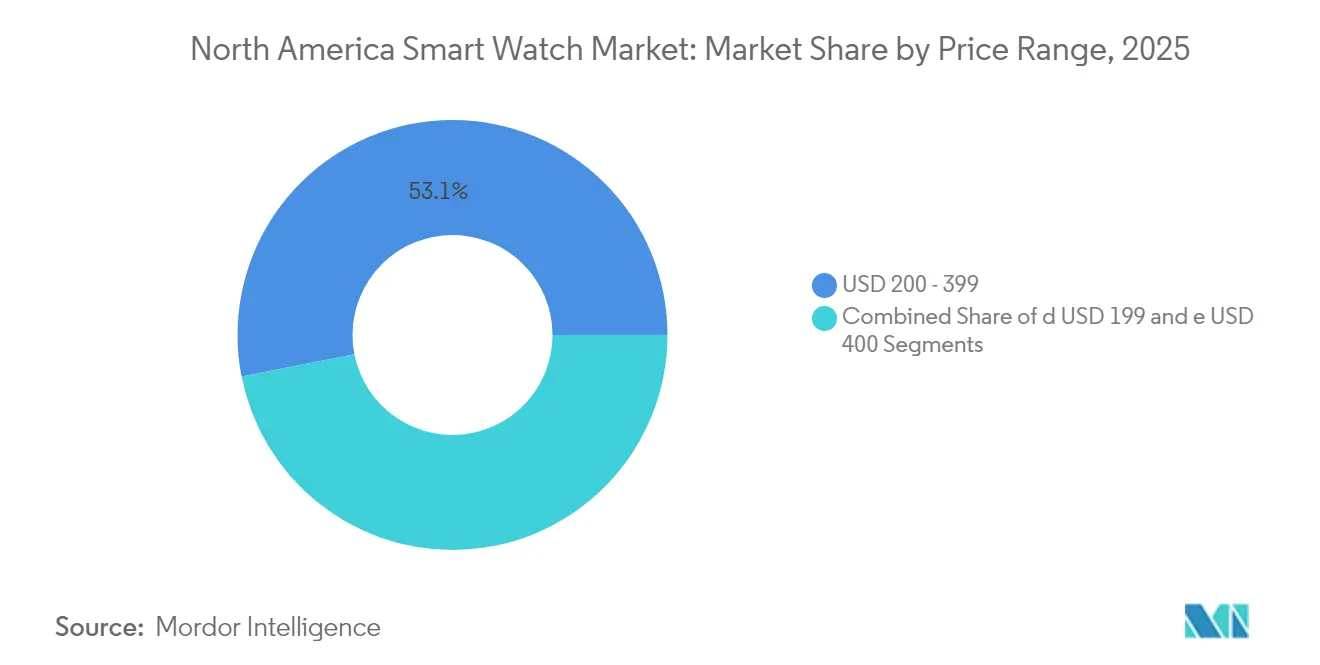
- By price range, devices priced USD 200-399 commanded 53.10% revenue of the North America smart watch market in 2025, yet the ≤USD 199 tier is expanding at a 17.15% CAGR as democratization accelerates.
- By distribution channel, online-native sellers controlled 59.80% of the 2025 revenue of the North America smart watch market; omni-channel retail is growing at a 16.55% CAGR as brick-and-mortar chains merge digital experiences with physical support.
- By end-user demographic, 15-34-year-olds comprised 49.30% of users of the North America smart watch market in 2025, but the 35-54 group is scaling fastest at 16.95% CAGR under workplace wellness programs.
- By country, the United States contributed 82.10% of shipments of the North America smart watch market in 2025, while Canada showed the highest 17.35% CAGR through 2031.
Note: Market size and forecast figures in this report are generated using Mordor Intelligence’s proprietary estimation framework, updated with the latest available data and insights as of 2026.
North America Smart Watch Market Trends and Insights
Drivers Impact Analysis*
| Driver | (~) % Impact on CAGR Forecast | Geographic Relevance | Impact Timeline |
|---|---|---|---|
| Rapid biosensing accuracy gains | +3.2% | North America metropolitan hubs | Medium term (2-4 years) |
| FDA-cleared smartwatch health functions | +2.8% | United States, emerging alignment in Canada | Medium term (2-4 years) |
| Wider insurance reimbursement | +2.1% | U.S. healthcare systems, gradual Canada uptake | Long term (≥ 4 years) |
| On-device AI for battery-efficient UX | +2.9% | Global, premium focus in North America | Short term (≤ 2 years) |
| Cross-OEM eSIM roaming | +1.8% | North America carrier networks | Medium term (2-4 years) |
| Corporate wellness incentives | +2.4% | U.S. enterprises, expansion into Canada | Medium term (2-4 years) |
| Source: Mordor Intelligence | |||
Rapid Biosensing Accuracy Gains
Sensor-fusion algorithms now combine photoplethysmography, electrocardiography, and bio-impedance readings to cut atrial-fibrillation false positives below 5%. Samsung’s ECG App v1.3 received FDA clearance in 2024, validating clinical-grade performance and opening reimbursement paths via Medicare’s Remote Patient Monitoring codes.[1]Samsung Electronics, “Galaxy Watch Ultra: 3 nm Processor and 48-Hour Battery Life,” samsung.com Accuracy improvements position watches to complement or even substitute specialized medical devices in ambulatory settings. Device makers embed redundant sensor arrays that sustain measurement precision if one sensor fails, boosting reliability for chronic-care patients. As these capabilities proliferate across price tiers, the North America smart watch market gains a broader medical user base, moving adoption beyond fitness-oriented early adopters. Clinical validation also attracts enterprise wellness buyers seeking verified outcomes data rather than general wellness indicators.
Expansion of FDA-Cleared Smartwatch Health Functions
The U.S. FDA Digital Health Center of Excellence has shortened clearance timelines from 18 months to 8 months for established quality-system holders. Abbott’s non-invasive Lingo CGM won clearance in 2024, demonstrating momentum for additional glucose and sleep-apnea applications.[2]Abbott Laboratories, “Abbott Receives FDA Clearance for Lingo Continuous Glucose Monitoring System,” abbott.com Shorter pathways create defensible moats for brands with Compliance teams, elevating barriers to entry. Developers respond by expanding regulatory focus groups and investing in human-factors engineering to meet the agency’s post-market surveillance expectations. Cross-border harmonization discussions with Health Canada foreground similar frameworks, promising a wider regional payoff. Each new health clearance enriches platform stickiness, prompting app developers and insurers to lean toward ecosystems with the broadest set of regulated functions.
Wider Insurance Reimbursement for Remote Monitoring
Medicare bumped Remote Patient Monitoring reimbursement to USD 58.92 per month in 2025. UnitedHealthcare followed with subsidies up to USD 150 annually for activity-compliant members. Employer programs report 2:1 returns on investment owing to lower absenteeism and chronic-disease spending. These economics underpin corporate orders that often bundle devices with analytics dashboards to track participation. Watch makers now design enterprise-admin portals and secure APIs that push de-identified data into human-resource systems. As reimbursement spreads to private payers and Canadian provincial plans, the North America smart watch market sees a structural revenue floor that is less dependent on discretionary consumer upgrades.
On-Device AI Accelerating Battery-Efficient UX
Samsung’s 3 nm processor supports local inference while stretching battery life to 48 hours in power-save mode. Google’s Gemini integration on Wear OS personalizes health insights without cloud latency, easing privacy concerns for regulated use cases. AI co-processors dynamically lower screen refresh rates and deactivate unused radios, preserving charge cycles. Vendors leverage federated learning so anonymized user datasets improve sleep and stress algorithms continuously, while data never leaves devices. Energy-efficient AI also reduces thermal output, enabling thinner casings that support larger sensor windows. These improvements redefine baseline expectations for comfort and reliability and position premium devices for medical certifications that impose tight uptime requirements.
Restraints Impact Analysis*
| Restraint | (~) % Impact on CAGR Forecast | Geographic Relevance | Impact Timeline |
|---|---|---|---|
| Private-equity roll-ups raising ASP volatility | -1.9% | North America M&A in mid-tier brands | Short term (≤ 2 years) |
| Persistent data-privacy litigation | -1.4% | U.S. legal frame led by Washington State | Medium term (2-4 years) |
| Rare-earth magnets supply chain chokepoints | -1.1% | Global sourcing affecting North America assembly | Long term (≥ 4 years) |
| Plateauing first-time adopter pool post-2027 | -2.3% | Mature urban markets across North America | Long term (≥ 4 years) |
| Source: Mordor Intelligence | |||
Private-Equity Roll-Ups Raising ASP Volatility
Acquisitions such as Fossil’s smartwatch IP sale to Google in 2024 sparked product-line pruning that left retailers with inventory shortfalls. Newly consolidated owners often phase out overlapping SKUs, causing temporary price drops, followed by hikes once portfolios settle. Volatility complicates procurement for employers and insurers that budget annual device refreshes. Channel partners hedge by diversifying vendors, slightly diluting loyalty to single ecosystems and eroding network effects. Brands attempting premium repositioning face resistance if prior discounting has anchored consumer expectations.
Persistent Data-Privacy Litigation Exposure
Washington State’s My Health My Data Act invites class actions for mishandled biometric information and has already driven multimillion-dollar settlements against manufacturers. Fitbit resolved the Ionic battery-safety lawsuit for USD 12.25 million in 2025,[3]Fitbit LLC, “Settlement Agreement: Ionic Device Safety Resolution,” fitbit.com illustrating the expense of protracted defense. Companies invest heavily in zero-knowledge architectures and on-device processing to limit data residency. Legal uncertainty steers smaller entrants to low-risk markets like sport-only trackers, inadvertently strengthening incumbents that can absorb compliance costs. Insurers vet vendor security certifications more rigorously, lengthening sales cycles.
*Our forecasts treat driver/restraint impacts as directional, not additive. The impact forecasts reflect baseline growth, mix effects, and variable interactions.
Segment Analysis
By Operating System: Wear OS Gains Momentum Against watchOS
The operating system split defines ecosystem loyalty and app availability. In 2025, watchOS held a 52.68% North America smart watch market share courtesy of Apple’s tight hardware-software integration and its catalog of FDA-cleared health applications. The switch by Samsung from Tizen to Wear OS realigned development resources, giving Google’s platform a 17.25% CAGR through 2031. Within the North America smart watch market size, Wear OS is positioned to capture medical device clearances faster because of Google’s dedicated Regulatory Affairs group that now incorporates Fitbit IP assets.
Consumer choice now hinges on data-portability promises; employers prefer platform-agnostic fleets where iOS and Android phones coexist. Developers leverage Google’s Gemini APIs to build cross-OEM health dashboards, boosting Wear OS’s appeal. Apple counters by expanding HealthKit analytics and optimizing battery life via the S10 chip. Proprietary real-time operating systems survive in industrial applications that demand certified deterministic performance but lack consumer scale. The OS race will increasingly mirror smartphone market dynamics, making cross-platform services crucial for end-user flexibility.



By Display Type: AMOLED Extends Premium Edge
AMOLED panels owned 47.15% revenue share in 2025 within the North America smart watch market size and are growing at 17.05% CAGR as brightness and power management improve. Always-on displays with LTPO backplanes allow refresh-rate throttling to 1 Hz, preserving battery without sacrificing glanceability. Micro-LED prototypes demonstrate superior luminance for outdoor workers, yet production costs remain steep.
TFT-LCD retains relevance in budget tiers, especially the ≤USD 199 segment scaling at 17.15% CAGR. OEMs shift older AMOLED tooling to mid-tier lines, further compressing price gaps. Display advances correlate directly with medical readability requirements; higher contrast and color fidelity enhance waveform visibility for ECG or SpO₂ readings, making premium displays integral to health-centric models.
By Application: Health Monitoring Surpasses Fitness
Sports and fitness still dominated usage in 2025 at 40.20%, but medical and health monitoring is the fastest-rising application at 17.45% CAGR. Insurers reimburse atrial-fibrillation detection and blood-pressure trends, driving device selection in older demographics. Younger users continue to value VO₂-max and training-load analytics, yet even they migrate toward recovery metrics like heart-rate variability.
Enterprise wellness programs integrate stress-scoring algorithms and sleep-quality indexing to forecast absenteeism risks. Industrial users adopt watches for lone-worker safety using fall detection and SOS messaging. The broadening application mix underlines why the North America smart watch market requires flexible sensor arrays and customizable dashboards.
By Connectivity: Cellular Leads Independence Trend
Bluetooth + cellular configurations controlled 51.05% market revenue in 2025, a figure likely to expand as eSIM activation becomes friction-free. Bluetooth + Wi-Fi options grow at 17.30% CAGR, offering a balance between autonomy and battery life. Stand-alone Bluetooth devices remain popular in the entry segment but witness a slower share relative to the overall North America smart watch market.
Carriers now position watch plans as incremental ARPU drivers amid stagnating smartphone upgrades. The coming wave of 5G RedCap (Reduced Capability) chipsets will cut power draw, fostering thinner designs and longer runtimes, further advantaging cellular SKUs.
By Price Range: Democratization Accelerates
Devices ≤USD 199 show a 17.15% CAGR, boosted by Xiaomi’s USD 149 Mi Watch 3 entry and aggressive promotions. The USD 200-399 range, representing 53.10% of 2025 revenue, balances feature density with affordability, hitting the sweet spot for employer bulk orders. Premium models ≥USD 400 face slower growth as feature creep narrows perceived advantages.
Component deflation, particularly in inertial measurement units, lets low-cost models add features like ECG and SpO₂ once reserved for flagships. Premium vendors respond with bundled service subscriptions for guided workouts and personalized coaching, shifting value from hardware to recurring software revenue.
By Distribution Channel: Digital-First Yet Omni-Channel Rising
Online-native sellers secured 59.80% of sales in 2025. Virtual try-on augmented-reality apps reduce style uncertainty that previously drove in-store visits. Brick-and-mortar chains retrofit experience centers where consumers can test ECG accuracy or preview watch faces in different lighting.
Omni-channel strategies grow at a 16.55% CAGR as retailers synchronize inventory and permit curbside pickup. Subscription financing originates online but can be closed out in physical stores during service events, blending convenience with support. The shift nudges OEMs to unify pricing across channels to avoid gray-market arbitrage.
By End-User Demographic: Mid-Age Cohort Takes Off
In 2025, the 15-34 cohort represented nearly half of users, but the 35-54 group’s 16.95% CAGR underscores corporate-wellness momentum. Middle-aged buyers prioritize hypertension alerts and stress management over step counts. Employers commonly subsidize these devices, accelerating penetration.
Senior segments grow as UI complexity falls and voice assistants mature. Larger icons, simplified onboarding via QR-code setup, and automatic fall detection resonate with caregivers. Demographic diversification is essential for post-2027 growth when urban millennials hit saturation.
Geography Analysis
The United States controlled 82.10% shipments in 2025 within the North America smart watch market, anchored by FDA-driven medical feature lead times and extensive eSIM coverage. United States momentum relies on entrenched reimbursement and corporate wellness adoption, yet plateauing first-time buyer pools prompt device makers to push toward replacement-cycle accelerators such as solid-state batteries and camera-based interaction. Regional saturation in urban coastal areas encourages marketing pivot to rural and suburban populations, where chronic-care monitoring can cut travel to clinics.
Canadian sales advance at 17.35% CAGR on the back of telehealth pilots that reimburse wearable data. Canada’s provincial health agencies are trialing smartwatch-fed chronic-disease dashboards, prompting device-level privacy certifications to align with the Personal Information Protection and Electronic Documents Act. Harmonization with FDA approvals shortens time-to-market for medical functions, creating a large upside runway.
Mexico’s adoption curve hinges on tariff policy and local carrier support for eSIM provisioning. Distribution partnerships with retail chains serving the middle class are vital to lower logistics barriers. Federally funded telemedicine expansions may accelerate demand for clinically validated models in underserved regions.
Regulatory Landscape
Smart watches in North America sit at the intersection of digital-health oversight, consumer-product safety, and radio equipment compliance. In the United States, the FDA Digital Health Center of Excellence shapes how manufacturers position health features, and the 2026 update to FDA general wellness policy guidance clarified guardrails for non-invasive wearables that avoid disease claims. This guidance affects when a product can remain outside a medical-device premarket pathway. Separately, heightened attention to wearable safety and reliability adds compliance workstreams beyond software, especially for devices marketed for continuous wear.
In Canada, market access for cellular-enabled and connected models depends on Innovation, Science and Economic Development Canada (ISED) certification and RF exposure compliance under RSS-102, with SAR measurement procedures defined in RSS-102.SAR.MEAS for portable devices operating between 100 kHz and 6 GHz. Broader product safety expectations align with Health Canada and the Canada Consumer Product Safety Act framework, and consolidated regulatory texts such as the Radiation Emitting Devices Regulations (consolidated as of March 17, 2026) reinforce baseline requirements for device design and functioning. Together, these requirements push OEMs and importers to maintain traceable testing, labeling, and technical documentation across both countries, with additional emphasis on cellular SKUs and health-sensing models.
Value Chain Analysis
The North America smart watch value chain starts with platform and silicon design, then extends through global component sourcing and largely Asia-based manufacturing, before reaching consumers and enterprises via carriers and retail channels. Platform owners (Apple, Google, and Samsung) define product direction through operating systems, app frameworks, and regulated health feature roadmaps, while specialized suppliers provide AMOLED displays, sensors (PPG/ECG), batteries, haptics, and connectivity modules (Bluetooth, Wi-Fi, and LTE/eSIM). On the cellular side, carrier certification and eSIM provisioning dependencies make modem selection and RF validation part of the upstream bill of materials and downstream launch readiness.
Manufacturing and final assembly remain concentrated outside North America, while the region contributes heavily through product development, software, and ecosystem services that monetize device data in wellness, medical monitoring, and enterprise programs. Distribution relies on online-native channels, omni-channel retail, and mobile operators bundling watch plans as incremental connectivity revenue. After-sales service, warranty handling, and firmware updates also act as midstream-to-downstream links. Key pressure points highlighted in the market context include rare-earth magnet supply constraints and compliance-driven documentation burdens, both of which can lengthen lead times and increase the value of multi-sourcing, buffer inventory, and tightly managed quality systems for health-feature devices.
Competitive Landscape
Market power rests with Apple, Samsung, and Google, which together hold about 75% revenue, indicating a high but not monopolistic concentration. Apple’s vertical integration generates differentiation through tight silicon, software, and services coupling. Samsung competes on hardware innovation, such as planned solid-state batteries.[4]Samsung Electronics, “Galaxy Watch Ultra: 3 nm Processor and 48-Hour Battery Life,” samsung.com Google leverages AI and its Fitbit IP to fast-track medical clearances.
Smaller players focus on niche segments: Garmin targets endurance athletes with solar charging, Whoop offers subscription-based recovery analytics for enterprise customers, and Oura explores cross-category smart-ring expansion into watch designs. Private-equity-backed roll-ups seek efficiencies but risk eroding brand heritage if cost cuts undermine quality.
Competitive factors now revolve around data-ecosystem strength, AI predictive accuracy, and regulatory mastery rather than screen resolution or processor speed. Partnerships with insurers, hospital networks, and corporate-benefit brokers exert growing influence over channel access and product-roadmap priorities.
North America Smart Watch Industry Leaders
Apple Inc.
Google LLC (Fitbit LLC)
Garmin Ltd.
Samsung Electronics Co., Ltd.
Fossil Group, Inc.
- *Disclaimer: Major Players sorted in no particular order

Market Opportunities and Future Outlook
Clinical-grade feature expansion and reimbursement-linked workflows create a commercialization lane beyond consumer fitness. In the United States, Medicare Remote Patient Monitoring reimbursement of USD 58.92 per month in 2025, along with payer and employer subsidies, supports device procurement models that bundle watches with analytics dashboards, secure APIs, and identity-managed enrollment. This arrangement favors OEMs that can operationalize regulated health features, post-market monitoring, and enterprise administration. Canada adds whitespace through provincial telehealth pilots that reimburse wearable data and require privacy-aligned integrations, pushing vendors to offer configurable consent, de-identification, and data-portability tooling that works across iOS and Android fleets.
Platform and compliance shifts also create near-term opportunities for software modernization and hardware differentiation. The 2026 tightening of general wellness guidance in the United States clarifies how non-invasive sensing products can be positioned without triggering higher regulatory burdens, encouraging broader feature packaging across price tiers when claims remain within allowed boundaries. At the same time, synchronized ecosystem transitions, including 64-bit submission requirements across watchOS and Wear OS timelines and Wear OS feature updates, raise the value of cross-platform developer tooling, test automation, and managed device services for employers, insurers, and care providers running mixed-device populations. Finally, rising scrutiny of mechanical and electrical safety for wearables, alongside RF exposure certification requirements for cellular models, creates an opportunity for manufacturers and ODMs to industrialize compliance testing and documentation as a repeatable capability, reducing time-to-shelf for mass-market and medically oriented products.
Recent Industry Developments
- July 2026: Verizon announced the launch of Gizmo Watch 4, a kid-focused smartwatch featuring Watch Removal Detection and enhanced location-sharing tools. The release supports category segmentation beyond adult fitness and health, reinforcing operator-driven bundles where the smartwatch functions as a standalone connected device for families.
- May 2026: Google announced a broad strategic integration to unify Fitbit health data with Google Health across Wear OS devices and enterprise platforms, enabling cross-platform health data interoperability. The integration expands data-sharing capabilities for employers, insurers, and care providers looking for standardized health analytics across devices.
- May 2025: Garmin unveiled the Forerunner 570 and Forerunner 970 GPS running and triathlon smartwatches aimed at performance-driven athletes. By strengthening its premium multisport lineup, Garmin deepened differentiation versus general-purpose smartwatches through training features and athlete-focused positioning.


Research Methodology Framework and Report Scope
Market Definition and Coverage
For this methodology, the North America smart watch market is defined as revenue generated from wrist-worn smart devices that connect to phones or networks and run apps, including sales through online and offline channels across the region.
Scope exclusions: We exclude basic digital watches and non-watch wearables such as fitness bands, smart rings, and smart glasses, even if they track health metrics.
Segmentation Overview
- By Operating System
- watchOS
- Wear OS (Android)
- Proprietary/RTOS
- Other OS
- By Display Type
- AMOLED
- PMOLED
- TFT-LCD
- Micro-LED
- By Application
- Personal Assistance
- Medical/Health Monitoring
- Sports/Fitness
- Industrial/Field Service
- By Connectivity
- Bluetooth Only
- Bluetooth + Cellular (LTE/eSIM)
- Bluetooth + Wi-Fi
- By Price Range
- ≤ USD 199
- USD 200 – 399
- ≥ USD 400
- By Distribution Channel
- Online Native
- Omni-channel Retail
- By End-user Demographic
- 15-34 Years
- 35-54 Years
- ? 55 Years
- By Country
- United States
- Canada
- Mexico
Data Sources, Market Sizing, and Validation
Desk Research
We start by building a clean fact base on demand, pricing, and device capability cycles using public sources that can be checked by anyone. Common inputs include trade statistics and tariff lines from the US International Trade Commission DataWeb, macro and consumer indicators from the US Bureau of Economic Analysis and US Census Bureau, and digital health and device research published through sources such as the National Institutes of Health.
To avoid missing market signals, we also review company filings, earnings transcripts, investor decks, and product launch notes that clarify mix shifts such as cellular enabled models, health sensor upgrades, and price band movement. When needed, we use paid subscriptions for company financials and news intelligence, and for patent databases to track feature momentum like biosensing and battery improvements. The specific desk sources named here are only illustrative, and other public datasets and documents were also used for collection, cross-checks, and clarification.
Primary Interviews and Surveys
Next, we validate assumptions through expert interviews and structured surveys with ecosystem participants, including device brands, component partners, distributors, retailers, and enterprise buyers using wearables for workforce and safety use cases. We also compare patterns across the United States, Canada, and Mexico so the model reflects differences in carrier bundling, channel mix, and replacement behavior, and then we adjust the final inputs where desk signals and field feedback disagree.
Distribution of primary research fieldwork respondents
| Company type | Respondent position |
|---|---|
| Top tier: 35% | CXOs: 17% |
| Mid tier: 43% | Functional/Unit leaders: 36% |
| Smaller Players: 22% | Managers: 47% |
Market-Sizing & Forecasting
The core sizing starts with a top-down build where shipments and installed base indicators are reconstructed through North America demand signals, and then translated into revenue using price band mix and average selling price movement. To keep totals realistic, we corroborate the results with selective bottom-up approximations such as sampled ASP times unit volumes by channel, supplier and distributor checks on sell-in trends, and consistency checks against major product refresh cycles.
Key inputs include replacement cycles by user cohort, the share of cellular enabled models versus Bluetooth only models, the mix of operating systems tied to the regional smartphone base, the price distribution across sub-USD 199 and higher tiers, and channel shifts between online and store-led sales. Where a bottom-up view has gaps, we interpolate using the closest comparable country behavior and then re-check the output against expert feedback before locking the final number.
For forecasting, we rely on scenario analysis supported by a simple multivariate regression that links demand to disposable income trends, the smartphone base, carrier bundling intensity, and health and fitness adoption indicators. The assumptions are updated using what interviewees expect for feature upgrades, pricing actions, and supply availability over the forecast window.
Data Validation & Update Cycle
We validate the model through multiple rounds of triangulation, where outputs are compared with independent signals such as shipment direction, channel commentary, and observed ASP changes, and then variances are investigated one by one. If a number looks unusual, the team re-checks source definitions, re-tests the math, and re-contacts relevant experts to confirm whether the change is real or caused by a reporting mismatch.
Before sign-off, an internal analyst review is completed to confirm that assumptions, year labeling, and currency treatment are consistent across the file. Reports are refreshed annually, with interim updates triggered by material events such as major product launches, sudden pricing moves, or supply disruptions. Right before delivery, a final pass is done so the client receives the latest view aligned to the most recent inputs.
Mordor Intelligence's North America Smart Watch Market Size Measured Against Other Published Estimates
Published market sizes for smart watches in North America often do not match because the scope and counting rules are not the same, and the base year can also differ by a few years. Differences usually come from whether the estimate captures only end-device revenue, how price bands are treated, and whether the number reflects shipments, sell-in, or sell-through.
The table shows a wide spread in the stated sizes, and in Mordor Intelligence's model the value is built as smart watch device revenue in North America with pricing and mix aligned to watch OS splits, connectivity choices, and channel structure rather than folding in adjacent wearables or accessory revenue.
Benchmark comparison
| Source | Market Size | Gaps in Research Methodology |
|---|---|---|
| Mordor Intelligence | USD 53.10 B (2025) | |
| Regional Consultancy A | USD 18.20 B (2024) | Often reflects a narrower device definition and an earlier base year, and it may apply conservative ASP assumptions that do not fully capture premium mix and cellular model share in North America. |
| Trade Journal B | USD 17.01 B (2022) | Uses an older starting year and may lean on price-band snapshots without fully updating replacement cycles and recent feature-driven upgrade demand, which can compress the revenue total. |
Across the sources, the gap is mainly explained by base-year timing and what gets counted as a smart watch sale versus related categories. By tying the model to clear demand indicators, practical ASP logic, and repeatable validation checks, the estimate stays traceable and easier to reconcile as market conditions change.


Key Questions Answered in the Report
What is the current value of the North America smart watch market?
The market stands at USD 61.74 billion in 2026 and is forecast to reach USD 131.24 billion by 2031.
Which operating system leads shipments in North American smart watches?
Apple’s watchOS leads with 52.68% share of 2025 unit sales, although Wear OS is growing fastest.
How fast is the health-monitoring application segment growing?
Medical and health monitoring functions are advancing at an 17.45% CAGR, set to overtake fitness use by 2028.
Which country is the fastest-growing within North America?
Canada shows the highest growth with a 17.35% CAGR through 2031, driven by telehealth integration.
How significant is online retail for smart watches in the region?
Online-native channels account for 59.80% of sales, benefiting from direct-to-consumer models and virtual try-on tools.
What role do corporate wellness programs play in adoption?
They are pivotal, especially for the 35-54 age group, offering subsidies and reimbursement incentives that accelerate enterprise deployment.
Page last updated on:


 Your data is secure and never sold or shared.


