North America School Bus Market Size and Share
Market Overview
| Study Period | 2019 - 2030 |
|---|---|
| Base Year For Estimation | 2024 |
| Forecast Data Period | 2025 - 2030 |
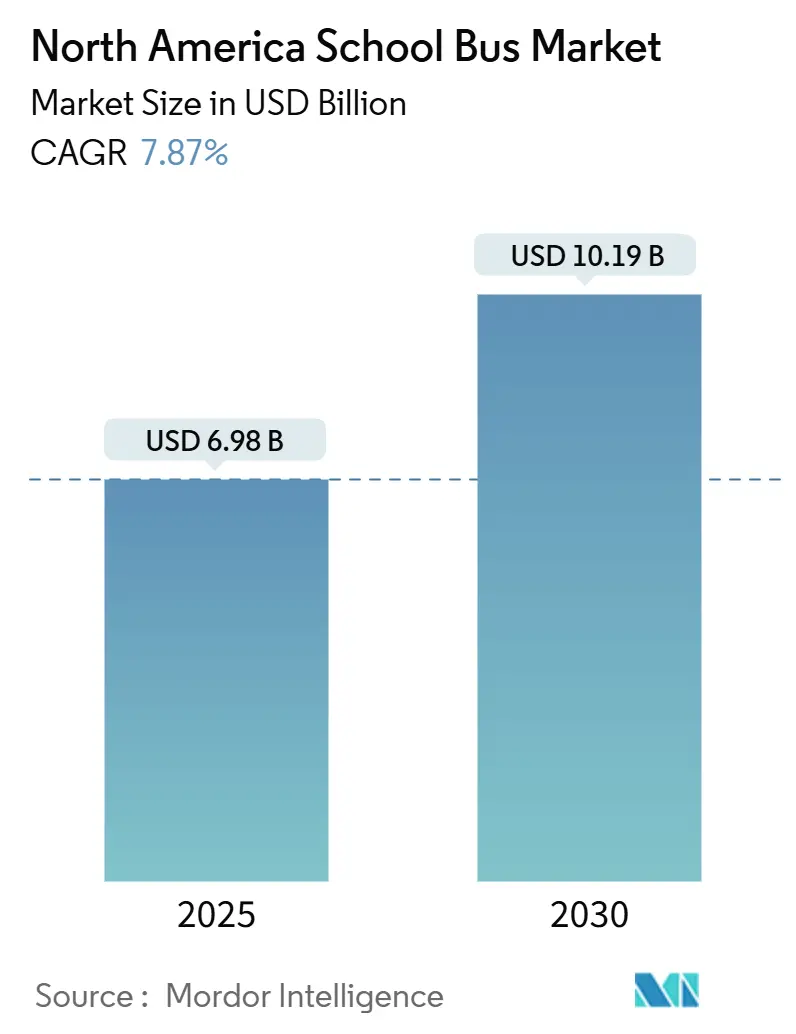
| Market Size (2025) | USD 6.98 Billion |
| Market Size (2030) | USD 10.19 Billion |
| Growth Rate (2025 - 2030) | 7.87% CAGR |
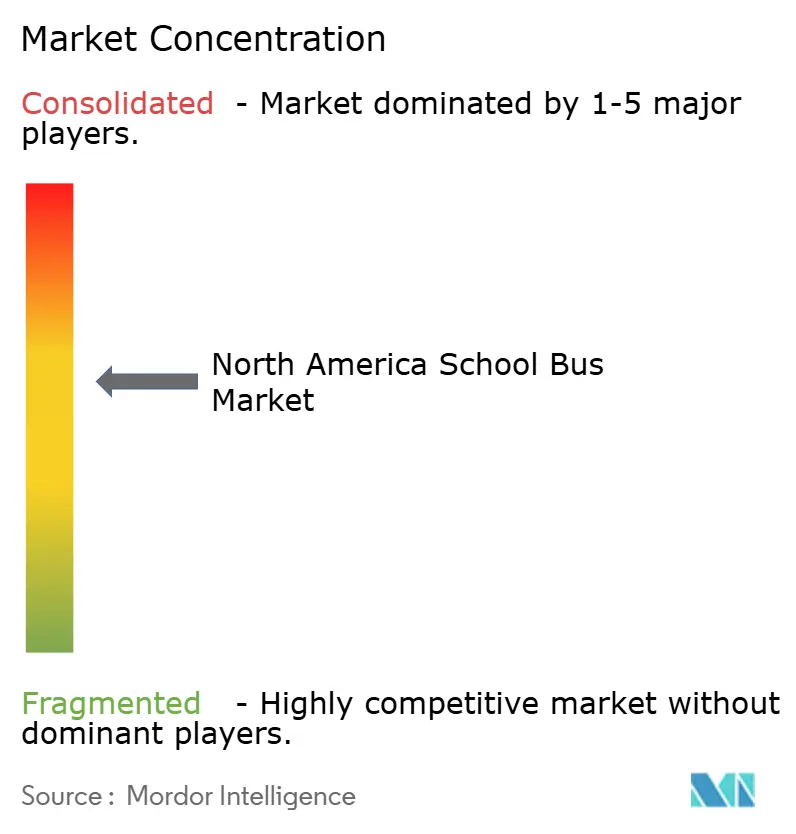
| Market Concentration | Medium |
Major Players *Disclaimer: Major Players sorted in no particular order Image © Mordor Intelligence. Reuse requires attribution under CC BY 4.0. | |
North America School Bus Market Analysis by Mordor Intelligence
The North America school bus market size stands at USD 6.98 billion in 2025 and is projected to reach USD 10.19 billion by 2030, reflecting a CAGR of 7.87% from 2025 to 2030. Momentum stems from unprecedented federal incentives that tilt procurement toward battery-electric models, the mandated upgrade of on-board safety systems, and a cyclical need to replace aging diesel fleets. Clean School Bus Program disbursements, cargo-sized dealer networks, and integrated telematics have amplified order volumes even as rural grid limits and persistent driver shortages temper short-run deliveries. OEMs synchronize chassis launches with compliance deadlines such as Transport Canada’s perimeter-visibility requirement, improving platform standardization across borders. Financing innovations, including energy-as-a-service contracts, are widening access for small districts, while vehicle-to-grid pilots demonstrate revenue upside that could shorten payback periods for electrified fleets.
Key Report Takeaways
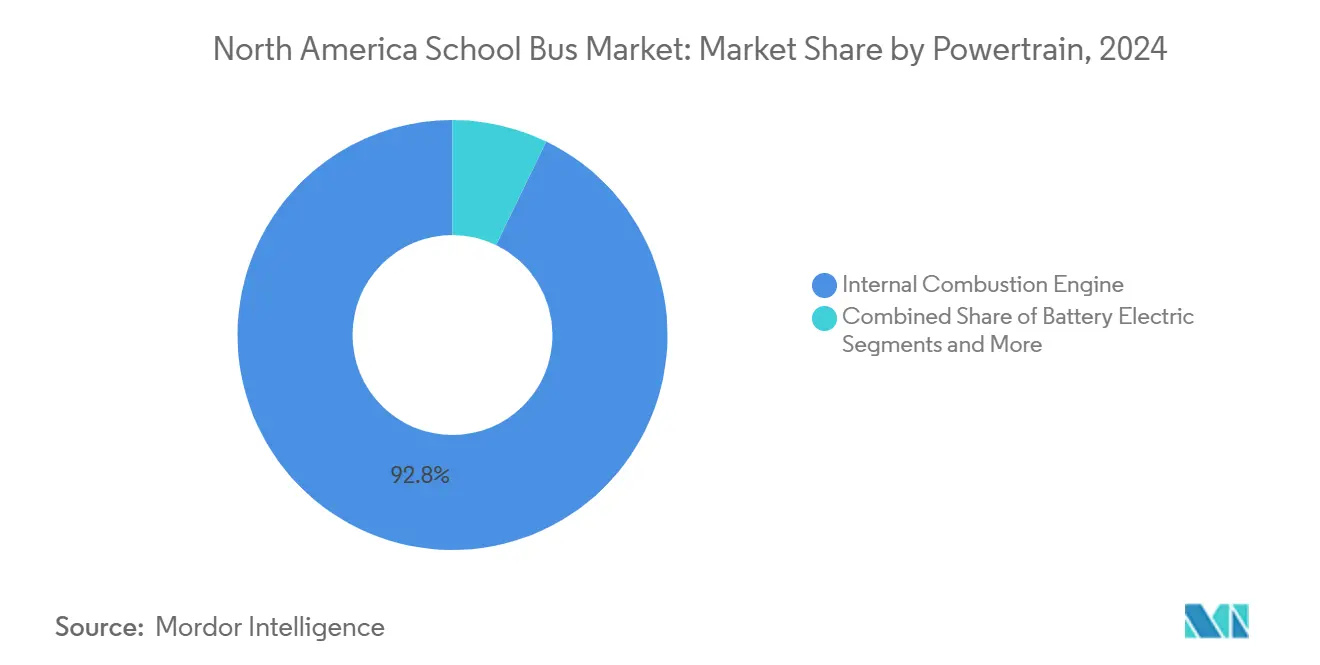
- By powertrain, internal-combustion engines controlled 92.82% of the North American school bus market share in 2024, whereas battery-electric buses are forecast to post the fastest 7.92% CAGR through 2030.
- By bus type, Type C captured 43.24% of the North American school bus market share in 2024, while Type D is expected to expand at an 8.02% CAGR over the same horizon.
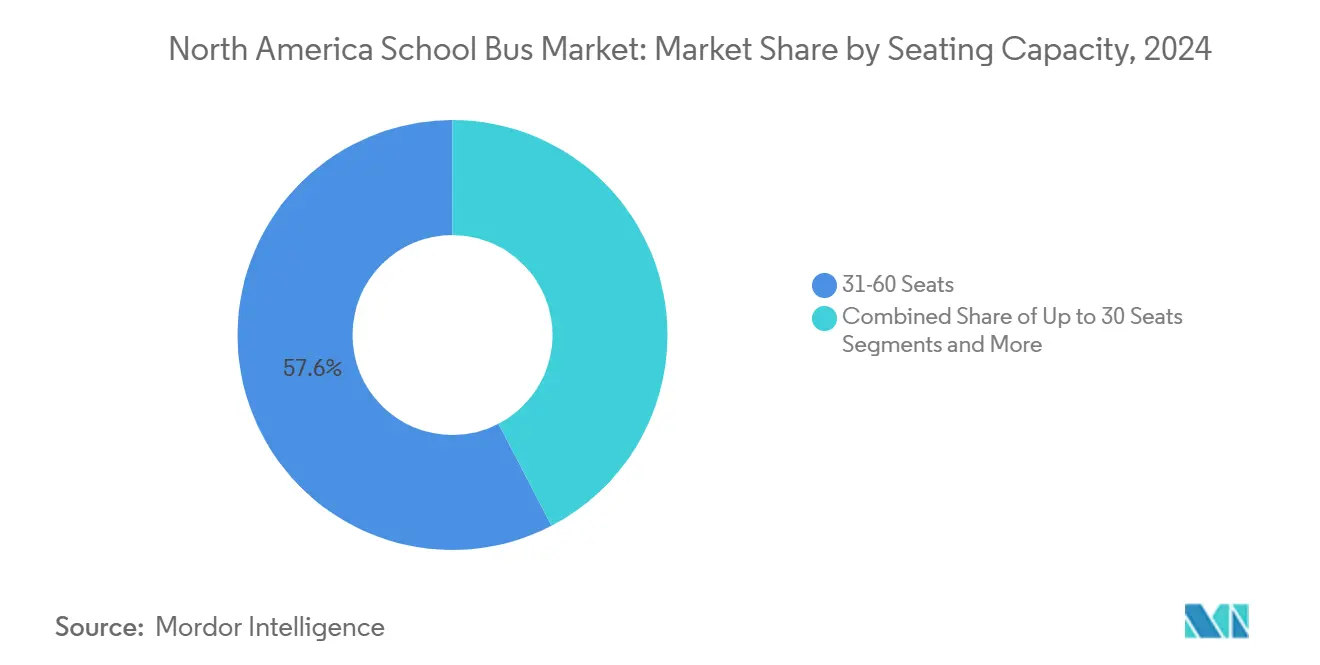
- By seating capacity, the 31-60 seat configuration accounted for 57.62% of the North American school bus market in 2024; below 30-seat models led CAGR growth at 8.28% to 2030.
- By end user, public school districts commanded 80.31% of the North American school bus market share in 2024, whereas private and charter operators are projected to grow the fastest at an 8.65% CAGR through 2030.
- By country, the United States contributed 86.36% of the North American school bus market share in 2024, while Canada is projected to register a leading 8.72% CAGR through 2030.
North America School Bus Market Trends and Insights
Drivers Impact Analysis
| Driver | (~) % Impact on CAGR Forecast | Geographic Relevance | Impact Timeline |
|---|---|---|---|
| Clean-School-Bus Funding | +1.2% | United States, select Canadian provinces | Short term (≤ 2 years) |
| EV Total-Cost-Parity | +0.9% | Urban and suburban districts | Medium term (2-4 years) |
| Stringent Safety Rules | +0.8% | United States and Canada | Medium term (2-4 years) |
| Aging-Fleet Replacement | +0.6% | Rural and suburban districts | Long term (≥ 4 years) |
| Health-Centric Policies | +0.5% | Metropolitan centers | Medium term (2-4 years) |
| Vehicle-To-Grid Revenue | +0.3% | California, Northeast | Long term (≥ 4 years) |
| Source: Mordor Intelligence | |||
United States Takes the Lead in North America's School Bus Market
Federal backing for electric school buses has surged, with the Environmental Protection Agency (EPA) funneling substantial funds via grants and rebates to school districts nationwide. The persistent demand for these initiatives outstrips the resources, underscoring a robust commitment to cleaner transportation. State-level programs further bolster this momentum, with some states rolling out hefty incentives per vehicle or dedicating significant funds to promote zero-emission fleets. Yet, the ebb and flow of funding can complicate long-term strategies, highlighted by recent funding pauses that threw a wrench in procurement schedules. Nevertheless, the strategic blend of local and federal incentives enables numerous urban districts to expedite their shift to electric buses, making the financial commitment more manageable.
Rising Total-Cost-of-Ownership Parity of EV Buses
Due to fuel savings and simpler mechanical systems, electric vehicles are becoming more cost-competitive over their lifetime, reducing maintenance needs. Savings arise from lower wear on components like brakes and the elimination of routine services, such as oil changes. However, the overall cost-effectiveness hinges on factors like local electricity rates and the longevity of battery systems. Financial backing might still be essential for a feasible transition in regions with elevated energy costs or erratic usage patterns. Consequently, decision-makers are prioritizing total ownership costs and available infrastructure incentives when making fleet investment decisions.
Stringent Safety Regulations for Occupant Protection
North American policymakers tighten crashworthiness and visibility rules, compelling districts to purchase buses with stronger bodies and advanced camera suites. The Federal Motor Vehicle Safety Standards cover rollover integrity, joint strength, passenger restraint, and emergency exits, while Transport Canada has mandated 360-degree perimeter imaging on all new buses beginning in November 2027.[1]“Federal Motor Vehicle Safety Standards for School Buses,”, National Highway Traffic Safety Administration, nhtsa.dot.gov While meeting regulatory requirements increases the initial cost of electric vehicles, manufacturers with fully integrated electric platforms can better absorb these demands without sacrificing performance. As older diesel models are phased out, numerous districts are transitioning to electric chassis designed to meet compliance standards, thus streamlining the approval process. In the long run, aligned safety regulations between the United States and Canada are anticipated to lower certification costs for suppliers active in both markets.
Vehicle-to-Grid Revenue Opportunities
School buses often remain idle for long periods during the day, creating opportunities for utilities to tap into their stored energy for grid support. Some districts are already participating in programs that allow buses to feed electricity back into the grid, generating additional revenue and improving the overall economics of electric fleets. As more districts adopt bi-directional charging technology, the potential for grid contributions is expected to grow. While implementation involves navigating technical and regulatory complexities, early pilot programs are proving that these systems can open up new income streams and strengthen the financial case for electrification.
Restraints Impact Analysis
| Restraint | (~) % Impact on CAGR Forecast | Geographic Relevance | Impact Timeline |
|---|---|---|---|
| High Upfront EV Prices | -0.9% | All North America | Medium term (2-4 years) |
| Bus-Driver Shortages | -0.7% | Rural and suburban districts | Short term (≤ 2 years) |
| Battery and Chassis Supply Bottlenecks | -0.6% | United States–Canada assembly plants | Medium term (2-4 years) |
| Limited Rural Grid Capacity | -0.4% | Frontier regions | Long term (≥ 4 years) |
| Source: Mordor Intelligence | |||
High Upfront Cost of Battery-Electric Buses
Despite incentives, electric school buses still carry a hefty price tag compared to diesel ones. Fleet operators are particularly wary of the steep upfront costs, especially for larger models. However, with the promise of long-term savings bolstered by policy support, the financial argument for making the switch is steadily gaining traction. Capital intensity discourages smaller districts that lack bonding capacity or grant-writing staff. Vendors promote lease-purchase and subscription models that bundle vehicles, chargers, and energy costs into a fixed monthly fee to bridge the gap. While these arrangements flatten cash outflows, they can inflate lifetime expenses relative to outright purchase, underscoring the need for transparent cost-benefit analyses.
Battery and Chassis Supply-Chain Constraints
Nickel-manganese-cobalt cathode availability tightened in 2024 as Asia-based processors throttled exports, prompting OEMs to ration production slots or shift to iron-phosphate chemistry. Steel shortages delayed chassis deliveries, compounding lead times already stretched by semiconductor scarcity. Although domestic battery cell plants are ramping, the learning curve and qualification testing defer full output until 2026. Supply tightness, therefore, caps near-term growth regardless of order demand.
Segment Analysis
By Powertrain: Diesel Leads as EV Momentum Builds
ICE configurations anchored 92.82% of 2024 deliveries, giving them the lion’s share of the North American school bus market. The entrenched service network, known diesel residual values, and abundant parts inventories keep operating risk low for cash-strapped districts. Battery-electric orders, however, are compounding quickly from a small base. The North American school bus market size attributable to battery-electric models is forecast to have a 7.92% CAGR through 2030. Safety code FMVSS 305a is fully harmonized with UL 2580 battery standards, providing regulatory certainty that encourages OEM platform investments. Fuel-cell candidates remain experimental as hydrogen supply networks lag far behind charger deployments.
Range, charging dwell, and depot-power requirements shape powertrain choices. Urban operators opt for 100-mile battery packs that allow overnight charging, whereas rural districts still prefer diesel until higher-energy-density chemistries arrive. IC Bus and Blue Bird have announced second-generation electric drivelines with silicon-carbide inverters, promising efficiency gains. Over time, zero-emission mandates in California, New York, and Quebec should chip away at diesel demand, but the incumbent fleet will decline gradually as retirement cycles unfold.
Note: Segment shares of all individual segments available upon report purchase
By Bus Type: Type C Remains the Workhorse
Type C models combine conventional cab layout with a tight turning radius, making them the preferred option for mixed suburban-rural routes. They owned 43.24% of the North American school bus market share in 2024. The dialog between safety, capacity, and range will keep Type C dominant but enable Type D to post the swifter 8.02% CAGR to 2030. Type D transit-style buses are scaling faster because urban districts favor their higher capacity and larger under-floor battery compartments. Electromobility accentuates these design benefits; floor-mounted packs on Type D platforms improve center-of-gravity while preserving passenger seating.
All three major legacy OEMs offer battery-electric variants in Type C and Type D categories, yet delivery timelines differ. Blue Bird’s Georgia plant can complete a Type C EV in seven days, whereas Type D assembly still exceeds 14 days due to bespoke wiring harnesses. Regulatory add-ons such as perimeter-visibility cameras marginally increase curb weight, reinforcing the need for lightweight composite body panels.
By Seating Capacity: Mid-Range Dominance, Small-Bus Agility
Buses configured for 31-60 passengers absorbed 57.62% of revenue in 2024, underpins routing flexibility for the average North American district. This configuration delivers stable dwell times at stoplights, supports single-driver allocation per route, and fits the majority of depot parking stalls. Smaller classes (≤30 seats) are expanding at a 8.28% CAGR through 2030, as districts roll out special-needs shuttles, magnet-school express lanes, and early autonomous pilots.
Large-capacity (>60 seats) coaches thrive in mega-districts such as Los Angeles and Toronto, where route densification reduces operating cost per student. Their extended wheelbase supports mounting up to 240 kWh battery packs, yielding 170-mile ranges even with HVAC loads. Conversely, the smaller units face packaging constraints that limit the range to about 90 miles, which is sufficient for most urban hops but challenging for dispersed rural geographies. Seat-count strategy intersects with electrification readiness, pushing district planners to match capacity with infrastructure availability.
Note: Segment shares of all individual segments available upon report purchase
By End User: Public Districts Dominate, Private Operators Accelerate
Public districts purchased 80.31% of units in 2024 owing to their statutory obligation to provide transportation. These entities tap EPA, state, and provincial funding streams unavailable to private contractors, enabling frequent bulk orders that anchor OEM production forecasts. Nonetheless, private and charter operators, often subsidiaries of global mobility groups, embrace electric powertrains at an 8.65% CAGR. Their business models can amortize higher upfront costs across multi-jurisdiction contracts, and they wield organizational agility to pilot V2G or subscription-based services sooner than public bodies constrained by procurement law.
Leasing companies add another layer, offering turnkey electrification packages that bundle charging hardware, grid upgrades, and maintenance. This mitigates capital barriers for small public districts but erodes some control over operational priorities. As electrification scales, ownership models will diversify further, intensifying competition for predictable route volume and exposing under-capitalized operators to consolidation pressure.
Geography Analysis
The United States accounted for 86.36% of 2024 unit sales, resulting from running the world’s largest student-transportation network with roughly 480,000 yellow buses on the road. Federal stimulus has funneled nearly USD 3 billion into electrification rebates. Production volumes climbed 17.2% in 2023, signaling a robust replacement surge even as component shortages stretched lead times to eight months for certain models. Policy reversals, including 2024 proposals to pause zero-emission credits, injected short-term uncertainty but ultimately failed to derail district plans that had already secured multi-year grant commitments.
Canada, although a fraction of the fleet size, is growing fastest at a 7.72% CAGR. Quebec bolstered its backing for electric school buses by upping subsidies and mandating local manufacturing. This move has already spurred a significant growth in the province's electric fleet. Quebec's provincial policies offer manufacturers in the region a clearer long-term outlook and hasten the adoption of electric buses. Although federal funding has lagged, recent announcements hint at a burgeoning commitment to electrification. Collectively, these initiatives are cultivating a more stable and encouraging landscape for the shift towards zero-emission transportation.[2]“Zero Emission Transit Fund Announcements,”, Infrastructure Canada, infrastructure.canada.caSafety regulations that require perimeter-visibility systems starting 2027 elevate cost baselines yet harmonize with provincial incentives to replace aging diesel units.
The rest of North America, including United States. territories, records minimal volumes but monitors regulatory shifts closely. Rural electrification remains gated by depot-level capacity; transformers rated below 500 kVA cannot handle simultaneous fast-charging for even a half-dozen buses. Consequently, smaller jurisdictions often prioritize hybrid pilot projects or stick with diesel replacements until grid upgrades coincide with scheduled bus retirements. Over the forecast horizon, regional sales patterns will thus reflect the intersection of subsidy depth, infrastructure readiness, and policy certainty.
Competitive Landscape
Market concentration is moderate, with the top legacy OEMs, including Blue Bird, Thomas Built, and IC Bus, commanding the majority of the market share. Their entrenched dealer networks, parts distribution, and compliance track records create a high switching cost for risk-averse districts. Blue Bird delivered its 2,000th electric unit in August 2024[3]“Blue Bird Achieves 2,000th Electric Delivery,”, Blue Bird Corporation, blue-bird.com and is leveraging a USD 80 million DOE grant to enlarge its Georgia plant capacity, underscoring scale advantages.
Younger pure-play electrics face more challenging headwinds. Lion Electric entered creditor protection in early 2025 before a Quebec-led investor consortium rescued operations, but the restructuring voided many U.S. warranties, shaking buyer confidence. GreenPower Motor pivoted to a contract-manufacturing model to preserve cash, outsourcing body assembly while retaining driveline integration. These shifts illustrate the capital-intensive nature of scaling production amid pricing pressure from subsidized legacy players.
With intense competitive rivalry, the market is witnessing mergers and acquisitions. For instance, in January 2024, Forest River acquired Collins Bus for USD 303 million, consolidating Type A offerings under a single roof, promising cross-platform component standardization. Competitive differentiation is migrating from diesel horsepower specs to total-cost-of-ownership analytics, charger uptime guarantees, and V2G compatibility, forcing incumbents to enrich software and energy-management capabilities alongside mechanical upgrades.
North America School Bus Industry Leaders
Blue Bird Corporation
Daimler AG (Thomas Built Buses)
Lion Electric Company
Navistar, Inc.
Forest River Inc. (Collins Bus Corporation)
- *Disclaimer: Major Players sorted in no particular order
Recent Industry Developments
- May 2025: La Caisse, leading a Quebec investor group, acquired Lion Electric. Under the new ownership, the emphasis is on electric school buses, accompanied by plans to revamp the company's operations. Although warranties for U.S. clients have been nullified, there's a clear intention to reintroduce services in pivotal markets.
- March 2025: In a bid to embrace a net-zero carbon future, the Government of Canada, alongside First Canada ULC, announced to channel investments into electric school buses. Their joint effort, amounting to nearly USD 1 million through the Zero Emission Transit Fund (ZETF), bolstered First Canada's push towards fleet electrification.
- September 2024: GreenPower Motor Company, through its Arizona dealer RWC Group, secured a series of orders for six of its all-electric, zero-emission school buses. These orders, funded by the EPA's Clean School Bus Program, serve three separate school districts in Arizona. Additionally, RWC Group is actively seeking more orders under the same initiative.
North America School Bus Market Report Scope
The scope includes segmentation by Powertrain (internal Combustion Engine, Battery Electric, and Fuel Cell Electric), Bus Type (Type A, Type C, and Type D), Seating Capacity (up To 30 Seats, 31–60 Seats, and Above 60 Seats), End User (Public School Districts, Private and Charter Operators, and Contractors and Leasing Companies), and Country (United States, Canada, and Rest of North America). The market forecasts are provided in terms of value (USD) and volume (units).
| Internal-Combustion Engine |
| Battery-Electric |
| Fuel-Cell Electric |
| Type A |
| Type C |
| Type D |
| Up to 30 seats |
| 31 - 60 seats |
| Above 60 seats |
| Public School Districts |
| Private and Charter Operators |
| Contractors and Leasing Companies |
| United States |
| Canada |
| Rest of North America |
| By Powertrain | Internal-Combustion Engine |
| Battery-Electric | |
| Fuel-Cell Electric | |
| By Bus Type | Type A |
| Type C | |
| Type D | |
| By Seating Capacity | Up to 30 seats |
| 31 - 60 seats | |
| Above 60 seats | |
| By End-User | Public School Districts |
| Private and Charter Operators | |
| Contractors and Leasing Companies | |
| By Country | United States |
| Canada | |
| Rest of North America |
Key Questions Answered in the Report
How large is the North America school bus market in 2025?
The North America school bus market size is USD 6.98 billion in 2025 and is forecast to widen to USD 10.19 billion by 2030.
What funding program has the biggest impact on electric school bus adoption?
The EPA’s Clean School Bus Program provides nearly USD 3 billion in rebates and grants, underwriting 8,500 electric units across 1,200 districts.
Which powertrain grows fastest through 2030?
Battery-electric buses post the highest 7.92% CAGR between 2025 and 2030, outpacing diesel and alternative fuels.
What is the primary operational barrier for rural electrification?
Limited depot-level grid capacity raises connection costs and extends timelines, making rural districts cautious about large-scale electric deployments.
Why is Canada growing faster than the United States in percentage terms?
Provinces such as Quebec offer subsidies up to CAD 240,000 per bus and mandate domestic sourcing, pushing Canadian CAGR to 8.72%.


