Market Overview
| Study Period | 2020 - 2031 |
|---|---|
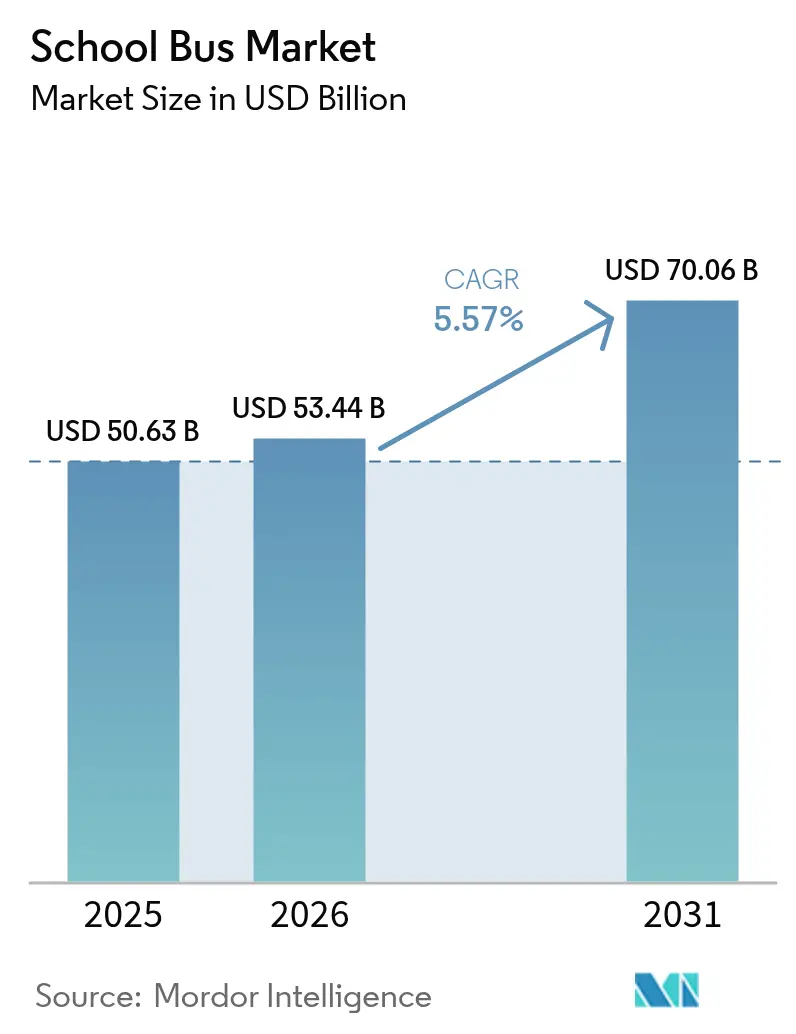
| Market Size (2026) | USD 53.44 Billion |
| Market Size (2031) | USD 70.06 Billion |
| Growth Rate (2026 - 2031) | 5.57% CAGR |
| Fastest Growing Market | Asia Pacific |
| Largest Market | North America |
| Market Concentration | Medium |
Major Players *Disclaimer: Major Players sorted in no particular order Image © Mordor Intelligence. Reuse requires attribution under CC BY 4.0. | |
School Bus Market Analysis by Mordor Intelligence
The School Bus Market size was valued at USD 50.63 billion in 2025 and estimated to grow from USD 53.44 billion in 2026 to reach USD 70.06 billion by 2031, at a CAGR of 5.57% during the forecast period (2026-2031). Accelerated federal and state funding programs, tightening emissions standards, and rapid strides in vehicle electrification collectively underpin that growth trajectory. Manufacturers continue to rebalance portfolio investments toward battery-electric lines as total cost-of-ownership parity with diesel narrows in high-utilization districts. Simultaneously, subscription-based fleet-as-a-service contracts unlock procurement flexibility for budget-constrained operators that lack capital for outright purchases. Competitive intensity has increased as vertically integrated Chinese suppliers leverage their cost advantages to challenge North American incumbents. Meanwhile, software-centric features, such as telematics and vehicle-to-grid (V2G) readiness, are now considered in tender decisions alongside hardware specifications.
Key Report Takeaways
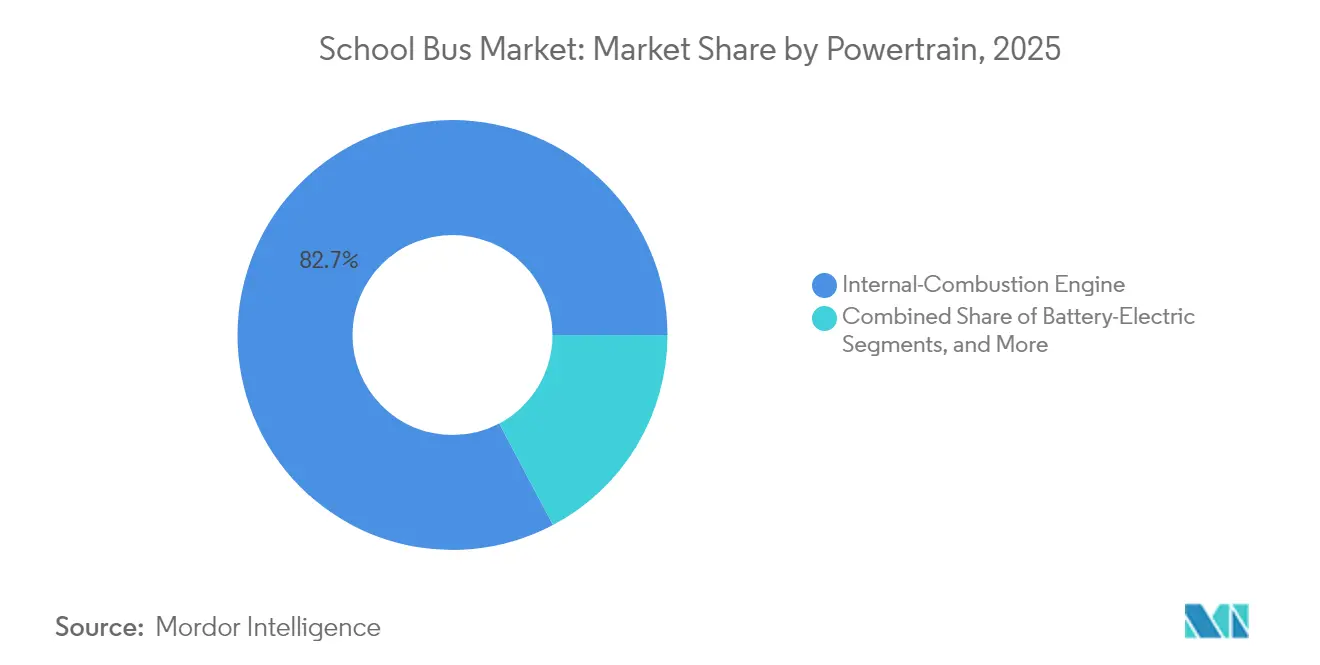
- By powertrain, internal combustion engines led with 82.74% of the school bus market share in 2025, while battery-electric variants are projected to expand at a 5.61% CAGR through 2031.
- By seating capacity, the 31–60 seats category accounted for a 47.29% share of the school bus market size in 2025, while units with less than or equal to 30 seats are advancing at a 5.63% CAGR over the forecast horizon.
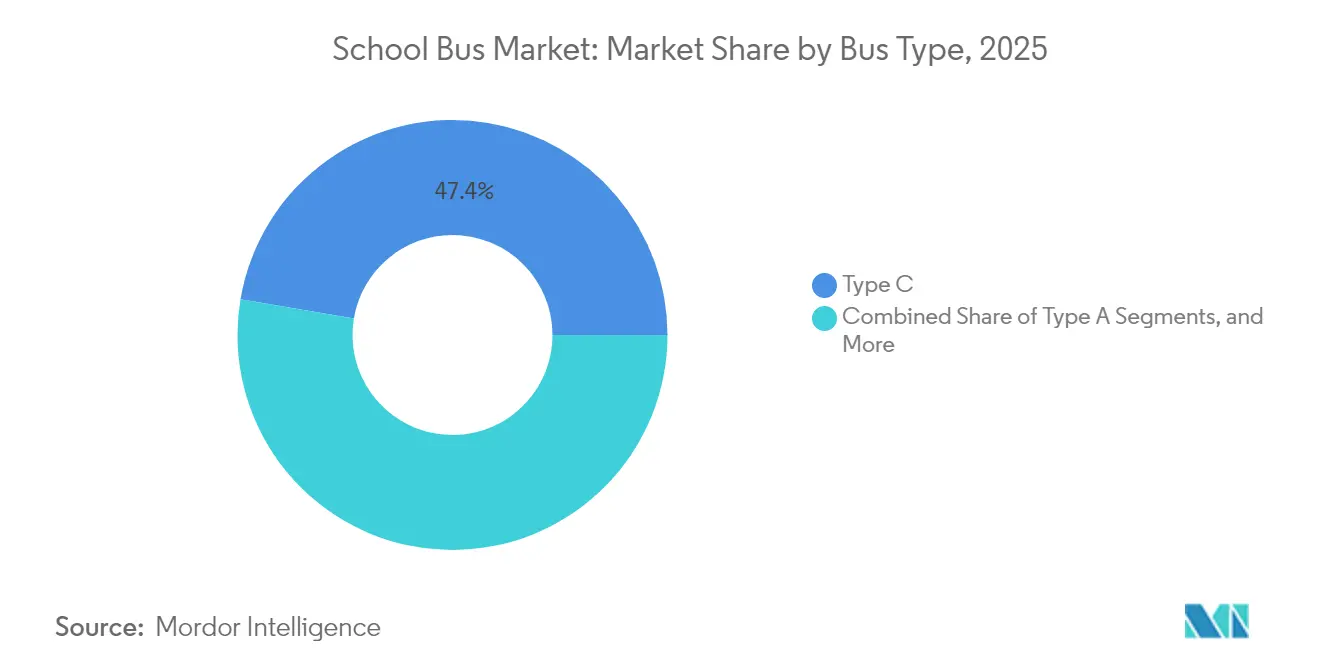
- By bus type, Type C configurations held 47.35% of the school bus market share in 2025, while Type A buses experienced the fastest growth, with a 5.59% CAGR through 2031.
- By end user, public school districts commanded 62.88% of the school bus market share in 2025, while private and charter operators are projected to have the highest CAGR at 5.66% through 2031.
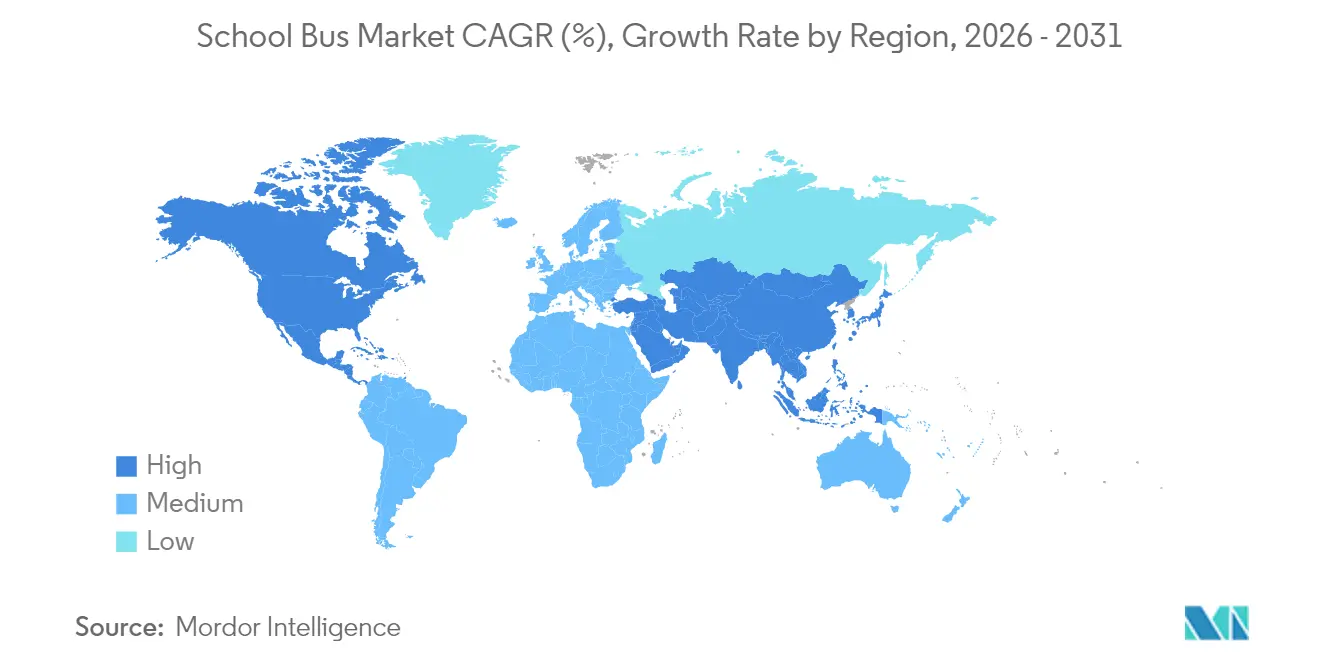
- By geography, North America led with a 38.22% of the school bus market share in 2025; however, the Asia Pacific is poised for the fastest expansion at a 5.64% CAGR through 2031.
Note: Market size and forecast figures in this report are generated using Mordor Intelligence’s proprietary estimation framework, updated with the latest available data and insights as of 2026.
Global School Bus Market Trends and Insights
Drivers Impact Analysis*
| Driver | (~) % Impact on CAGR Forecast | Geographic Relevance | Impact Timeline |
|---|---|---|---|
| Government Emissions Standards | +1.2% | North America and EU, expanding to Asia Pacific | Medium term (2-4 years) |
| Dedicated Federal & State Funding Pools | +0.9% | North America core, pilot programs in EU | Short term (≤ 2 years) |
| Rising Adoption Of Advanced Safety Technologies | +0.6% | Global, with early adoption in developed markets | Long term (≥ 4 years) |
| Vehicle-To-Grid (V2G) Revenue Potential | +0.4% | North America and EU pilot regions | Medium term (2-4 years) |
| Subscription-Based Fleet-As-A-Service Models | +0.3% | Global, concentrated in urban districts | Medium term (2-4 years) |
| AI-Driven Route Optimisation | +0.2% | Global, technology-forward districts | Long term (≥ 4 years) |
| Source: Mordor Intelligence | |||
Government Emissions Standards Accelerating Fleet Electrification
California’s Advanced Clean Fleets Rule requires all new purchases to be zero-emission by 2035, a standard mirrored by several U.S. states and now influencing European municipal tenders. Compliance frameworks include tradable carbon credits, enabling districts to monetize avoided emissions and reinvest those proceeds in further fleet modernization efforts. Euro VII particulate limits come into effect in 2025 and will effectively phase out legacy diesel powertrains, compelling European operators to identify zero-emission alternatives. Failure to comply results in route restrictions that reduce service flexibility, making electrification an operational imperative rather than an environmental preference [1]“Clean School Bus Program,” U.S. Environmental Protection Agency, epa.gov .
Dedicated Federal & State Funding Pools for Zero-Emission School Buses
The United States Infrastructure Investment and Jobs Act allocated a massive amount exclusively to clean school bus acquisition grants, the most significant single stimulus in the sector's history. Disbursements prioritize disadvantaged communities, accelerating the diffusion of technology where budget gaps have historically hindered modernization. Complementary state vouchers, such as California’s HVIP, add up to a substantial amount per bus, effectively eliminating virtually all incremental capital premiums relative to diesel. Domestic-content rules embedded in many of those incentives tilt purchasing decisions toward local assembly lines, shaping global sourcing strategies [2]“Infrastructure Investment and Jobs Act Fact Sheet,” U.S. Department of Transportation, transportation.gov .
Rising Adoption of Advanced Safety Technologies
Revised FMVSS regulations require automatic emergency braking and blind-spot detection on new school buses starting in 2025. Compliance drives deeper integration of ADAS stacks alongside telematics, allowing real-time oversight of driver behavior and vehicle health. Larger OEMs capitalize on scale in R&D, widening the capability gap with smaller rivals. Districts also benefit from one-fifth insurance premium reductions when robust safety suites are in place, which further strengthens purchase justification [3]“FMVSS Final Rule for Automatic Emergency Braking,” National Highway Traffic Safety Administration, nhtsa.gov .
Vehicle-to-Grid Revenue Potential for School Districts
School buses, typically idle for most of the day, present a prime opportunity for bidirectional charging. In pilots across Massachusetts and California, each vehicle generates significant ancillary service revenue, as utilities cover the costs for peak shaving and frequency response services. These additional revenues transform buses from mere cost centers into valuable grid assets, significantly reducing the payback period on electric models in regions with high participation.
Restraints Impact Analysis*
| Restraint | (~) % Impact on CAGR Forecast | Geographic Relevance | Impact Timeline |
|---|---|---|---|
| High Upfront Cost | -0.8% | Global, most acute in developing markets | Short term (≤ 2 years) |
| Limited Charging / Hydrogen Refuelling Infrastructure | -0.6% | Rural areas globally, developing markets | Medium term (2-4 years) |
| Battery-Supply Volatility | -0.4% | Global, concentrated in lithium-dependent regions | Medium term (2-4 years) |
| Shortage Of Technicians Skilled | -0.3% | Global, most severe in rural and developing markets | Long term (≥ 4 years) |
| Source: Mordor Intelligence | |||
High Upfront Cost of Electric & Fuel-Cell Variants
Electric buses are significantly more expensive than their diesel counterparts due to the high cost of battery packs, which make up a substantial portion of the vehicle's overall cost. The volatility in raw material prices, particularly for lithium and nickel, creates budget uncertainties, further complicating procurement decisions. Fuel-cell platforms are even more costly, primarily because of the expenses associated with onboard hydrogen storage, high-pressure lines, and fuel-cell stacks, which remain expensive to produce. Financing challenges are most pronounced in rural and low-income districts, where access to traditional bonds or green financing tools is limited. This results in uneven adoption rates, even in regions where subsidies are widely available.
Limited Charging or Hydrogen Refueling Infrastructure
Purchasing a single Level 3 depot charger involves significant costs. Additionally, these chargers often require substantial grid upgrades, which can further increase expenses for districts. Installation timelines are typically lengthy, usually extending well beyond a year, which can delay projects past their intended academic-year deadlines. Hydrogen refueling infrastructure is even more limited, with very few publicly accessible heavy-duty refueling sites available nationwide. This limitation restricts the adoption of fuel-cell vehicles to specific regions, such as certain corridors in California. Furthermore, rural grid capacity constraints could either leave vehicles inoperable or force operational adjustments, ultimately compromising the expected service improvements.
*Our forecasts treat driver/restraint impacts as directional, not additive. The impact forecasts reflect baseline growth, mix effects, and variable interactions.
Segment Analysis
By Powertrain: Electrification Accelerates Despite ICE Dominance
Internal combustion engines held 82.74% of the school bus market share in 2025, as existing maintenance infrastructure and familiarity with diesel procurement kept diesel engines steady among cash-strapped districts. Battery-electric buses are the fastest-growing subcategory, tracking a 5.61% CAGR through 2031, as operators leverage federal grants and declining battery prices to justify the transition's economics. Fuel-cell variants remain a niche market, concentrated in regions with policy mandates and accessible hydrogen supply lines. Regenerative braking and fewer moving parts enable 60–70% lower maintenance costs for electric buses, thereby reducing total lifecycle expenses.
Current battery densities enable single-charge ranges of 150–200 miles, which are sufficient to cover most daily routes without requiring midday charging. Fuel-cell systems offer quick refueling but rely on a sparse station network, which limits their adoption to demonstration fleets. Overall, the powertrain shift is re-architecting supplier contracts as battery pack sourcing becomes the critical bottleneck in the school bus market.


By Seating Capacity: Compact Configurations Address Changing Demographics
Buses with 31–60 seats accounted for 47.29% of the school bus market share in 2025, an optimal compromise that meets average route demand without oversizing fleets. Vehicles with ≤30 seats are projected to chart a 5.63% CAGR through 2031, benefiting districts that increasingly segment routes by grade level, special needs, or after-school activities.
Models exceeding 60 seats fill high-density corridors but face infrastructure constraints, such as turning radius and curb length, that slow their growth. Smaller capacity aligns with demographic trends, including reduced household sizes and higher school-choice variability, both of which increase route diversity. Districts also redeploy smaller buses for field trips or athletic transport, maximizing asset utilization. This resizing trend suggests that future manufacturing lines may shift towards multiplicity rather than single, high-volume models, reshaping the capacity planning calculus in the school bus market.
By Bus Type: Smaller Formats Gain Urban Traction
Type C buses represented 47.35% of the school bus market share in 2025, favored for suburban and rural routes that balance capacity with moderate operating speeds. Type A buses experience the quickest uptake, with a 5.59% CAGR through 2031, because their compact footprints navigate congested city streets and accommodate special education routes with fewer passengers. Type B units fill mid-demand corridors while high-capacity Type D models dominate densely populated districts, albeit at lower incremental growth rates.
Many municipalities prefer Type A platforms for magnet school and extracurricular programs, where agile maneuvering offsets higher per-seat cost. Conversely, Type D adoption remains tied to major metropolitan systems that can support a larger curbside footprint and driver license requirements. The shift underlines a broader focus on route optimization rather than maximum capacity, offering differentiated opportunities across chassis suppliers in the school bus market.
By End User: Private Operators Embrace Innovation
Public districts still account for 62.88% of the school bus market share in 2025, largely due to their statutory responsibility for student transportation in most North American jurisdictions. Private and charter operators are delivering the highest growth trajectory, with a 5.66% CAGR, driven by flexible financing schemes and shorter decision cycles. Contractors and leasing specialists bundle vehicles, drivers, and maintenance into performance-based contracts, transferring operational risk from education boards to fleet professionals.
Private entities can more readily pilot electric or fuel-cell platforms because they can adjust the route mix without school board approvals, thereby accelerating technology validation at a smaller scale. This dynamic positions service providers as innovation diffusion channels, enabling broader adoption of fleet electrification once early hurdles are overcome.
Geography Analysis
North America secures 38.22% of the school bus market share in 2025, reflecting cumulative advantages in funding, manufacturing, and grid integration. State-utility partnerships support V2G pilots that transform parked fleets into distributed energy resources, offsetting higher acquisition expense. Canada contributes additional momentum via green infrastructure funds and emissions-reduction targets, while Mexico’s role in USMCA streamlines supply chains but leaves adoption centered in metropolitan corridors.
The Asia Pacific registers the sector’s highest forward momentum, tracking a 5.64% CAGR through 2031, as China couples compulsory electrification targets with domestic battery capacity, which compresses cost curves. India’s National Electric Bus Program widens the addressable base, with tier-two cities procuring purpose-built school buses for the first time. Japan and South Korea embed advanced ADAS, elevating regional safety benchmarks that reverberate into international standards.
Europe maintains stable gains as Euro VII standards phase out high-sulfur diesel and national stimulus funds subsidize alternative drivetrains. Germany explores hydrogen routes, leveraging existing fuel-cell competencies, while the United Kingdom emphasizes rural service connectivity through smaller bus footprints. Southern European economies progress more cautiously due to fiscal headroom constraints, yet municipal congestion-charging schemes indirectly hasten diesel replacement.

Competitive Landscape
Top North American brands dominate the school bus market, leveraging historical contracts. However, they're increasingly feeling the heat from competitors like BYD and Yutong, who are pushing for sharper pricing. Blue Bird and Thomas Built Buses are pivoting their assembly lines toward battery-electric models, a move bolstered by U.S. funding rules that emphasize local content. In contrast, Lion Electric is focusing on purpose-built electric chassis, steering clear of retrofits, and gaining favor with forward-thinking districts.
Chinese players are reaping benefits from a vertically integrated battery supply, significantly reducing bill-of-materials costs. This development has prompted established players to forge long-term cell agreements, a strategy aimed at cushioning against margin declines. Simultaneously, collaborations between OEMs and telematics companies underscore the rising significance of data insights, overshadowing traditional hardware. These alliances offer predictive maintenance alerts, route analytics, and safety compliance dashboards, giving partners a competitive edge in bids.
Recent strategic maneuvers highlight the industry's evolving landscape. In early 2025, Thomas Built Buses introduced its next-generation Saf-T-Liner C2 Jouley, featuring advanced e-axle technology and an extended range. Lion Electric is expanding its manufacturing facility in Illinois, aiming for a substantial increase in annual output, with a notable focus on battery-electric models. BYD's move to localize pack assembly in California underscores its commitment to U.S. content standards. Together, these initiatives signal a decisive pivot from diesel to full electrification, altering supplier dynamics and capital investment strategies in the school bus arena.
School Bus Industry Leaders
Tata Motors Ltd.
Yutong Bus Co. Ltd.
Ashok Leyland Ltd.
Thomas Built Buses Inc.
IC Bus LLC (International Motors, LLC)
- *Disclaimer: Major Players sorted in no particular order


Recent Industry Developments
- October 2025: Thomas Built Buses Inc. introduced Wattson, its Type D electric school bus, in North America. Built on the HDX2 platform, the bus features a 246 kWh battery, offering a range of 150 miles.
- October 2025: GreenPower's all-electric school bus deployments have commenced in New Mexico through a partnership with the New Mexico Economic Development Department (EDD). The New Mexico All-Electric, Purpose-Built, Zero-Emission School Bus Pilot Project will be implemented at two public schools in Las Vegas and one charter school in Santa Fe.
- January 2025: Thomas Built Buses launched its second-generation Saf-T-Liner C2 Jouley electric school bus, adding an Accelera by Cummins 14Xe eAxle and a 219-inch wheelbase option.


Global School Bus Market Report Scope
The school bus is a type of bus that is used to ferry children to and fro from school or activities related to school. School buses may be owned by the school or leased by bus providers. School buses are built with specific seating arrangements and luggage-carrying shelves that are designed for children.
The school bus market is segmented by propulsion type, capacity design, and geography. By propulsion type, the market is segmented as internal combustion engine (IC), Compressed natural gas (CNG)/liquified natural gas (LNG), and electric and hybrid. By capacity design, the market is segmented as Type A, Type B, Type C, and Type D. By geography, the market is segmented as North America, Europe, Asia-Pacific, and the Rest of the World.
The report offers market size and forecasts for the school bus market in value (USD) and volume (units) for all the above segments.
By Powertrain
| Internal-Combustion Engine (ICE) |
| Battery-Electric |
| Fuel-Cell Electric |
By Seating Capacity
| Less than or equal to 30 Seats |
| 31–60 Seats |
| More than 60 Seats |
By Bus Type
| Type A |
| Type B |
| Type C |
| Type D |
By End User
| Public School Districts |
| Private & Charter Operators |
| Contractors & Leasing Companies |
By Geography
| North America | United States |
| Canada | |
| Rest of North America | |
| South America | Brazil |
| Argentina | |
| Rest of South America | |
| Europe | Germany |
| United Kingdom | |
| France | |
| Italy | |
| Spain | |
| Russia | |
| Rest of Europe | |
| Asia Pacific | China |
| Japan | |
| India | |
| South Korea | |
| Rest of Asia Pacific | |
| Middle East and Africa | Saudi Arabia |
| United Arab Emirates | |
| Turkey | |
| South Africa | |
| Egypt | |
| Rest of Middle East and Africa |
| By Powertrain | Internal-Combustion Engine (ICE) | |
| Battery-Electric | ||
| Fuel-Cell Electric | ||
| By Seating Capacity | Less than or equal to 30 Seats | |
| 31–60 Seats | ||
| More than 60 Seats | ||
| By Bus Type | Type A | |
| Type B | ||
| Type C | ||
| Type D | ||
| By End User | Public School Districts | |
| Private & Charter Operators | ||
| Contractors & Leasing Companies | ||
| By Geography | North America | United States |
| Canada | ||
| Rest of North America | ||
| South America | Brazil | |
| Argentina | ||
| Rest of South America | ||
| Europe | Germany | |
| United Kingdom | ||
| France | ||
| Italy | ||
| Spain | ||
| Russia | ||
| Rest of Europe | ||
| Asia Pacific | China | |
| Japan | ||
| India | ||
| South Korea | ||
| Rest of Asia Pacific | ||
| Middle East and Africa | Saudi Arabia | |
| United Arab Emirates | ||
| Turkey | ||
| South Africa | ||
| Egypt | ||
| Rest of Middle East and Africa | ||


Key Questions Answered in the Report
How large is the global school bus market in 2026?
The school bus market size is expected to be USD 53.44 billion by 2026.
What is the forecasted growth rate for the sector to 2031?
The market is expected to register a 5.57% CAGR between 2026 and 2031.
Which powertrain is growing fastest within school transportation?
Battery-electric buses are projected to demonstrate the highest forecast CAGR of 5.61%, driven by federal funding and lower maintenance costs.
Why is Asia Pacific viewed as the prime growth engine?
Mandatory electrification mandates in China and India’s large-scale bus programs push Asia Pacific to a 5.64% CAGR, outpacing other regions.
What revenue can a school district expect from vehicle-to-grid programs?
Pilot programs have documented USD 2,000–USD 4,000 in yearly revenue per electric bus through demand-response and frequency-regulation services.
Which bus type is expanding fastest in urban routes?
Compact Type A models lead growth at a 5.59% CAGR as city districts favor easier maneuverability in tight traffic environments.
Page last updated on:


