Shipbuilding Market Size and Share
Market Overview
| Study Period | 2020 - 2031 |
|---|---|
| Market Size (2026) | USD 164.47 Billion |
| Market Size (2031) | USD 206.24 Billion |
| Growth Rate (2026 - 2031) | 4.62% CAGR |
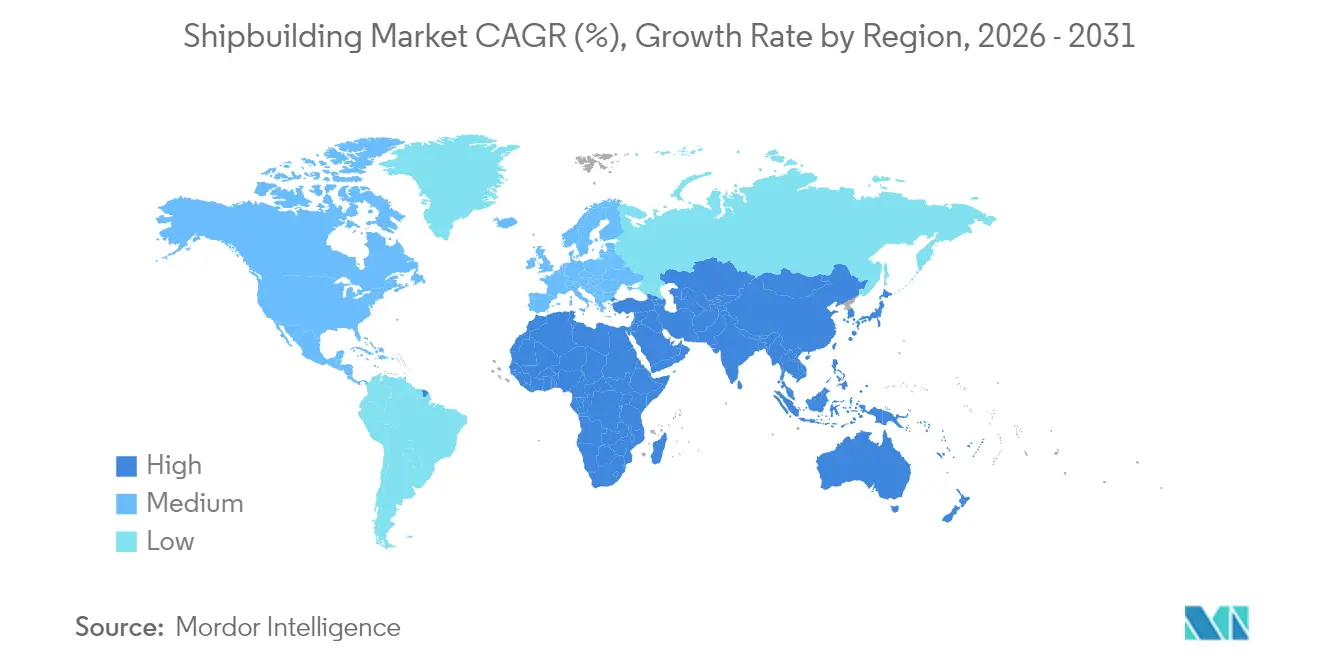
| Fastest Growing Market | Middle East and Africa |
| Largest Market | Asia Pacific |
| Market Concentration | Medium |
Major Players *Disclaimer: Major Players sorted in no particular order Image © Mordor Intelligence. Reuse requires attribution under CC BY 4.0. | |
Shipbuilding Market Analysis by Mordor Intelligence
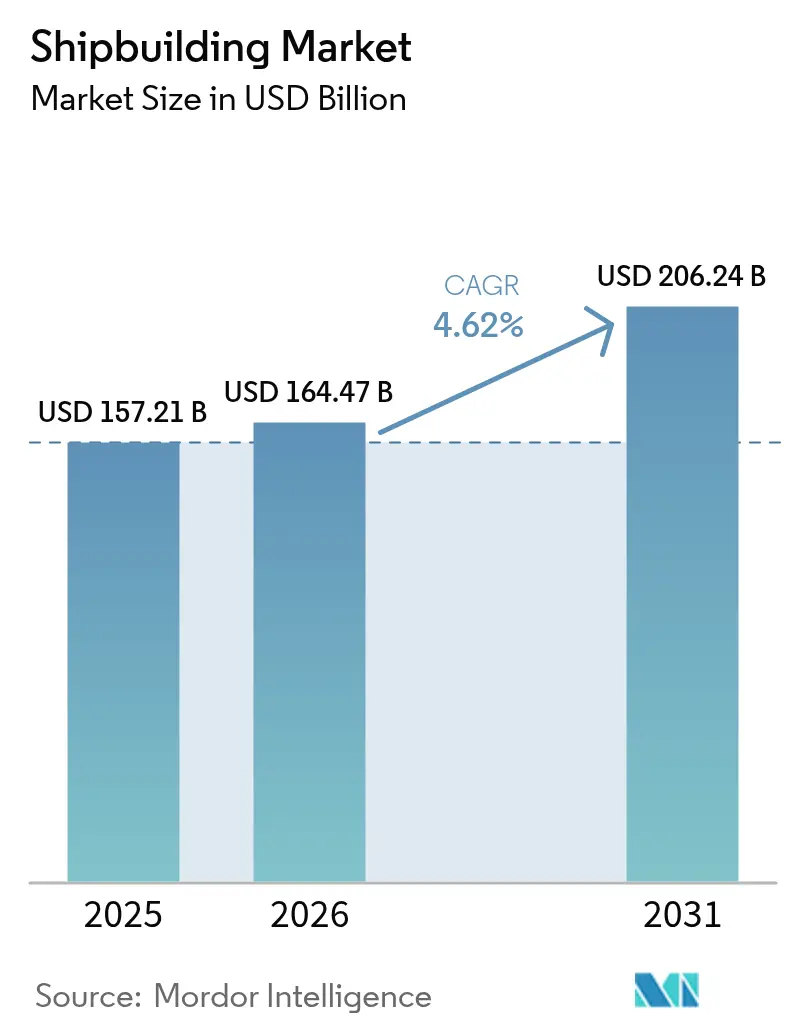
The Shipbuilding Market size was valued at USD 157.21 billion in 2025 and estimated to grow from USD 164.47 billion in 2026 to reach USD 206.24 billion by 2031, at a CAGR of 4.62% during the forecast period (2026-2031). This buoyant outlook stems from stricter carbon-emission targets, growing seaborne trade volumes, and record alternative-fuel newbuilding contracts that collectively offset pockets of overcapacity. China's vast orderbook, South Korea’s technological leadership in LNG carriers, and emerging Middle East and African energy projects feed a sustained work pipeline for yards. High steel cost volatility and tight berth availability have lifted average newbuilding prices since late 2020, yet owners continue to book forward slots to meet IMO 2028 rules. As advanced yards deploy digital twins and modular block techniques, construction cycle times fall, enabling quicker monetization of rising freight demand and catalyzing another layer of competitive differentiation within the shipbuilding market.
Key Report Takeaways
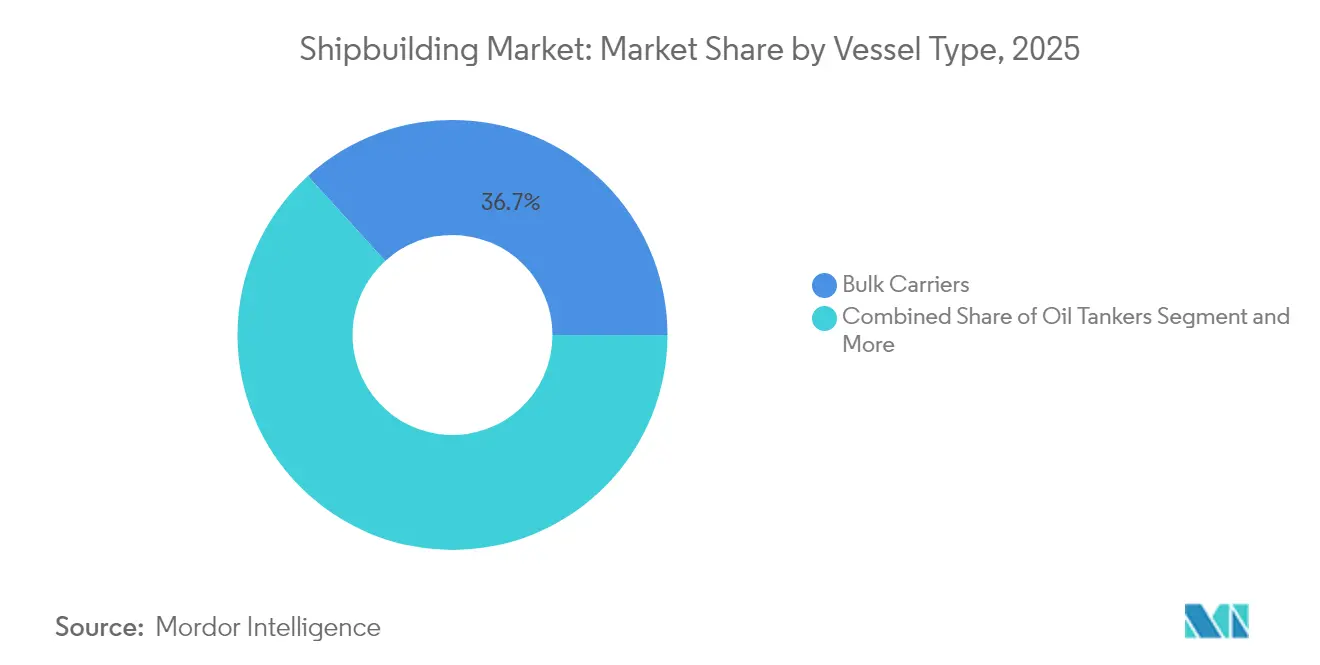
- By vessel type, Bulk Carriers held 36.74% of the shipbuilding market share in 2025, while Offshore Support Vessels are projected to record the fastest 4.71% CAGR through 2031.
- By propulsion technology, conventional engines retained 72.85% of the shipbuilding market share in 2025, whereas methanol and ammonia-ready designs are forecast to grow at a 4.86% CAGR to 2031.
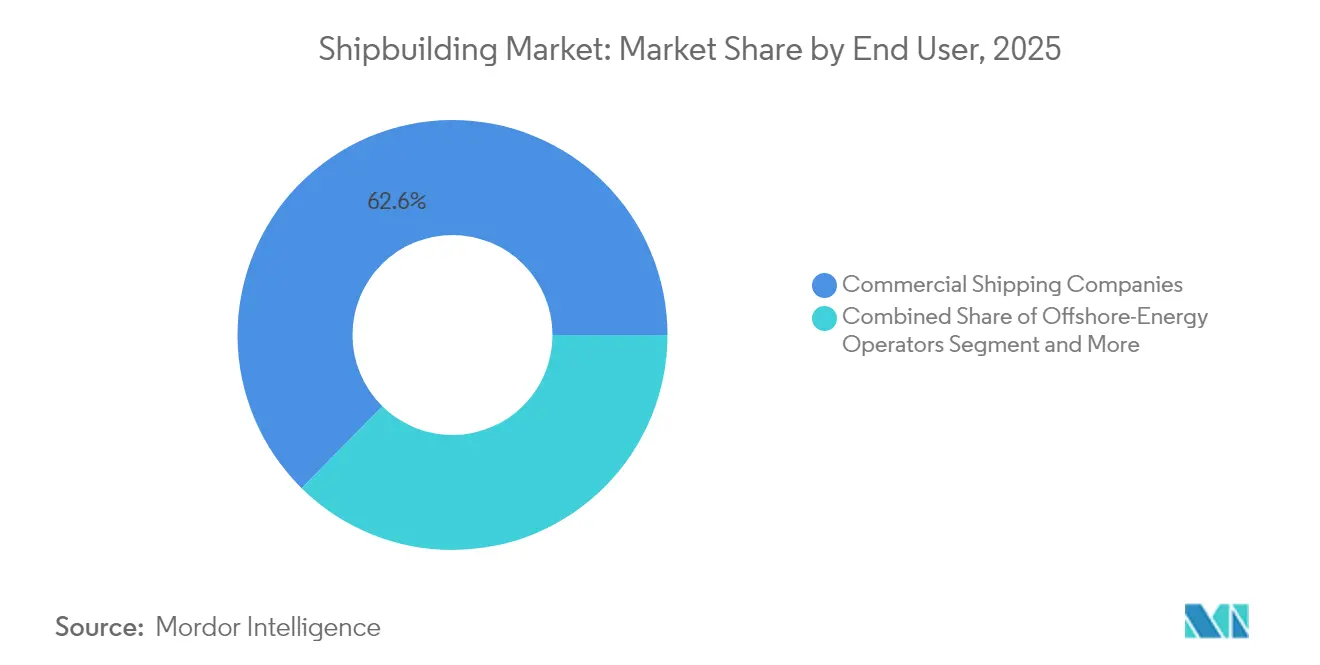
- By end user, Commercial Shipping Companies had a 62.62% share of the shipbuilding market in 2025, while Offshore-Energy Operators are advancing at a 4.74% CAGR between 2026 and 2031.
- By material, steel accounted for 80.58% of the shipbuilding market share in 2025, and composites plus advanced alloys are set to expand at a 4.79% CAGR through 2031.
- By geography, Asia-Pacific captured 38.30% of the shipbuilding market share in 2025, and the Middle East & Africa region is poised for the leading 4.77% CAGR over the forecast period.
Note: Market size and forecast figures in this report are generated using Mordor Intelligence’s proprietary estimation framework, updated with the latest available data and insights as of 2026.
Global Shipbuilding Market Trends and Insights
Drivers Impact Analysis*
| Driver | (~) % Impact on CAGR Forecast | Geographic Relevance | Impact Timeline |
|---|---|---|---|
| Rising Global Seaborne Trade Volumes | +1.2% | Global, with Asia-Pacific core | Medium term (2-4 years) |
| Decarbonisation Mandates Driving Alt-Fuel Orders | +0.9% | Global, EU and IMO compliance focus | Medium term (2-4 years) |
| Surge In Demand For LNG-Fuelled Carriers | +0.8% | Global, Qatar and US supply dominance | Long term (≥ 4 years) |
| Naval Fleet Modernisation Programmes | +0.7% | North America, Asia-Pacific, Europe | Long term (≥ 4 years) |
| Offshore-Wind Installation Vessel Demand | +0.6% | North America, Europe, Asia-Pacific | Medium term (2-4 years) |
| Digital-Twin-Enabled Modular Construction | +0.4% | Advanced shipbuilding hubs globally | Long term (≥ 4 years) |
| Source: Mordor Intelligence | |||


Rising Global Seaborne Trade Volumes
Containerized cargo rebounded sharply in 2024 as volumes grew significantly, lifting the active container fleet by 1 million TEU and underpinning fresh bookings across Chinese, Korean, and Japanese yards[1]“Review of Maritime Transport 2024,” United Nations Conference on Trade and Development, unctad.org . Persistent rerouting around the Cape of Good Hope in response to Red Sea security risks expanded tonne-mile demand even though headline throughput via Suez plunged more than four-fifths. Higher voyage distances sustain demand for bulkers and larger, more fuel-efficient boxships despite operational hiccups linked to port congestion. Europe’s push to diversify LNG away from the United States toward Qatar and West Africa widens Atlantic trade lanes, reinforcing the long-haul requirement. These dynamics collectively add positive torque to the shipbuilding market pipeline through mid-decade.
Surge in Demand for LNG-Fuelled Carriers
Global LNG consumption is projected to climb by three-fifths by 2040 as Asia seeks lower-carbon feedstock for power and heavy industry[2]“Global Gas Outlook 2024,” International Energy Agency, iea.org . QatarEnergy’s purchase of 15 LNG carriers at Samsung Heavy Industries pushed the builder’s LNG backlog to 86 ships. At the same time, Hanwha Ocean has delivered 180 vessels to date and plans to raise annual throughput to 24 hulls by 2025 end. Shell expects marine LNG demand to increase exponentially by 2030, making dual-fuel propulsion the dominant transitional choice. Although geopolitical headwinds could redirect cargoes, the sheer supply of Qatari trains and U.S. export terminals locks in an extended wave of liquefaction growth, translating into multiyear visibility for the shipbuilding market.
Naval Fleet Modernisation Programmes
Twenty-three NATO members will hit the minimum GDP defense-spending threshold in 2024, underpinning a procurement cycle reshaping fleet requirements. Such programs order surface combatants, auxiliaries, and specialized support ships that require advanced combat-system integration, therefore steering high-margin demand to digitally sophisticated yards in South Korea, Japan, Spain, and the United States. Substantial naval backlogs add structural depth to the shipbuilding market beyond cyclical commercial swings.
Decarbonisation Mandates Driving Alt-Fuel Orders
The IMO’s 2028 carbon-intensity cut of almost one-fifth versus VLSFO pushes owners toward methanol and ammonia engines that can unlock compliance headroom[3]“MEPC 80 Outcomes,” International Maritime Organization, imo.org . Orders for alternative-fuel vessels leapt by half in 2024 to 27 ammonia-ready and 322 methanol-ready ships, positioning early movers for competitive freight-rate premiums once carbon taxation scales up. FuelEU Maritime and EU ETS charges could reach USD 300-1,000 per metric ton by 2040, exceeding fossil fuel costs and tipping economic rationales firmly toward green tonnage. These regulations anchor a multiyear renewal cycle inside the shipbuilding market by accelerating replacement timetables.
Restraints Impact Analysis*
| Restraint | (~) % Impact on CAGR Forecast | Geographic Relevance | Impact Timeline |
|---|---|---|---|
| Volatile Steel And Raw-Material Prices | -0.9% | Global, China supply dominance | Short term (≤ 2 years) |
| Skilled-Labour Shortage In Key Hubs | -0.8% | North America, Europe, advanced yards | Long term (≥ 4 years) |
| Global Yard Over-Capacity In Bulk Segment | -0.7% | Global, particularly China | Medium term (2-4 years) |
| Stricter Imo Ghg Regulation Cost Burden | -0.6% | Global, EU waters most affected | Medium term (2-4 years) |
| Source: Mordor Intelligence | |||
Volatile Steel and Raw-Material Prices
Chinese rebar fell more than one-fifth, and iron-ore benchmarks dropped drastically in 2024, creating gluts that swing global quotes weekly. Hot-rolled coil averaged USD 850 per ton during the year, while aluminum prices have also spiked and remain volatile. Yard profit margins tighten because a single 200,000-dwt bulker uses up to 20,000 tons of plate, exposing builders to tens of millions in price swings during multiyear build slots. Anti-dumping measures in India and Thailand complicate raw-material sourcing and elevate logistics costs. Consequently, some owners delay signing new contracts, compressing near-term intake for the shipbuilding market.
Global Yard Over-Capacity in the Bulk Segment
Delivery schedules show TEU of new container space hitting water in 2025 against demand growth, and nearly 500 dry-bulk ships were added between 2020 and 2024, while scrapping sat at a 17-year low. Chinese yard capacity expanded one-fifth yearly, pushing order visibility out to 2027 for many builders, yet utilization remains uneven outside large state groups. This overhang pressures freight rates and prompts shipowners to wait for clarity, trimming short-term inquiries in the shipbuilding market.
*Our forecasts treat driver/restraint impacts as directional, not additive. The impact forecasts reflect baseline growth, mix effects, and variable interactions.
Segment Analysis
By Vessel Type: Bulk Carriers Lead Despite Offshore Support Vessel Surge
Bulk Carriers represented 36.74% of the shipbuilding market share in 2025, translating into the single-largest stake of the shipbuilding market. Economies of scale, low-speed engines, and scrubber retrofits underpin ongoing ordering. Meanwhile, container segments fight overcapacity yet pivot to larger neo-Panamax designs that can twin efficiency gains with decarbonisation pathways. Tanker demand swung on sanction-driven trade re-routing, which favored long-haul Aframax and Suezmax tonnage.
Offshore Support Vessels deliver the fastest 4.71% CAGR to 2031 as global turbine foundations scale up to 130-meter monopiles. China logged a robust spike in offshore order books yearly, gaining share against European incumbents through cost-quality parity. Naval surface combatants contribute a steady stream of technically complex hulls that stabilize cash flows. Cruise bookings improved post-pandemic, yet owners remain measured, focusing on LNG dual-fuel and methanol-ready tonnage. This balanced spread cushions cyclicality, sustaining a broad volume base for the shipbuilding market.


By Propulsion Technology: Alternative Fuels Challenge Conventional Dominance
Conventional engines still powered 72.85% of the shipbuilding market share in 2025 because bunker fuel infrastructure is globally available, and crew familiarity is high. Dual-fuel LNG uptake accelerates under Shell’s projection that seaborne demand could jump three-fifths by 2040, yet fuel network gaps in Africa and South America constrain deployment geography. Hybrid-electric modules appear first in offshore wind and research vessels where station-keeping precision trumps cost.
Methanol and ammonia-ready contracts grow at a 4.86% CAGR as engine makers such as MAN ES and WinGD validate commercial models for the 2025 handover. Nuclear propulsion remains naval-only, but next-gen microreactors could reach commercial feasibility post-2035, opening another shift vector for the shipbuilding market.
By End User: Commercial Shipping Dominates While Offshore Energy Accelerates
Commercial Shipping Companies absorbed 62.62% of the shipbuilding market share in 2025, bolstered by a two-fifth growth in container throughput during Q1 2024. Bigger but slower boxships meet carbon budgets through economies of scale, while liner alliances target vessel-sharing to lighten capex. Bulk owners hedge fuel risk via index-linked charters that justify early investment in dual-fuel hulls, giving them a regulatory cushion.
Offshore-Energy Operators thrive at a 4.74% CAGR as turbine sizes jump and floater concepts penetrate deeper waters. The Asia-Pacific supply chain could channel into wind-fleet construction by 2050, supporting an upstream equipment boom. Naval agencies add a parallel cockpit of demand with multi-role frigates and patrol craft, especially across Indo-Pacific sea lines. Cruise lines and scientific agencies represent niche but specialized slices, yet their requirement for custom features maintains high value per compensated gross ton, further enriching the shipbuilding market.
By Material: Steel Dominance Faces Composite Challenge
Steel represented 80.58% of the shipbuilding market share in 2025, reflecting legacy supply chains and competitive pricing against composites. Plate volatility forces yards to negotiate hedge clauses or lock fixed-price stockpiles to protect project margins. China’s growing export footprint in global steel trade between 2022 and 2024 applies downward rate pressure but raises anti-dumping friction.
Composite and advanced alloys expand at a 4.79% CAGR through 2031 as owners chase weight savings of two-fifths for superstructures and fast ferries. Nearly four-fifths of EU yards either use or intend to adopt fiberglass or carbon-fiber hulls, helped by FIBRE4YARDS demonstrations that validated lifetime cost parity with steel over 25 years. Aluminum 5000-series alloys gain ground in patrol craft due to more potent strength-to-weight properties and natural corrosion resistance. Such material innovation gradually re-sculpts the procurement mix of the shipbuilding market.
Geography Analysis
Asia-Pacific carried 38.30% of the shipbuilding market share in 2025, underlining its pivotal weight in the shipbuilding market. China alone secured three-fifths of worldwide orders and shipped three-fourths of bulk carriers. Low labor costs, integrated supply chains, and a vast domestic steel base make Chinese yards cost-competitive even after factoring in currency appreciation. Through advanced containment technology, South Korea protects high-value niches such as LNG carriers, commanding over three-fifths global gas-tanker output. Despite aging demographics restricting the workforce, Japan defends its share in quality-driven segments and zero-emission pilot projects.
The Middle East & Africa region is forecast to log the fastest 4.77% CAGR through 2031 as oil and gas capex flows into energy logistics corridors, IEA.ORG. Saudi Arabia and the UAE award large heavy-lift and module-carrier projects that require regional construction due to national-content thresholds. Turkey emerges as an LNG relay node between U.S. exporters and European buyers amid Red Sea instability, stimulating dry-dock and newbuild investments. North America leverages Jones Act rules to keep high-value installation vessel builds onshore, and the U.S. Navy’s 30-year plan anchors multiprogram funding. European yards face environmental compliance that accelerates fleet renewal, but subdued steel consumption and macroeconomic headwinds temper yard utilization. Nonetheless, Norway and Denmark lead R&D in methanol and ammonia propulsion that finds early-adopter clients. South America registers selective growth, with Brazil’s naval-focused ProSub initiative placing orders for submarines and support ships. This mosaic of regional imperatives sustains diversified opportunities across the shipbuilding market.

Competitive Landscape
Competition within the shipbuilding market remains moderate but intensifies as Chinese yards close the technology gap. The merger of China State Shipbuilding Corporation with China Shipbuilding Industry Company forms a behemoth projected to grow exponentially, nearly double that of Hyundai Heavy Industries. Samsung Heavy Industries secured LNG orders, and Hanwha Ocean passed 180 delivered units, demonstrating Korea’s anchorage in high-spec gas carriers. Japanese yards like Imabari and Japan Marine United cooperate on methanol-ready designs to fortify competitiveness.
White-space openings revolve around alternative-fuel propulsion and offshore wind lifters, where European affiliates like Cadeler and Van Oord still hold design advantages. Chinese private player Yangzijiang posted order backlogs drastically after yard expansion, signaling rising scale contestation. Technology adoption is a separator: digital twin platforms, AI-directed welding robots, and modular megablocks compress cycle times by up to one-fifth, freeing capacity.
Sustainability credentials become a procurement criterion, prompting established yards to commit to carbon-neutral production methods or risk exclusion from green-finance-conditioned orders. The competitive chessboard fuels dynamic pricing and constant innovation inside the shipbuilding market.
Shipbuilding Industry Leaders
China State Shipbuilding Corporation
Mitsubishi Heavy Industries Ltd.
Samsung Heavy Industries
Daewoo Shipbuilding & Marine Engineering Co., Ltd
Hyundai Heavy Industries Co. Ltd.
- *Disclaimer: Major Players sorted in no particular order


Recent Industry Developments
- March 2025: CMA CGM awarded a USD 2.6 billion contract to a Chinese yard for LNG dual-fuel boxships, reinforcing China’s strength in green containership construction.
- January 2025: Cadeler accepted Wind Maker, Hanwha Ocean Shipyard's sixth wind-turbine installation vessel. It is equipped with a 2,600-ton crane for 65-meter water depths.
- December 2024: Samsung Heavy Industries clinched a USD 508 million order for two very large ethane carriers, lifting its 2024 intake to USD 7.3 billion and underscoring its persistent gas-carrier appetite.


Global Shipbuilding Market Report Scope
Shipbuilding is the construction of large seagoing vessels, primarily of steel, but other materials, such as wood and composites, can also be employed.
The shipbuilding market is segmented by type, by end-user, and by geography. By type, the market is segmented into vessel, container, passenger, and other types. By end user, the market is segmented into transport companies, military, and other end users. By geography, the market is segmented into North America, Europe, Asia-Pacific, and the rest of the World.
The report offers the market sizes and forecast in value in (USD ) for all the above segments.
| Bulk Carriers |
| Oil Tankers |
| Product / Chemical Tankers |
| LNG / LPG Carriers |
| Container Ships |
| General Cargo Ships |
| Passenger & Cruise Ships |
| Offshore Support Vessels |
| Naval & Coast-Guard Vessels |
| Specialized (Ro-Ro, Car Carriers, etc.) |
| Conventional (HFO/DO) |
| Dual-Fuel LNG |
| Methanol / Ammonia Ready |
| Hybrid-Electric |
| Nuclear (Naval) |
| Commercial Shipping Companies |
| Offshore-Energy Operators |
| Passenger Transport & Cruise Lines |
| Defence & Coast Guards |
| Others (Research, Fisheries) |
| Steel |
| Aluminium |
| Composites & Advanced Alloys |
| North America | United States |
| Canada | |
| Rest of North America | |
| South America | Brazil |
| Chile | |
| Rest of South America | |
| Europe | Germany |
| United Kingdom | |
| France | |
| Italy | |
| Norway | |
| Spain | |
| Russia | |
| Rest of Europe | |
| Asia-Pacific | China |
| Japan | |
| South Korea | |
| India | |
| Rest of Asia-Pacific | |
| Middle East and Africa | United Arab Emirates |
| Saudi Arabia | |
| Turkey | |
| South Africa | |
| Rest of Middle East and Africa |
| By Vessel Type | Bulk Carriers | |
| Oil Tankers | ||
| Product / Chemical Tankers | ||
| LNG / LPG Carriers | ||
| Container Ships | ||
| General Cargo Ships | ||
| Passenger & Cruise Ships | ||
| Offshore Support Vessels | ||
| Naval & Coast-Guard Vessels | ||
| Specialized (Ro-Ro, Car Carriers, etc.) | ||
| By Propulsion Technology | Conventional (HFO/DO) | |
| Dual-Fuel LNG | ||
| Methanol / Ammonia Ready | ||
| Hybrid-Electric | ||
| Nuclear (Naval) | ||
| By End User | Commercial Shipping Companies | |
| Offshore-Energy Operators | ||
| Passenger Transport & Cruise Lines | ||
| Defence & Coast Guards | ||
| Others (Research, Fisheries) | ||
| By Material | Steel | |
| Aluminium | ||
| Composites & Advanced Alloys | ||
| By Geography | North America | United States |
| Canada | ||
| Rest of North America | ||
| South America | Brazil | |
| Chile | ||
| Rest of South America | ||
| Europe | Germany | |
| United Kingdom | ||
| France | ||
| Italy | ||
| Norway | ||
| Spain | ||
| Russia | ||
| Rest of Europe | ||
| Asia-Pacific | China | |
| Japan | ||
| South Korea | ||
| India | ||
| Rest of Asia-Pacific | ||
| Middle East and Africa | United Arab Emirates | |
| Saudi Arabia | ||
| Turkey | ||
| South Africa | ||
| Rest of Middle East and Africa | ||


Key Questions Answered in the Report
What is the current value of the shipbuilding market?
The shipbuilding market size is USD 164.47 billion in 2026 and is projected to rise to USD 206.24 billion by 2031.
Which region leads new ship construction?
Asia-Pacific holds 38.30% of global revenue, with China alone capturing 71% of orders.
Which vessel type commands the largest share of ongoing builds?
Bulk Carriers lead with a 36.74% slice of 2025 deliveries.
How are decarbonisation rules influencing ship design?
IMO 2028 and EU carbon schemes drive 50% annual growth in methanol- and ammonia-ready orders and lift alternative fuel demand.
What material trends are emerging in hull construction?
Composites and aluminum are growing at a 4.79% CAGR to trim weight and fight corrosion, although steel still covers 80.58% of tonnage.
Where are the fastest growth opportunities?
Offshore wind installation vessels and Middle East & Africa energy projects show the highest growth rate through 2031.
Page last updated on:


